Family Math: M&M Color Statistics
What can you do with hundreds and hundreds of M&M's? Family math!
My family's lineup of summer hands-on science, technology, engineering, and math projects and activities included almost enough M&M's to bring Charlie and the Chocolate Factory to mind. Maybe not quite that many, but summer was busy, and when I added three bags of M&M's to the list with this project in mind, I had in my head that we needed big bags of M&M's. When we sat down later with three kids, each with a family-sized bag of M&M's, and called up the family-ready activity version of the M&M Math project, I realized we really could have used much smaller bags.
Undeterred (they are M&M's, after all, and not likely to go to waste!), we moved ahead. The activity calls for counting the M&M's in (at least) three different bags. This lets students analyze what is in a single bag and then compare those numbers to statistical data derived from combining and averaging the results of three or more bags.
I had three kids at the ready, so my plan was to have each tackle sorting, counting, and tallying a single giant bag. This way they each got to be hands-on, do their own math, get the results for their own bag, and then we would compile the data to get overall statistical information and see how each bag held up to the numbers.
The question in the project is pretty straightforward: which color M&M is most (or least) common in a bag of M&M's? I remember when I was a kid, and it seemed that the green M&M's were always rare. So before we started, I polled the kids. Two of them predicted a color they thought would be most common. One of them leaned toward thinking the colors would be equally dispersed, reasoning that a factory machine probably spits them out in relatively equal numbers.
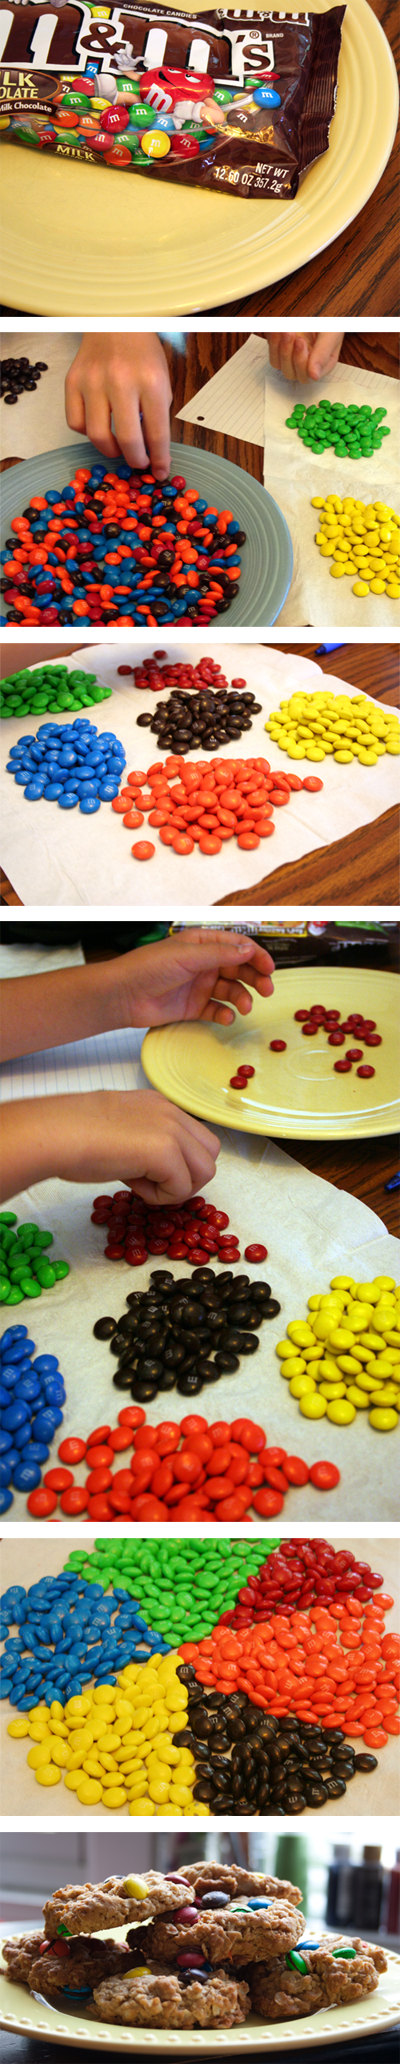
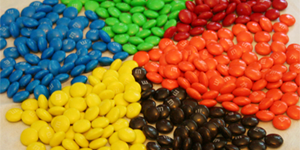
Then we got to counting. There are many ways a student might approach this part of the project. One strategy that worked well at our table was to dump an entire bag of M&M's on a plate, and then sort them by color into piles on a large napkin. After the bag was sorted by color, the student started counting the M&M's of a single color and dropping them back onto the plate. All M&M's on the plate had been counted, and the piles remaining on the napkin were still to be counted. It was an easy way to keep track of the counting and the piles.
There was a lot of counting going on!
But it was immediately interesting to hear that the totals around the table were differing, sometimes dramatically, for each kid.
When they finished, they each did their tallying, finding out the total number of M&M's and the percentage of each color they had in their bag. Then we made a new chart, copied in all of the individual totals, and combined and averaged to get composite data.
The results were surprising, and not all of our bags held up to what the data told us should be true, which was interesting in terms of realizing that all bags are not created equal!
Sweet Success
In the end, this hands-on math activity was a lot of fun and worked well for a mix of age ranges that spanned elementary and middle school. I knew going into it that the math involved was on the easy side for the middle school kids. But as an exercise, the activity gave them a chance to get hands-on with statistics doing something that gave concrete and visual clarity and reinforcement to concepts they already know, like averages (mean) and probability, and introducing some potentially new terms like population and frequency. [Note: The Science Buddies M&M Math Project Idea guides a more detailed and comprehensive statistics exploration, including the creation of data charts and graphs. A student interested in this project and exploring statistics can take the activity further than we did for our family science activity!]
When finished, one kid made a pyramid of M&M's, which of course crashed and caused a great uproar from the disgruntled engineer. Another made a pie chart of the M&M's on the napkin, a work of art that was then, of course, unceremoniously dumped into a baggie during cleanup. The third bag of M&M's was put to very good use making Monster Cookies. It seemed to me to be a perfectly sweet way to end our hands-on science project and reward all that counting!
What did your science project or family science activity look like? If you would like to share photos taking during your project (photos like the ones above or photos you may have put on your Project Display Board), we would love to see! Email us at blog@sciencebuddies.org.
Categories:
You Might Also Enjoy These Related Posts:
- 15 STEM Gifts & Science Kits You'll Feel Good About Giving
- 13 Boat Science and Submarine Science Projects and Experiments
- July 4th STEM! Summer Science Picks for Independence Day!
- 12 Science Kits for Summer Science Experiments and Discovery
- 15 Science Projects to Make and Give for Father's Day
- Ready, Set, Go! (Awesome Summer Science Experiments)
- Awesome Summer Science Experiments
- 10 STEM Activities with Cardboard Tubes