Abstract
Scientists have known for hundreds of years that sunspot activity waxes and wanes over a cycle that lasts approximately 11 years. In the 1970's, scientists discovered that the sun periodically blasts electrified gases into space, in huge outbursts called 'coronal mass ejections,' or CMEs. This project asks the question: do CMEs follow the solar sunspot cycle?Summary
Andrew Olson, Ph.D., Science Buddies
/-/https/www.sciencebuddies.org/cdn/Files/2802/5/Astro_img086.jpg)
Objective
The goal of this project is to determine whether there is a correlation between coronal mass ejection activity and the solar sunspot cycle, using historical data.
Introduction
You know that the sun is the ultimate source of energy for most life on earth. Sunlight warms the atmosphere and supplies the energy that plants use to grow. Did you also know that the sun sometimes releases huge bursts of electrified gases into space? These bursts are called coronal mass ejections (or CMEs). When CMEs are directed towards Earth they can generate auroras, the spectacular atmospheric displays also known as "northern lights" (see Figure 1).
/-/https/www.sciencebuddies.org/cdn/Files/2802/5/Astro_img086.jpg)
Figure 1. An example of an aurora photographed in northern Wisconsin, November 20, 2001 by Chris VenHaus (used with permission, Copyright Chris VenHaus, 2001)
CMEs can not only put on a spectacular light show, they can also wreak havoc with earth-orbiting satellites and sometimes even ground-based electrical systems. To understand how they can cause such widespread damage, here are some basic facts of solar physics from a NASA press release to help put things in perspective (NASA, 2003).
"At over 1.4 million kilometers (869,919 miles) wide, the Sun contains 99.86 percent of the mass of the entire solar system: well over a million Earths could fit inside its bulk. The total energy radiated by the Sun averages 383 billion trillion kilowatts, the equivalent of the energy generated by 100 billion tons of TNT exploding each and every second.
But the energy released by the Sun is not always constant. Close inspection of the Sun's surface reveals a turbulent tangle of magnetic fields and boiling arc-shaped clouds of hot plasma dappled by dark, roving sunspots.
Once in a while—exactly when scientists still cannot predict—an event occurs on the surface of the Sun that releases a tremendous amount of energy in the form of a solar flare or a coronal mass ejection, an explosive burst of very hot, electrified gases with a mass that can surpass that of Mount Everest." (NASA, 2003)
To understand where CMEs originate, you should do background research on the structure of the sun. The layers of the sun are illustrated in Figure 2, (ESA & NASA, 2007a).
/-/https/www.sciencebuddies.org/cdn/Files/2801/3/Astro_img076.gif)
Diagram shows slices and cross-sections of the interior and surface of the sun. The inner regions of the sun are the innermost core, radiative and convective zones. The diagram also shows prominence, flare, corona, chromosphere, coronal hole, photosphere and sunspots on the surface and above the surface of the sun.
Figure 2. The layers of the sun. (ESA & NASA, 2007a)
CMEs were discovered in the early 1970's, although their existence had been suspected for a long time before that (Howard, 2006). The Solar and Heliospheric Observatory (SOHO) satellite, a project of international cooperation between ESA and NASA, has been observing the sun in unprecedented detail since its launch in 1995.
Sunspots are another solar phenomenon that have a much longer history of scientific study than CMEs. Sunspots were first discovered by Galileo Galilei in 1612, when he noticed dark patches in telescopic images of the sun. Galileo made regular observations of sunspots and was able to prove that he was seeing features on the surface of the sun, which moved as the sun rotated. (Another interesting project involving sunspots is to recreate Galileo's experiments using satellite imagery that you can collect online. See Using the Solar & Heliospheric Observatory Satellite (SOHO) to Determine the Rotation of the Sun.)
What is a sunspot, anyway? The SOHO Explore Glossary defines a sunspot this way: "a temporary disturbed area in the solar photosphere that appears dark because it is cooler than the surrounding areas. Sunspots consist of concentrations of strong magnetic flux. They usually occur in pairs or groups of opposite polarity that move in unison across the face of the Sun as it rotates." (SOHO Explore Glossary, 2006)
/-/https/www.sciencebuddies.org/cdn/Files/2798/5/Astro_img019.gif)
Figure 3. Reproduction of one of Galileo's sunspot drawings from his book on the subject, published in 1613. (Van Helden, A. and E. Burr, 1995)
To see what sunspots looks like using modern instrumentation, here are two images of the sun's photosphere, taken by the Solar and Heliospheric Observatory (a joint project of NASA and the European Space Agency). The one on the left was taken on November 15, 1999. The one on the right was taken on February 20, 2006.
/-/https/www.sciencebuddies.org/cdn/Files/2796/5/Astro_img016.gif)
/-/https/www.sciencebuddies.org/cdn/Files/2797/5/Astro_img017.gif)
Figure 4. Solar and Heliospheric Observatory (SOHO) Michelson Doppler Imager (MDI) intensitygrams, showing the brightness of the sun's photosphere in visible light. Dark areas are sunspots. White box indicates the region covered by high-resolution imager. The image on the left was taken on November 15, 1999. The image on the right was taken on February 20, 2006.
For more solar images, check out the SOHO links in the Bibliography. The EIT (Extreme ultraviolet Imaging Telescope) images show the sun's atmosphere for specific wavelengths in the ultraviolet region of the spectrum. For example, at 171 angstroms (one angstrom is one ten-billionth of a meter, or 10-10 m) the UV light is mostly emitted by Fe IX and X (iron ionized 8 or 9 times) at 1 million Kelvin. The iron emissions provide a dramatic visualization of the magnetic field lines. Figure 5 shows two examples of these amazing images, corresponding to the same dates as the visible-light images in Figure 4. Note how the regions of arching magnetic loops on the sun's surface in the left-hand image of Figure 5 correspond closely to the sunspot locations in the left-hand image of Figure 4, above.
/-/https/www.sciencebuddies.org/cdn/Files/2799/8/Astro_img058.gif)
/-/https/www.sciencebuddies.org/cdn/Files/2800/8/Astro_img059.gif)
Figure 5. Extreme ultraviolet Imaging Telescope (EIT) images that highlight the sun's magnetic field lines. These images correspond to the same dates as the visible-light images in Figure 4.
We've come a long way from Galileo's telescope in 1612! But as you'll see, there is still value in data from hundreds of years ago. We have annual data on sunspot numbers going back to 1700, and monthly data to 1749. (Think for a moment about how many people must have contributed to the endeavor over more than three hundred years of daily observations!) The sunspot number for an observation is equal to the number of individual sunspots observed plus ten times the number of groups of sunspots observed. The reason for doing this is that viewing conditions are not always ideal, and an average group has about ten sunspots. This way, the data is reliable even when small spots are hard to visualize. The monthly sunspot number is the average of all the daily numbers for the month.
/-/https/www.sciencebuddies.org/cdn/Files/2803/8/Astro_img087.jpg)
Graph shows the number of sunspots visible on the sun for every month from the year 1749 to 2005. The graph shows a pattern of rising and falling sunspot numbers at regular intervals.
Figure 6. Monthly sunspot number, 1749–2005. The horizontal tick marks are at 11-year intervals, the approximate length of the solar sunspot cycle.
It is obvious from the graph that sunspot activity is cyclical, with the numbers regularly rising and falling. The tick marks on the horizontal axis are at 11-year intervals, the approximate length of the solar cycle. For example, if you compare the tick marks spanning the period from 1838 to 1893 (marked by blue asterisks), you see that they fall at about the peak of each of those cycles.
The solar sunspot cycle has been observed for hundreds of years, a long time span compared to a human life, but not even an eye blink compared to the life of the sun (4.5 billion years, and slowly counting). Nevertheless, at least at this point in time, the sunspot cycle appears to be a robust phenomenon. A question that immediately jumps to mind is "What about CMEs? Do their numbers rise and fall like the sunspot cycle?"
In this project you will find out, using data collected since 1996 by the SOHO Large Angle and Spectrometric Coronagraph (LASCO). This data set is our most comprehensive study of CMEs since they were discovered in the early 1970's.
"A coronagraph is a telescope that is designed to block light coming from the solar disk, in order to see the extremely faint emission from the region around the sun, called the corona." (LASCO, date unknown). The LASCO instrument is actually three separate coronagraphs (called C1, C2, and C3). Each of the coronagraphs has a different field of view, ranging from 3 to 30 solar radii (one solar radius is about 700,000 km, or 420,000 miles).
- The C3 coronagraph images the corona from about 3.5 to 30 solar radii.
- The C2 coronagraph images the corona from about 1.5 to 6 solar radii.
- The C1 coronagraph operated for only the first two and half years after SOHO was launched. During that time, it imaged the corona from 1.1 to 3 solar radii.
In this project, you'll use data collected from the LASCO coronagraphs to see if CME activity is cyclical, and, if so, whether or not it is correlated with the solar sunspot cycle.
Terms and Concepts
To do this project, you should do research that enables you to understand the following terms and concepts:
- Coordinated universal time (UTC)
- Basic facts about the sun (size, distance from earth, temperature)
- Solar sunspot cycle
- Parts of the sun:
- Core
- Radiative zone
- Convective zone
- Chromosphere
- Photosphere
- Corona
- Coronagraph
- Coronal mass ejection
Questions
- Where in space is the Solar & Heliospheric Observatory (SOHO) satellite and how was it launched?
- What is the Large Angle and Spectrometric Coronagraph (LASCO) instrument on SOHO?
Bibliography
For more information on coronal mass ejections and sunspots, see these webpages:
- Hathaway, D.H. (2006). Solar Physics: Coronal Mass Ejections. Marshall Space Flight Center, National Aeronautics and Space Administration. Retrieved January 8, 2007.
- Wanner, N. (n.d.). Sunspots. Exploratorium, in partnership with the Center for Extreme Ultraviolet Astrophysics at the University of California, Berkeley. Retrieved March 26, 2024.
This CME catalog is generated and maintained at the CDAW Data Center by NASA and The Catholic University of America in cooperation with the Naval Research Laboratory. SOHO is a project of international cooperation between ESA and NASA.
- Yashiro, S., and N. Gopalswamy. (2006). SOHO LASCO CME Catalog. CDAW Data Center. Retrieved January 8, 2007.
Historical sunspot data is available from:
- WDC-SILSO. (n.d.). Sunspot Data. Sunspot data from the World Data Center SILSO, Royal Observatory of Belgium, Brussels. Retrieved March 26, 2024.
- Here is an Excel tutorial to get you started using a spreadsheet program:
Excel Easy. (n.d.). Welcome to Excel Easy. #1 Excel tutorial on the net. Retrieved March 26, 2024.
Materials and Equipment
To do this experiment you will need the following materials and equipment:
- Computer with Internet access
- Graph paper (or graphing software)
Experimental Procedure
- Do your background research so that you are knowledgeable about the terms, concepts, and questions, above.
- Make a graph of historical sunspot data showing at least the last four solar sunspot cycles (i.e., starting in 1964 or earlier).
- Historical data is available online from Van der Linden, R.A.M. and the SIDC team, 2006 (see Bibliography section).
- You can make your graph by hand on graph paper, or with graphing software on the computer.
- Detailed instructions on graphing this data using Excel can be found in the Science Buddies project Sunspot Cycles.
- Use the online catalog of CME data from the SOHO LASCO instruments (Yashiro, S., and N. Gopalswamy, 2006), to create a table of monthly numbers of CMEs for the time period 1996–present.
- Click on a month from the table (see screenshot, below).
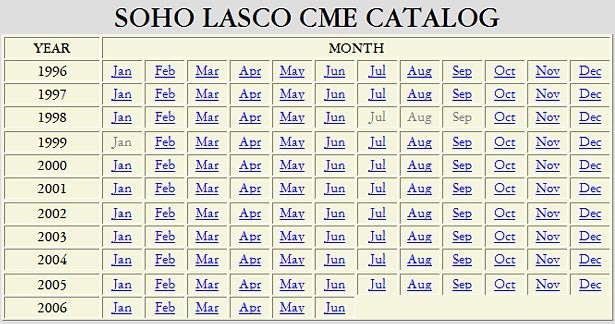
A screenshot of a monthly calendar shows every month between the years 1996 and 2006 on the website cdaw.gsfc.nasa.gov. The months link to information about coronal mass ejects that have been recorded and published online.
Figure 7. SOHO LASCO CME catalog
- Each entry in the table contains information about a single CME event.
- Count up events for each month.
- Create your own data table of monthly CME totals.
- Click on a month from the table (see screenshot, below).
- Create a new plot with both the historical sunspot data and the CME data on the same graph.
- Repeat step 2 to create another graph of historical sunspot data. However, remember that you will only have CME data starting in 1996, whereas your sunspot data goes back much further (1964 or earlier). Start the x-axis of your graph in 1996, so you only include the time range with both sunspot and CME data.
- Now, prepare to add the CME data to the same graph, using a separate y-axis scale (on the right-hand side of the graph).
- Scan the CME table to determine the range of the monthly CME data. Remember that the range corresponds to the minimum and maximum number of monthly CMEs from the entire table.
- Create a y-axis on the right-hand side of your graph that matches the CME range to the height of the monthly sunspot graph.
- Using your CME scale, plot the monthly CME numbers on the graph by hand.
- Note: you could also investigate how to make a graph with two separate y-axes using a computer program.
- Compare the two curves on your graph. Does the number of CMEs rise and fall in a manner similar to the solar sunspot cycle? If so, this demonstrates a correlation between the two phenomena. Remember, though, that correlation does not imply causation. We may have good cause to believe that sunspots and CMEs are somehow related, but the correlation does not prove that one causes the other.
/-/https/www.sciencebuddies.org/cdn/Files/2804/3/Astro_img077.jpg)
Ask an Expert
Global Goals
The United Nations Sustainable Development Goals (UNSDGs) are a blueprint to achieve a better and more sustainable future for all.
/-/https/www.sciencebuddies.org/cdn/Files/19752/5/E-WEB-Goal-09.png)
Variations
- The CME catalog contains more information than just the number of CME events that occurred. Figure out how to include one or more additional measures from the CME catalog (Yashiro, S., and N. Gopalswamy, 2006) to expand your investigation of the relationship between CMEs and sunspots. You can find a complete description of the data in the CME catalog. Expand your data table to include monthly descriptive statistics for one or more of the following measures:
- apparent velocity of the CME,
- apparent acceleration of the CME,
- apparent latitude vs. solar cycle (this one is a bit more difficult, because you have to convert from position angle to latitude).
- (Advanced) You can expand the study to include previous data on CMEs from other sources:
- Mauna Loa Solar Observatory (MLSO) data
- Solar Maximum Mission (SMM) CME catalog, 1980-1989. This catalog contains a lot of information on each event, and would take some time to summarize.
- Note that each of these studies used different data collection methods. Each data set will need its own independent y-axis on the graph (corresponding to the range of the individual data set), as you did for the SOHO LASCO data.
- For related Science Buddies projects, see:
Careers
If you like this project, you might enjoy exploring these related careers:
/-/https/careerdiscovery.sciencebuddies.org/cdn/Files/902/18/iStock-1174945987.jpg)
/-/https/careerdiscovery.sciencebuddies.org/cdn/Files/1815/24/stat.jpg)
/-/https/careerdiscovery.sciencebuddies.org/cdn/Files/1640/26/Fyysikot_tyossaan.jpg)

/-/https/img.youtube.com/vi/3gj_68ywod4/0.jpg)
/-/https/img.youtube.com/vi/hlCc1Yoiv5c/0.jpg)
/-/https/img.youtube.com/vi/3eu5eAOOGOc/0.jpg)