/-/https/www.sciencebuddies.org/Files/21464/5/sb-logo.png)
/-/https/www.sciencebuddies.org/Files/21464/5/sb-logo.png)
Modeling Blood Flow
Summary
/-/https/www.sciencebuddies.org/Files/8895/7/both-cups-full.jpg)
Overview
Why is it important to eat healthy and exercise? In this hands-on lesson plan, students will build a simple model to explore the effects of plaque buildup in arteries. The model allows them to demonstrate what happens to blood flow when heart disease narrows a person's arteries.Learning Objectives
- Explain why our circulatory system (including the arteries and blood) is essential for our survival
- Describe the cause and effect of obstructed blood flow through plaque buildup in the arteries
- Assess flow rates of liquids using a blood flow model
NGSS Alignment
This lesson helps students prepare for these Next Generation Science Standards Performance Expectations:- 4-LS1-1. Construct an argument that plants and animals have internal and external structures that function to support survival, growth, behavior, and reproduction.
|
Science & Engineering Practices
Asking Questions and Defining Problems.
Ask questions about what would happen if a variable was changed.
Developing and Using Models. Develop and/or use models to describe and/or predict phenomena. Use a model to test cause and effect relationships or interactions concerning the functioning of a natural or designed system. Planning and Carrying Out Investigations. Make predictions about what would happen if a variable changed. Engaging in Argument from Evidence. Use data to evaluate claims about cause and effect. |
Disciplinary Core Ideas
LS1.A: Structure and Function.
Plants and animals have both internal and external structures that serve various functions in growth, survival, behavior, and reproduction.
|
Crosscutting Concepts
Cause and Effect.
Cause and effect relationships are routinely identified, tested, and used to explain change.
System and System Models. A system can be described in terms of its components and their interactions. |
Materials
/-/https/www.sciencebuddies.org/Files/8896/7/blood-flow-materials.jpg)
Materials for teacher preparation:
- Scissors (1)
- Water (enough to fill 2 cups per group)
- Measuring cup
- Pitcher or container for storing the water, or access to a sink
- Masking tape or permanent marker
- Optional: red food coloring
Materials per group of 2–4 students:
- Plastic cups, 16 oz. (3)
- Two straws with different diameters (a 2-inch piece of each)
- Modeling clay
- Stopwatch
- Aluminum tray (big enough to fit 500 mL of water)
Background Information for Teachers
This section contains a quick review for teachers of the science and concepts covered in this lesson.To be healthy, every part of the human body needs to be supplied with oxygen and nutrients. The job of blood is to transport oxygen and nutrients by traveling through the body's circulatory system, also called the cardiovascular system (heart, veins, and arteries) and delivering them to the other parts of the body as shown in Figure 1. The heart acts as a powerful pump that generates the force necessary to move the blood around the circulatory system. When something goes wrong with the body's circulatory system, it can lead to serious health consequences, including death.
/-/https/www.sciencebuddies.org/Files/8897/7/circulatory-system.png)
Figure 1. The circulatory system of the human body.
The most common problem with the circulatory system is coronary heart disease, also called coronary artery disease. Coronary heart disease is caused by the buildup of cholesterol and other material, called plaque, in the arteries: the blood vessels that carry oxygenated blood from the heart to the organs. This buildup is known as atherosclerosis. Over time, as the plaque grows thicker, the arteries become narrower, as shown in Figure 2. As the arteries narrow, they cannot carry as much blood to the organs. The decrease in oxygenated blood can lead to chest pains and heart attacks. The plaque sometimes becomes dislodged and forms blood clots that block the blood flow, which can also cause heart attacks and strokes.
/-/https/www.sciencebuddies.org/Files/8898/7/atherosclerosis_diagram.png)
Figure 2. Coronary heart disease can be caused by the buildup of plaque inside the arteries, which narrows their diameter and affects blood flow through our body.
In this lesson plan, students model what happens to blood flow when coronary heart disease narrows a person's arteries by comparing the flow of water (blood) through straws (arteries) of different diameters. The activity is also a great starting point for a variety of health discussions in the classroom.
Additional Background Links
- Heart and Circulatory System, TeensHealth
- What Is Coronary Heart Disease?, National Heart, Lung, and Blood Institute
- How To Prevent and Control Coronary Heart Disease Risk Factors, National Heart, Lung, and Blood Institute
- Cardiovascular System In Under 10 Minutes, CTE Skills.com at YouTube
Prep Work (15 minutes)
- Add 400 mL of water and mark the water level on the outside of one of the 16 oz. plastic cups using a permanent marker or masking tape. Then, make a mark on another 16 oz. cup at the same height. This marker will tell students the water level for the experiments. Each student group should have two cups with the water level marked and one unmarked cup.
- Prepare both marked 16 oz. cups for each group by poking or cutting a hole in their sides, about one inch from the bottom. The holes should be approximately the same distance from the bottom of each cup as shown in Figure 3. Widen the hole enough to comfortably fit each straw. The wider straw will need a bigger hole.
/-/https/www.sciencebuddies.org/Files/8899/7/blood-flow-straws-in-cups-background.jpg)
Figure 3. Holes cut at the bottom of the cups and straws inserted.
- Cut the straws to approximately 2-inch lengths; one piece of each diameter is needed for each group.
- If you do not have a sink available in the classroom, prepare enough water to fill two cups to the line for each group.
- Optional: add red food coloring to the water. This will make the water look more like blood and it will make it easier for students to observe what is happening.
Teacher Tool Box
Engage (15 minutes)
- Discuss the function of the circulatory system (heart, blood, and blood vessels) with your students.
 Which parts of our bodies do you think are most important for staying alive? Why?
 Your students might name things like the brain, heart, stomach, or lungs (for example, "our lungs, because without them we cannot breathe"). Explain to your students that our bodies have many different parts, also called organs, like the ones they mentioned (you can also mention others like the kidneys, skin, etc.). Each organ has a different, but important, job to do. No one organ can keep you alive by itself; they all have to work together to make our body function properly. The brain and heart are often considered two of the most important organs, because without them, our body cannot survive for long.Why is the heart so important—can you explain what it does?All organs need blood to survive. The heart is a big muscle that pumps blood through our body so it can get transported to our legs, arms, head, and organs.Does anybody know why we need blood flowing through our body?Your students most likely know that blood is important for our body, but probably cannot explain in detail why. If they struggle with the answer, tell them that blood provides the organs inside our bodies with oxygen and nutrients that we need to live, repair, and grow. In addition, it helps control our body temperature and carries away waste products from our cells, that we cannot use in our body.How does blood flow inside our body?Blood flows through the heart and our whole body inside pipe-like structures called blood vessels. There are specific types of blood vessels called arteries and veins. You can point out to your students that they can see these blood vessels shining through their skin as blue or red lines on their hands and arms.What do you think happens when, for some reason, blood flow through our body does not work very well anymore?When something goes wrong with the body's blood flow, you get sick, which can lead to serious health problems or even death.
 - Explain to your students that there is a whole range of diseases that affect the heart or blood vessels. One of the diseases is caused by the buildup of fats and other material, called plaque, in the blood vessels called arteries. As the arteries narrow over time due to plaque buildup, they cannot carry as much blood away from the heart. This can lead to heart attacks or strokes, in which the heart or brain does not get enough blood anymore.
- Tell your students that they will build a model that demonstrates how blood flow changes when arteries get clogged by the buildup of plaque, and introduce the experiment.
Optionally, you can also show your students this introductory video.
Create AssignmentEmbed Link Google Classroom
 Microsoft Teams
 Canvas
 Schoology
 OtherCan you think of a way to model the blood flow through an artery? What could we use as blood? What could mimic the artery? How could we simulate narrower arteries due to plaque buildup?Let your students come up with their own ideas. If they have trouble, remind them what the artery looks like (a tube or pipe) and what blood is (a liquid). What common materials could they use to make liquid flow through a tube? Explain that for this activity, you have chosen to model the arteries with straws and the blood with water. To represent clogged arteries, you will use straws with a smaller diameter.How can you measure how fast the water flows through each of the straws?You can measure the time it takes for a certain amount of liquid to flow through each of the straws.Through which artery (straw) do you think blood (water) can flow faster? The one with the smaller or larger diameter?Students can answer the question both ways. Do not reveal the answer to that question yet, but tell your students that they will use their model to investigate how blood flow is related to the diameter of the artery.
/-/https/www.sciencebuddies.org/Files/14174/23/note-question-mark-30.png)
/-/https/www.sciencebuddies.org/Files/14175/24/conversation-bubbles-30.png)
/-/https/i.ytimg.com/vi/yYDSqsJqyxE/maxresdefault.jpg)
/-/https/www.sciencebuddies.org/Files/20511/4/google-classroom.png)
/-/https/www.sciencebuddies.org/Files/20512/4/ms-teams.png)
/-/https/www.sciencebuddies.org/Files/20469/4/Canvas_Bug_Color_RGB.png)
/-/https/www.sciencebuddies.org/Files/20470/5/Schoology-Logo.png)
/-/https/www.sciencebuddies.org/Files/20471/4/lms.png)
/-/https/www.sciencebuddies.org/Files/20469/4/Canvas_Bug_Color_RGB.png)
/-/https/www.sciencebuddies.org/Files/20470/5/Schoology-Logo.png)
/-/https/www.sciencebuddies.org/Files/20471/4/lms.png)
Explore (20 minutes)
- Based on previous discussions, let each student formulate his/her prediction on their worksheet on which straw diameter will result in faster water flow.
- Divide the class into groups of 2–4 students and tell them that they will measure the blood flow with two different straw diameters. Within each group, students should divide tasks.
- Walk the students through the experimental procedure described below. (A slide show is available that you can use to guide your students through the experiments.)
- Trial 1: Test blood flow with the smaller straw diameter.
- Take the cup with the smaller hole and put the straw with the smaller diameter into it. Make sure the hole is not squeezing the straw and narrowing it. The straw should point down so the water can flow out as shown in Figure 4.
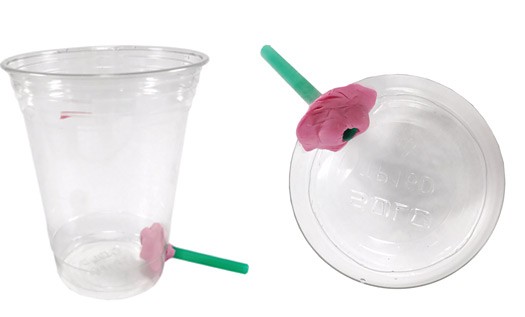
Figure 4. Straw inserted into hole in cup and sealed with modeling clay.
- Use modeling clay to seal the inside and outside of the hole around the straw so that water can flow through the straw but cannot leak at the seal.
- Place the cup into the aluminum tray and seal the end of straw with a piece of modeling clay as shown in Figure 5.
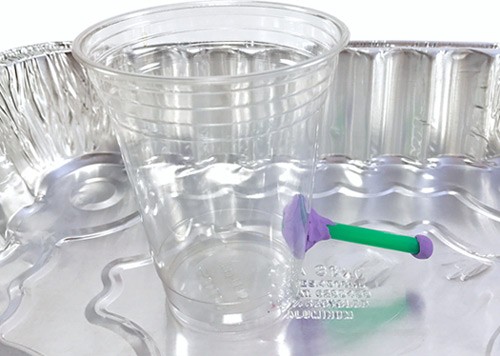
Figure 5. Prepared cup in aluminum tray.
- Start filling the cup with water up to the mark. First test if the cup leaks where the straw was inserted and improve the seal if needed. Then, fill the cup to the marker while the straw is still sealed with clay.
- Remove the clay seal from the end of the straw and start the stopwatch immediately.
- Stop the stopwatch when the water stops flowing through the straw and record the time.
- Remove the cup from the tray and empty the tray by pouring the water into an extra plastic cup.
- Take the cup with the smaller hole and put the straw with the smaller diameter into it. Make sure the hole is not squeezing the straw and narrowing it. The straw should point down so the water can flow out as shown in Figure 4.
- Trial 2: Test blood flow with the larger straw diameter.
- Repeat steps 4.a.–4.g., but this time, use the cup with a larger hole and the larger diameter straw. Use the same aluminum tray to collect the water.
/-/https/www.sciencebuddies.org/Files/8900/7/blood-flow-seal.jpg)
/-/https/www.sciencebuddies.org/Files/8901/8/empty-cup-in-tray.jpg)
Reflect (15 minutes)
- Use the student worksheet for students to analyze their data. Note: If you are working on or have already taught long division to your students, you can let the students convert the time they measured into a flow rate (the volume of liquid flowing per unit time). If not, skip the rest of this step (corresponding to step 3.a. in the student worksheet) and proceed with step 2 (or 3.b. in the student worksheet).
How can we calculate the flow rate of the water through the straw from the time you measured?Equation 1:The volume of water that passes through the straw in a certain amount of time is also called the flow rate, measured in milliliters of water (a volume) per second or per minute (a time period). To calculate the flow rate from the measured time, you have to divide the volume of water that passed through the straw by the time you measured as shown in Equation 1. The cup initially held 400 mL of water.
- Ask the students to create a bar graph of their measured times (or calculated flow rates) for both straw diameters. Template graphs are provided on the worksheet.
- Start a discussion where students reflect on their data and draw conclusions.
How many of you observed a faster blood flow with the larger diameter straw?All students should raise their hands. If there is a group that has opposite results, do some joint troubleshooting to find out what led to their results. Everyone should have seen the same results (faster blood flow with larger diameter straw) in their experiments.What does your result mean for the blood flow inside your body? How does plaque buildup affect the blood flow in your arteries?The plaque buildup leads to a narrowing of the artery, which means that its diameter decreases. As a result, within the same time, less blood flows from the heart into your organs.Can you think of a worst-case scenario for plaque buildup inside your artery? How would that affect your health?In the worst case, the plaque buildup would be so bad that it clogs up the artery completely, which would stop blood flow. This means that some organs will not get oxygen and nutrients anymore. If the heart or the brain do not get enough blood, a heart attack or a stroke are the consequences. If your legs or arms are not provided with blood, they will first "fall asleep" easily, then change their color to purple or blue, and if untreated their tissue will eventually die off.How do you think you can prevent plaque formation in your arteries?You can decrease your risk of heart disease by living a healthy lifestyle, including exercising and eating healthy foods. That means going outside to play instead of playing lots of video games, and eating lots of fruits and vegetables instead of fast food and junk food.
Assess
You can use this quiz to assess student learning after the activity:
- Online quiz, assignable in any LMS
- Quiz (pdf) and answer key (PDF)
Make Career Connections
Discussing or reading about these careers can help students make important connections between the in-class lesson and STEM job opportunities in the real world.
/-/https/careerdiscovery.sciencebuddies.org/Files/1628/18/iStock-1203995945.jpg)

/-/https/careerdiscovery.sciencebuddies.org/Files/1365/18/iStock-1012791028.jpg)
/-/https/careerdiscovery.sciencebuddies.org/Files/1203/17/iStock-1210522370.jpg)
Lesson Plan Variations
- Instead of using two different-sized straws, let your students use two identical straws and modeling clay to actually model the plaque buildup inside one of the straws. This way, they can modify the amount of plaque (modeling clay) inside the artery (straw) and can also simulate what happens if the plaque breaks away from the artery wall.
- In addition to this lesson plan, let your students research the risk factors for coronary heart disease in more detail. Which lifestyle changes (diet, smoking, drinking, exercising) can reduce your risks? Are there any foods that are good or bad for preventing plaque buildup in your arteries? Why do certain foods promote plaque formation whereas others do not?
- Let your students explore their heart rates, pulses, and the function of the heart in more detail in the Measuring Heart Rate with Your Own Stethoscope lesson plan.
/-/https/img.youtube.com/vi/0hThMoHB88w/0.jpg)
/-/https/img.youtube.com/vi/W1DVEtzrl9g/0.jpg)
/-/https/img.youtube.com/vi/MIMBqH2o8vw/0.jpg)