Lego Tower Data Analysis
Posted: Sun Dec 04, 2016 1:32 am
Hi!
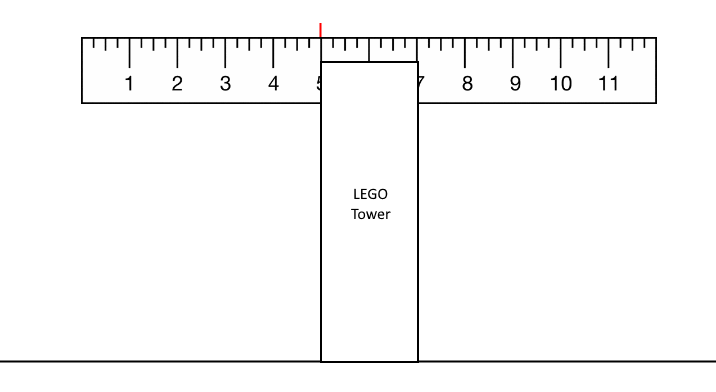
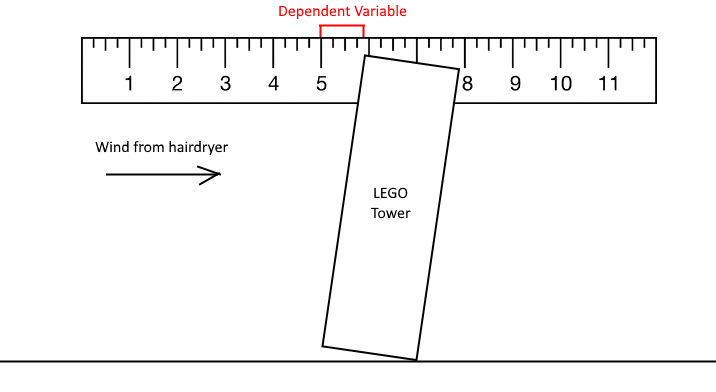
My son is in first grade and he is doing the Lego tower experiment. He has modified it and is making a single base footprint tower with different heights and testing it against the winds( hairdryer). His conclusion is that by making a strong base and adding wind channels to a building, the buildings stands strong against the winds and does not fall. We are stuck at the graph! How do we plot a graph based on this information ? Please help us as this project is due on Monday and we only have one day to complete it
Thank you