The Measure of Mercury: Analyzing Impact Craters on the Innermost Planet
Abstract
Have you ever wanted to analyze data from a NASA spacecraft? In this science project you will use data from NASA's MESSENGER mission to measure the diameter and calculate the depth of impact craters on Mercury. You will then analyze that data for relationships between a crater's depth and diameter. This is your chance to perform a science project as a NASA researcher would!Summary
Terik Daly, Science Buddies
- PowerPoint® is a registered trademark of Microsoft Corporation.
- Microsoft® is a registered trademark of Microsoft Corporation.
- OpenOffice.org® is a registered trademark of the Apache Software Foundation.
- Adobe® is a registered trademark of the Adobe Systems Incorporated.
- Illustrator® is a registered trademark of the Adobe Systems Incorporated.

Objective
In this science project, you will use data from MESSENGER, NASA's newest mission to Mercury, to measure the diameter and calculate the depth of impact craters on Mercury's surface. You will then analyze that data to determine relationships between the depth and diameter of Mercury's impact craters.
Introduction
Did you know that a NASA spacecraft called MESSENGER, started orbiting Mercury in March 2011? MESSENGER, which is short for MErcury Surface, Space ENvironment, GEochemistry and Ranging, is the first spacecraft to orbit the innermost planet of our Solar System. MESSENGER carries a variety of instruments, including the Mercury Dual Imaging System (or MDIS), which has two cameras, the Narrow Angle Camera (or NAC) and Wide Angle Camera (or WAC). Together, these cameras have taken over 100,000 pictures of Mercury's surface. NASA researchers and other planetary scientists (scientists who study solar systems) are analyzing these images to better understand Mercury's many mysteries. MESSENGER pictures are available to the public, which means you can use these pictures to conduct a science project.
To understand Mercury's mysterious history, which spans more than 4.5 billion years, planetary scientists study a variety of phenomena, ranging from Mercury's magnetic field to its landforms, such as impact craters. These craters are circular depressions in a planet's surface, surrounded by a raised rim, formed when an asteroid, comet, or meteorite crashes into (or "impacts") a planet. Each of the circular "holes" in Figure 1 is an impact crater on Earth's Moon.
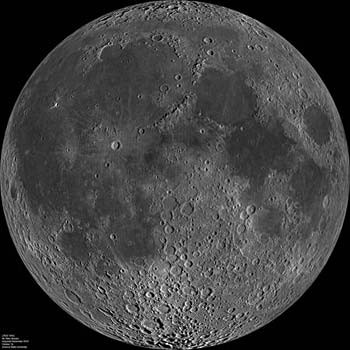 Image Credit: NASA / Public domain
Figure 1. Each of the circular depressions in this picture of Earth's Moon is an impact crater that formed when an asteroid, comet, or meteorite, traveling at many kilometers per second, crashed into the Moon. (Image taken by the Wide Angle Camera; NASA Lunar Reconnaissance Orbiter, 2011.)
Impact cratering (the process that forms impact craters) is an almost universal Solar System process. Although plate tectonics, weathering, and erosion have erased many of Earth's impact craters, impact craters pepper the surfaces of nearly all other solid Solar System objects. Mercury is no exception, and the impact craters on Mercury's surface are clues to the planet's history.
As you may have noticed by looking at Figure 1, impact craters come in a variety of sizes. As the size of an impact crater changes, so does its appearance or morphology. Based on these different morphologies, impact craters are classified as simple impact craters, complex impact craters, or impact basins.
Simple craters (Figure 2) are the smallest craters, and they look like bowl-shaped depressions. Complex craters (Figure 3) are larger than simple craters, with peaks in their middles and terraces on their edges. Impact basins (Figure 4) are the largest craters, characterized by circular bands of mountains in their interiors.
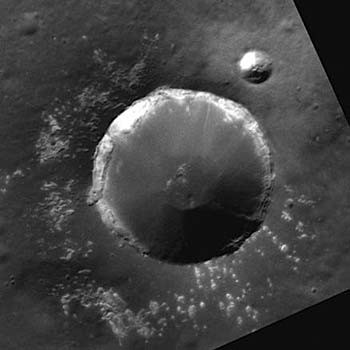 Image Credit: NASA / Public domain
Figure 2. Two simple impact craters on Mercury. Note the bowl-like shape. The larger crater is approximately 9 kilometers (km) across. (Image taken by the Narrow Angle Camera on NASA's MESSENGER mission, 2011.)
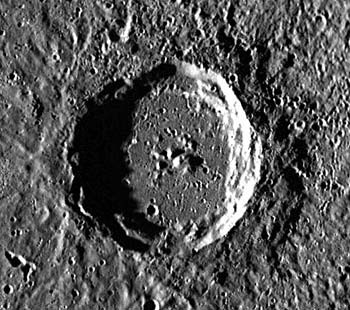 Image Credit: NASA / Public domain
Figure 3. Munch Crater, a complex impact crater on Mercury with a diameter of about 58 km. Complex craters, like this one, are larger than simple craters, like those in Figure 2. The cluster of mountains in the center of the crater and the stair-like terraces around the crater's rim are typical of complex craters. (Image taken by the Narrow Angle Camera on NASA's MESSENGER mission, 2012.)
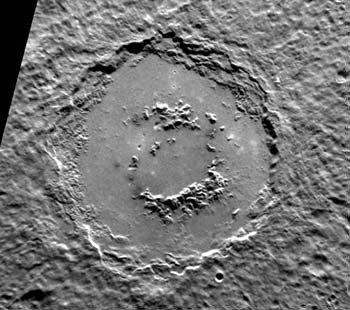 Image Credit: NASA / Public domain
Figure 4. An impact basin on Mercury. This basin (about 155 km across) is larger than the complex crater in Figure 3 and much larger than the simple crater in Figure 2. Impact basins are larger than both simple and complex impact craters. In addition to its large size, the ring of mountains in the basin's interior identifies this structure as an impact basin. Some impact basins have multiple mountain rings in their interiors. (Detail from an image taken by the Narrow Angle Camera on NASA's MESSENGER mission, 2011.)
In this science fair project, you will select a picture taken by MESSENGER, measure crater diameters, and use shadows to calculate the crater depths of simple impact craters on Mercury. You will analyze the data you collect to look for relationships between the depth and diameter of simple impact craters.
Terms and Concepts
- Mercury
- MErcury Surface, Space ENvironment, GEochemistry and Ranging (MESSENGER) mission
- Simple impact crater
- Complex impact crater
- Impact basin
- Crater diameter
- Crater depth
- Pixel
- Incidence angle
- Emission angle
Questions
- How does the Mercury Dual Imaging System work?
- How do impact craters form?
- What kinds of processes can modify impact craters after they form?
- How does the positioning of the sun, spacecraft, and Mercury (sometimes called "illumination geometry") affect the images collected by MESSENGER?
- What is image resolution and how do pixels relate to it?
- What kinds of questions can planetary scientists answer by studying the depth-to-diameter ratio of an impact crater?
Bibliography
- MESSENGER Team. (2012, July 7). Science highlights from Mercury orbit: Taking the measure of impact craters on Mercury. Retrieved May 8, 2012.
- MESSENGER Team. (n.d.). MESSENGER for students. Retrieved May 8, 2012.
- Ransom, M. (n.d.) Sine, cosine, and tangent. Retrieved May 22, 2012.
- The Lunar and Planetary Institute. (n.d.). Shaping the planets: Impact cratering. Retrieved May 8, 2012.
Materials and Equipment
- Computer with an Internet connection
- Printer and ruler or computer software for viewing and measuring crater photos. Software options include: Microsoft® PowerPoint®, OpenOffice.org® Impress®, or Adobe® Illustrator®. See Experimental Procedure for details.
- Lab notebook
- Pen or pencil
- Calculator
Experimental Procedure
Pick a MESSENGER Image to Analyze
- Go to Photojournal, a database of selected images from NASA missions.
- Click on "Mercury." This takes you to a catalog of the Mercury images available in Photojournal.
- To browse MESSENGER images, set the "Spacecraft" to "MESSENGER" (using the drop-down menu) and click the "Select" button to the right of the drop-down menu (see Figure 5). Now the database will only show images obtained by MESSENGER.
- If you know the identification number of the image you want to find (identification numbers for some images are given later), type that number in the "Go directly to image (PIxxxxxx):" box and press enter (see Figure 5). This will take you directly to the information page for that image. The image information page is discussed in step 2c.
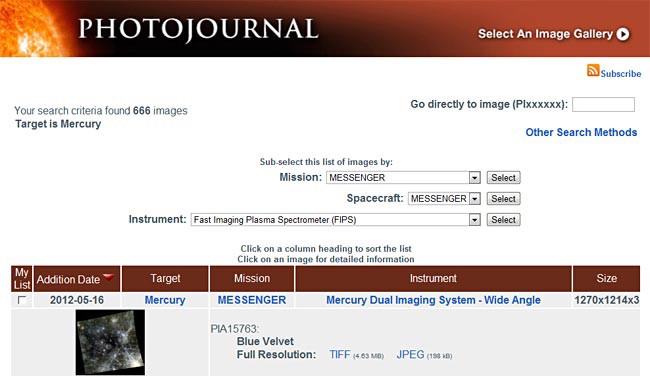 Image Credit: NASA / Public domain
The website photojournal.jpl.nasa.gov contains a searchable database of images taken during missions into space. Images can be found by entering their unique ID number or by searching for specific missions, spacecrafts and instruments used. The results page shows a thumbnail of any image that matches the search terms and provide brief information such as the date added, target, mission, instrument and image size.
Figure 5. Selecting "MESSENGER" as the spacecraft and then clicking the "Select" button will show all available images of Mercury taken by MESSENGER. Or, if you know the identification number of the image you want, type that number in the "Go directly to image (PIxxxxxx):" box and press enter. (Screen shot of Photojournal, 2012).
- Learn how to navigate the Photojournal database.
- Scrolling to the bottom of the page and clicking "Next Set" will advance you to the next set of images.
- The image gallery catalog is organized into a table that shows thumbnails for each image, along with the following information:
- Addition Date - the date the image was added to Photojournal
- Target - the Solar System body in the image
- Mission - the name of the spacecraft that collected the image
- Instrument - the name of the instrument that took the picture
- Size - the dimensions of the image (in pixels)
Each image has an identification number (e.g., PIA15644), a title (e.g., "$120 Million Buys an Awful Lot of Crater"), and links to download full-resolution versions of the image in TIFF and JPEG file formats. These details are all located to the right of the image thumbnail (see Figure 6).
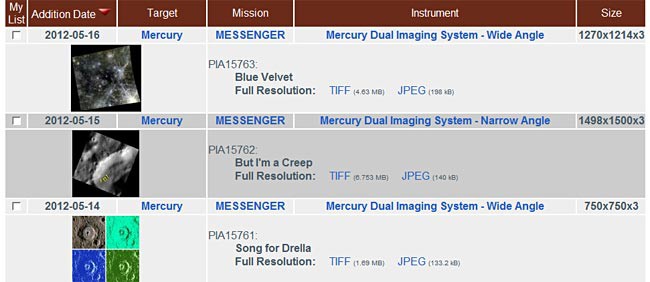 Image Credit: NASA / Public domain
The website photojournal.jpl.nasa.gov displays image results in a table that includes a thumbnail of the image, date added, target, mission, a unique identification number, title, links to download the image in a TIFF or JPEG format, and the size of the image.
Figure 6. The Photojournal image catalog is organized into a table with rows for each image and columns for image addition date, target, mission, instrument, and size. (Screen shot of Photojournal, 2012). - Clicking on an image thumbnail takes you to a separate webpage with additional image information. This information is concentrated in two areas: a table to the right of another image thumbnail and a list partway down the page (see Figure 7). For this science project, you need the following information for each image you use:
- Product size (e.g., 1141 x 1143 pixels)
- Resolution (e.g., 147 meters [m] per pixel)
- Incidence angle (e.g., 67.0°)
- Emission angle (e.g., 0.5°)
If the incidence and emission angles are not listed for a particular image, you will not be able to use that image for this science project.
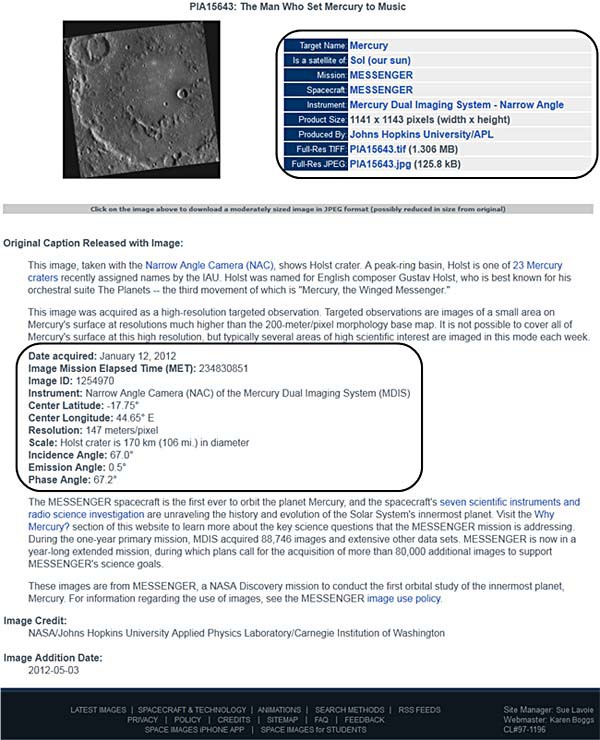 Image Credit: NASA / Public domain
Information page for an image in Photojournal. The page includes the image in the top left, and image details in the top right. Beneath the image is a copy of the caption that was released with the image. Under the caption is more detailed information about the image (such as the angle it was taken from) which will be important for students who may need to use the image for an experiment.
Figure 7. The information page for an image in Photojournal. Key information is located in a table to the right of the thumbnail and in a list partway down the page. In this figure, both areas are highlighted by red boxes. (Screen shot of Photojournal, 2012).
- Select an image to analyze. It is important to consider several factors when choosing an image. Carefully choosing an image is like carefully designing a laboratory experiment. In this science project, you want to control for illumination geometry and geologic setting, which are described.
- Illumination geometry. MESSENGER takes images of Mercury while orbiting the planet, and the planet rotates about its axis as it orbits the sun. As a result, the lighting conditions and image perspective are constantly changing. This is important because the same object can look very different depending on these two factors. So, you want to select images based, in part, on the spacecraft's perspective and lighting conditions (collectively called illumination geometry).
- For this science project, you want the emission angle to be close to zero. A small emission angle means the spacecraft is almost directly over the area being imaged, which minimizes image distortion. For emission angles <~10° you can neglect the distortion due to the oblique view. For larger emission angles you would have to correct mathematically for the oblique perspective. Do not chose images with emission angles >10°.
- In addition to a small emission angle, you want a large (> 60°) incidence angle because this makes the shadows from crater rims longer and easier to measure (see Figure 8).
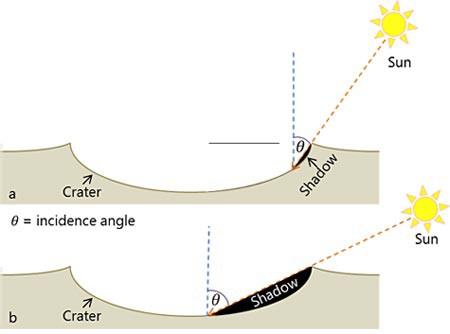 Image Credit: Terik Daly, Science Buddies / Science Buddies
Sunlight passing over a crater will usually cast a shadow on the lip of the crater that stretches towards the center. The angle between a vertical line at the edge of a shadow and the lip of the crater where the shadow begins is the incidence angle. When the sun is high in the sky shadows in craters are smaller and incidence angles are smaller. When the sun is low on the horizon, shadows in craters become longer and the incidence angle increases.
Figure 8. (a) A low incidence angle creates short, hard-to-measure shadows. (b) A high incidence angle means the sun is close to the horizon, making shadows longer and easier to measure. - Geologic setting. Different parts of Mercury have different rocks exposed at the surface; different geologic processes were and continue to be important in different areas on Mercury. In order to control for these variations, you want to measure impact craters in a single image. Pick an image with lots of simple impact craters.
Based on these factors, the following images will work well for this science project: PIA15365: Living in Anonymity; PIA15065: Islands in the Stream; and PIA14498: Some Will Slump. These are not the only images that would work for this project, but if you choose another image, make sure the illumination geometry and density of simple craters meet the needs of this science project.
- Illumination geometry. MESSENGER takes images of Mercury while orbiting the planet, and the planet rotates about its axis as it orbits the sun. As a result, the lighting conditions and image perspective are constantly changing. This is important because the same object can look very different depending on these two factors. So, you want to select images based, in part, on the spacecraft's perspective and lighting conditions (collectively called illumination geometry).
- Download the image you want to analyze.
- Download a full-resolution copy of the image by clicking on either the "Full-Res TIFF" or "Full-Res JPEG" links in the table to the right of the thumbnail on the image information webpage (see Figure 7). Either file format works for this project. Clicking the image thumbnail only brings up a moderate-resolution image, but you want the full-resolution image for this science project.
- Decide if you want to measure your craters on the computer or on a printed copy of the image.
- Printing out the image makes the measurement process easier, but it limits how large you can make the image.
- Most MESSENGER images are larger than a standard 8½ x 11-inch sheet of paper. Some printers can print one image over multiple sheets which you can tile together to create one large image. Consult your printer's user manual to see if this is possible with your printer. Alternatively, you can resize the image to fit on an 8½ x 11-inch piece of paper (or whatever paper you have available). Many printers have a "fit to page" option that automatically resizes an image to fit on the printer's paper. Again, consult your printer's user manual to see if this is possible. Be aware, however, that reducing the image size will reduce the sizes of the craters and shadows you will measure, making your measurements and analysis less precise.
- Making measurements on a computer, using a program like Microsoft® PowerPoint®, OpenOffice.org® Impress®, or Adobe® Illustrator®, makes changing the size of and enlarging the image easier, but it also makes measuring lengths more complicated.
- Printing out the image makes the measurement process easier, but it limits how large you can make the image.
- Either print the image you selected, after sizing it as desired, or import the image into a program like Microsoft® PowerPoint®, OpenOffice.org® Impress®, or Adobe® Illustrator®. If you need help resizing the image, consult the "help" documentation for the computer program you are using.
Select Which Craters You Will Analyze
- Just as you carefully selected an image that will work well for this science project, you also need to choose carefully which craters you analyze so that you control for crater type and crater degradation in addition to illumination geometry and geologic setting. Use the information in Technical Note #1 to help you select the craters you will measure.
- Crater type. For this science project, you will only measure simple impact craters, not complex impact craters or impact basins. Here are some ways to spot a simple impact crater:
- Simple impact craters are the smallest craters.
- They are circular, bowl-shaped depressions.
- They lack mountains in their centers or rings of mountains within the crater.
- They lack step-like terraces around their rims.
- Crater degradation. Many impact craters on Mercury are billions of years old, and volcanic eruptions, movements in Mercury's crust, or later impact craters can modify, or degrade, a crater. To control for modification after the impact crater formed, select relatively unmodified craters for your analysis. Choose impact craters that look sharp and clearly defined, instead of fuzzy or flattened. Avoid craters that appear to have had landslides along their walls or look as if they have been filled in by something.
Technical Note #1
Figures 9 and 10 show a few examples of craters circled by yellow rings, each labeled with a letter. The following sections explain why (or why not) each of these impact craters might be a good candidate for this science project. Study these examples to learn how to spot impact craters in your chosen image that are suited to answering the questions of this science project.
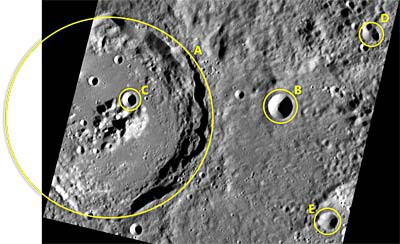
Figure 9. Detail from a Narrow Angle Camera image taken by MESSENGER, with selected craters highlighted by yellow rings. See the text for discussions of why these craters might or might not be good candidates for analysis. (Base image taken by the Narrow Angle Camera on NASA's MESSENGER mission, 2011.)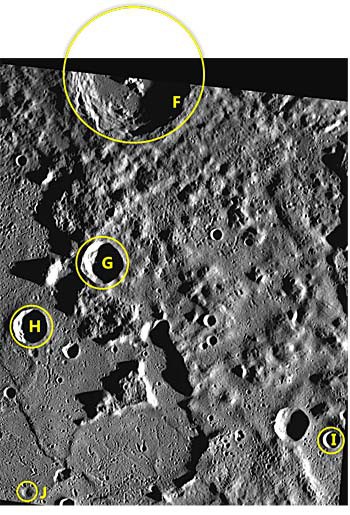 Image Credit: Terik Daly, Science Buddies / Science Buddies
Figure 10. Detail from a Narrow Angle Camera image taken by MESSENGER, with selected craters highlighted by yellow rings. See the text for discussions of why these craters might or might not be good candidates for analysis. (Base image taken by the Narrow Angle Camera on NASA's MESSENGER mission, 2011.)- A (largest yellow ring in Figure 9) would not be analyzed because it is a complex crater, not a simple crater. Notice the mountains in the middle of the crater, as well as the stair-like terraces around the crater's edges. Both the mountains and the terraces tell you that this impact crater is a complex crater, not a simple impact crater.
- B (near the center of Figure 9) and C (inside crater A in Figure 9) could be analyzed for this science project. Both are simple craters and both are "fresh." They are simple craters because they are shaped like a bowl and lack the mountains and terraces of complex craters (compare with crater A). They are fresh because the rims of the impact craters are clearly defined and the interior of the craters do not show signs of being filled in by landslides or a volcanic eruption.
- D (upper right corner of Figure 9). Neither of the craters in this ring would be analyzed because although they are both simple craters they are not fresh: one crater obliterated part of the other crater rim.
- E (lower right corner of Figure 9). This crater would not be analyzed because although it is a simple crater, it has been modified so that it is no longer circular and appears partly filled in. If you look closely at the sunlit walls of the crater, you can see dark and light streaks running down the walls of the crater, suggesting places where the edges collapsed and the rubble rolled into the crater.
- F (top center of Figure 10) would not be analyzed because it is a complex crater, like Crater A in Figure 9. Notice the mountains in the middle of the crater, as well as the terraces around the crater's edges. Both the mountains and the terraces tell you that this impact crater is a complex crater, not a simple crater.
- G (center of Figure 10) and H (center left of Figure 10) would not be analyzed because they have been partly filled in by landslides, as evidenced by the piles of rubble on the sunlit side of the craters.
- I (lower right corner of Figure 10). This crater could be analyzed because it is a fresh, simple impact crater. Note the crisp crater edges and bowl shape.
- J (lower left corner of Figure 10). This crater would not be analyzed because, although it is a simple crater, it has been modified, as indicated by the blurry edges and shallow depth. It is not crisp and sharp like a fresh crater.
- Using the criteria for impact crater type and impact crater degradation, along with the examples, select five to ten fresh, simple impact craters to analyze for your science project.
- Identify each of the impact craters you will measure and label them individually so that you can keep track of your data for each crater.
- Crater type. For this science project, you will only measure simple impact craters, not complex impact craters or impact basins. Here are some ways to spot a simple impact crater:
Measure Crater Diameter and Shadow Length (Using a Computer)
- Now that you have selected an image and identified the impact craters you will measure, you are ready to make your measurements.
- Consult Technical Note #2 to understand the geometry behind the measurements and calculations.
- If you will be using a computer to make your measurements, continue on to step 2.
- If you will be using a printer and ruler to make your measurements, skip to the next section.
Technical Note #2
This section explains the geometry you will use to measure crater diameter, D, and calculate crater depth, d.
Crater diameter, D, is the distance from one side of the crater to the other. If you think of tracing a circle around the crater's rim, the diameter of the impact crater is the same as the diameter of that circle. Since simple impact craters are nearly always circular and you are using images with small emission angles, it does not matter which way you measure the diameter (e.g., top to bottom versus left to right). See Figure 11.
Shadow length, L, is the length from one end of the crater's shadow to the other (as measured toward the center of the crater in the direction of illumination). See Figure 11.
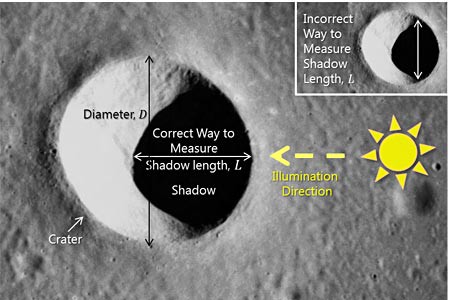 Image Credit: Terik Daly, Science Buddies (from on a Mercury NAC image base) / Science Buddies
Figure 11. You will measure two parameters: the diameter of the impact crater, D, and the length, L, of the shadow cast by the crater's rim. The crater diameter, D, is the distance from one side of the crater to the other, passing through the center of the crater. Shadow length, L, is the length of the shadow from the rim of the crater to the shadow's furthermost point within the crater's bowl. (Base image from MESSENGER's Narrow Angle Camera, 2012).
After you have measured crater diameter and shadow length, you can use the incidence angle, θ, of the image and the tangent function to calculate the crater depth (see Figure 12).
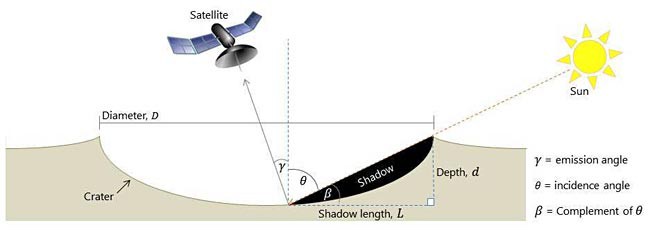 Image Credit: Terik Daly, Science Buddies / Science Buddies
The emission angle is the angle between a vertical line at the edge of a shadow and the position of the satelite above that takes the image. The inverse of the emission angle is the angle of the sun above the horizon. The depth of the crater can be calculated by multiplying the length of the shadow by the tangent of the angle of the sun over the horizon.
Figure 12. Cross-sectional view of an impact crater, showing crater diameter, D, crater depth, d, the shadow cast by the crater's rim, and the illumination geometry. The length of the shadow depends on the angle of the sun above the horizon, β.
The length of the shadow cast by the crater rim depends on the angle of the sun above the horizon, β, which is the complement of the incidence angle, θ. The length of the shadow, L, and the depth of the crater, d, form two legs of a right triangle, as shown in Figure 12, above. The tangent function relates β to crater depth, d, and shadow length, L, as shown in Equation 1:
Equation 1:
| tan(angle of the sun above horizon [degrees]) = | crater depth (km) shadow length (km) |
| tan β = | d L |
|
Equation 1 can be algebraically rearranged into Equation 2, the crater depth equation:
Equation 2:
| crater depth (km) | = | shadow length (km) × tan(angle of the sun above horizon [degrees]) |
| d | = | L tan β |
|
Thus, by measuring the length of the shadow L and knowing the incidence angle, θ, (since β = 90 − θ), we can calculate the crater's depth, d.
- Orient the image so that "up" is the same direction as "up" in the image on Photojournal. You may want to draw an arrow and label it so that you know which way is up. It is important that your image be oriented the same way as the image in Photojournal; otherwise your calculations will be wrong.
- With the image in the computer program of your choice (something akin to Microsoft® PowerPoint®, OpenOffice.org® Impress®, or Adobe® Illustrator®), choose what size you want the image to be. Larger is better, and these images can be enlarged to ~400% without becoming too grainy. Remember, you can also zoom in and out on the craters. You will be limited by pixelation of the image; eventually you will be so zoomed in that the picture looks blurry, and it is hard to tell where the crater starts and stops. You want to enlarge the image (or zoom in enough) so that the craters are easy to measure, but do not zoom in so far that you cannot see them clearly.
- Record the width and height of your image in centimeters (cm). The details of how to do this depend on the software you use, but in most programs clicking on the image will either show you its dimensions or enable you to access menus and dialogue boxes where you can find out the image's dimensions.
- Next, insert a line. The mechanics of doing this will also depend on your software. This line will be your measuring tool. To measure crater diameter or shadow length, extend the line from the point where you want to start measuring to the point where you want to stop measuring. You may need to fine-tune the beginning and ending points in order to place them accurately. Taking the time to place the beginning and ending points of your line accurately is important to the precision and accuracy of your measurements.
- Then, record the width and height of the line in your lab notebook. Use Technical Note #2 to help you measure crater diameter and shadow length correctly.
- In most cases, the computer displays the height, h, and width, w, of the line, but you want to know the length, l, of the line. If you know the height, h, and width, w, of the line, you can calculate that length of the line, l, using Equations 3 and 4, the Pythagorean theorem (see Figure 13 the equations):
Equation 3:
[line length (cm)]² = [line height (cm)]² + [line width (cm)]² l² = h² + w² - l = line length (cm)
- h = line height (cm)
- w = line width (cm)
Equation 4:
line length (cm) = √([line height (cm)]² + [line width (cm)]²) l = √(h² + w²) - l = line length (cm)
- h = line height (cm)
- w = line width (cm)
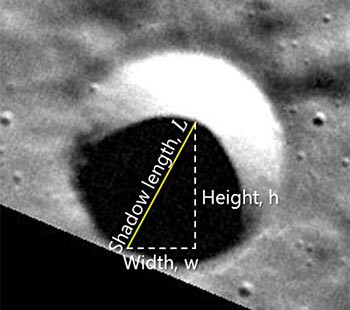 Image Credit: Terik Daly, Science Buddies (from on a Mercury NAC image base) / Science Buddies
Figure 13. If you are measuring crater diameter and shadow length on the computer, the computer program likely tells you the width and height of the line you are using as your measuring tool. But, you really want to know the length of the line. Use the Pythagorean theorem to calculate the length of the line from its width and height. (Base image taken by the Narrow Angle Camera on NASA's MESSENGER mission, 2011.) - Once you calculate the length of the line (which corresponds either to crater diameter or shadow length, depending on which you are measuring), record that result in your lab notebook next to the width and height of the line.
- In most cases, the computer displays the height, h, and width, w, of the line, but you want to know the length, l, of the line. If you know the height, h, and width, w, of the line, you can calculate that length of the line, l, using Equations 3 and 4, the Pythagorean theorem (see Figure 13 the equations):
- Measure each of the craters you chose for analysis. You should have six items recorded in your lab notebook for each crater: the width, height, and length of the line you used to measure crater diameter; and the width, height, and length of the line you used to measure shadow length.
Measure Crater Diameter and Shadow Length (Using a Printed Copy of the Image)
- Orient the image so that "up" is the same direction as "up" in the image on Photojournal. You may want to draw an arrow and label it so that you know which way is up. It is important that your image be oriented the same way as the image in Photojournal; otherwise your calculations will be wrong.
- Using a ruler, measure the height and width (in cm) of the printed version of your image. Record these measurements in your lab notebook.
- Next, measure the crater diameter and shadow length for each crater you decided to analyze, using Technical Note #2 to help you measure crater diameter and shadow length correctly.
Technical Note #3
If you want to "check your work," so to speak, here is an example using image PIA15365: "Living in Anonymity". If you download this same image from NASA Photojournal, make it the same size, and measure the diameter and shadow length of the same crater, then you should get the same (or very close) results. If your results are not similar to those reported you may be measuring incorrectly. If so, take a look at Figure 13 to see if you measured correctly.
Measured on the computer: With the image 19.05 cm tall (7.50 inches ) and 19.00 cm wide (7.48 inches), crater "B" in Figure 9 has a diameter of 1.37 cm (0.54 inches) and a shadow length of 0.74 cm (0.29 inches).
Measured using printer and ruler: With the image 20.39 cm tall (8.03 inches ) and 20.35 cm wide (8.01 inches). Crater "B" in Figure 9 has a diameter of 1.41 cm (0.56 inches) and a shadow length of 0.80 cm (0.31 inches).
Convert Image Measurements to Mercury Measurements
- So far you have measured the sizes of craters in a picture. But, what you really want to know is the size of craters on Mercury. For example, say that you measured a crater to be 2.5 cm across in your photo. That tells you how big the crater is in your picture, but how big that crater is on Mercury?
- In order to make this conversion, you will need the image size (its width and height in pixels), the image resolution (in meters per pixel), and the width and length of the printed or computer copy of the image that you actually measured.
- As an example, consider the NASA Photojournal image PI15365, entitled "Living in Anonymity". This image is 1248 pixels wide by 1252 pixels high, with a resolution of 107 meters per pixel. You can use this information to determine how wide and high the image is in kilometers by using Equation 5, the image width equation, and Equation 6, the image height equation:
Equation 5:
| resolution ( | m pixel (pxl) |
) × image width (pxl) × | 1 km 1000 m |
= image width (km) |
Equation 6:
| resolution ( | m pixel (pxl) |
) × image height (pxl) × | 1 km 1000 m |
= image height (km) |
Use these equations to calculate image height and width (in kilometers) and record the results in your lab notebook.
- Next, determine how many centimeters in your image correspond to how many kilometers on Mercury. To calculate this conversion factor, you will need the image height and width in kilometers (from step 3) and the height and width of the copy of the image you used for your measurements. The conversion factor between length in your image and length on Mercury is found using Equation 7, the height scaling factor, and Equation 8, the width scaling factor.
Equation 7:
| height scaling factor = | image height on Mercury (in km) your image height (in cm) |
Equation 8:
| width scaling factor = | image width on Mercury (in km) your image width (in cm) |
Use Equations 7 and 8 to calculate the measured length to actual Mercury length conversion factor and record the results in your lab notebook.
- Next, use the conversion factor calculated in step 4 to convert the measurements you made of craters and shadows in your image into the actual lengths of those craters and their shadows on Mercury by multiplying by the conversion factor as shown in Equation 9, the length conversion equation.
Equation 9:
| Length on Mercury (km) = Length you measured (cm) × conversion factor | (km/cm) |
Calculate Crater Depth
- Next, calculate the depths of the impact craters using the lengths of the shadows cast by their rims. You might want to consult Technical Note #2 to remind yourself of the geometry involved in this calculation.
- Important: make sure your calculator is in degree mode and not radian mode for angles. If your calculator only has a radian mode, or if you are using a spreadsheet program like Microsoft Excel® for calculations (which only accepts radians for angles), you will need to convert degrees to radians first. Ask a parent or your math teacher for help if you do not know how to do this (hint: 90° is equal to π/2 radians).
- First, you need to calculate β by subtracting the incidence angle, θ, from 90 degrees, as shown in Equation 10, the elevation angle equation.
Equation 10:
| angle of the sun above the horizon | = | 90 − incidence angle |
| β | = | 90 − θ |
|
- Now, use Equation 11 to calculate crater depth, d, using shadow length, L, and β as shown in Equation 11, the crater depth equation:
Equation 11:
| crater depth (km) | = | shadow length (km) × tan(angle of the sun above the horizon) |
| d | = | L tan β |
|
Analyze Your Data
- You now have the two pieces of data that you need for your analysis: the crater diameter and crater depth, both in their actual sizes on Mercury.
- Calculate the ratio between crater depth and crater diameter. Mathematically, this ratio is expressed as Equation 12, the depth-diameter ratio equation
Equation 12:
| depth-diameter ratio = | crater depth (km) crater diameter (km) |
| d D |
|
|
Perform this calculation for each crater you measured and record your results in your lab notebook. Do you notice anything about that ratio for the different simple impact craters that you measured?
- Make a scatterplot to explore the relationship between crater depth and crater diameter. Put crater diameter on the x-axis and crater depth on the y-axis. Do you see a relationship between crater diameter and crater depth?
- Why do you think that planetary scientists measure the depth-to-diameter ratio of impact craters? What might it tell them about a planet's surface or interior? What might it tell them about what happened to a crater after it formed? Use both your data and information from your background research as you brainstorm possible answers to this question.
Ask an Expert
Variations
- In this science project you only measured craters in one image. What happens if you measure craters in two or more MESSENGER images? Are the results similar or different? What might account for these similarities or differences?
- In choosing an image for this science project, you looked for a low emission angle so your measurements would not be significantly affected by the distortion produced by a large emission angle. Can you find a way to mathematically correct for the emission angle (and thereby remove the distortion associated with large emission angles) and measure craters in an image with a large emission angle?
- This science project measured only simple craters. What happens if you measure complex craters instead? Does the depth-to-diameter relationship change or remain the same? How does the depth-to-diameter ratio for complex craters compare to that ratio for simple craters?
- In this science project, you only measured simple craters on Mercury; however, Photojournal has data from a number of planets, so you could use this same method to analyze craters on a different planet. How do the results from simple craters on Mercury compare to the results for simple craters on another planet, such as Mars? Is the ratio between crater depth and crater diameter the same or different? What might account for those similarities or differences?
- As part of this science project, you created a scatter plot showing the relationship between crater diameter and crater depth. Can you develop a mathematical or statistical model to quantify the relationship between these two variables? Can you use your model to predict a crater's depth based on its diameter? A statistical method called "least squares regression" may be helpful.
Careers
If you like this project, you might enjoy exploring these related careers:


Related Links
- Science Fair Project Guide
- Other Ideas Like This
- Astronomy Project Ideas
- Space Exploration Project Ideas
- My Favorites