Measuring the Amount of Acid in Vinegar by Titration with an Indicator Solution
Abstract
Have you ever wondered why some foods taste really sour? Vinegar is one example that you might know from salad dressings or pickles. They taste pretty sour, right? There are many different types of vinegar that you can buy to use around the kitchen for cooking and pickling. The chemical compound that gives vinegar its tart taste and pungent smell is acetic acid. Do you think all the different vinegars contain the same amount of acetic acid? Are there some that are more sour than others? How much variation is there between the different types? Try this science project to find out—and use your phone and a sensor app to record your data!Summary
Edited by Svenja Lohner, PhD, Science Buddies
Sources
This project is based on the vinegar titration experiment described here:
- Carboni, G., 2004b. Experiments with Acids and Bases: How Acid Is That Vinegar? Fun Science Gallery. Retrieved July 24, 2007.
Objective
Determine the amount of acid in different types of vinegar using titration with a colored pH indicator to determine the endpoint.
Introduction

You may be familiar with vinegar's tart taste and pungent smell, but do you know how vinegar is made? Vinegar is a solution made from the fermentation of ethanol (CH3CH2OH), which in turn was previously fermented from sugar. The fermentation of ethanol results in the production of acetic acid (CH3COOH). There are many different types of vinegar (some are shown in Figure 1), each starting from a different original sugar source (e.g., rice, wine, malt, etc.). The amount of acetic acid in vinegar can vary, typically 4–6% for table vinegar, but up to three times higher (18%) for pickling vinegar (Wikipedia contributors, 2007).
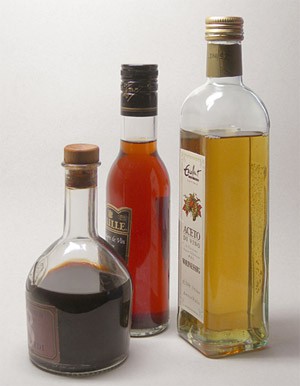 Image Credit: Wikimedia commons user Rainer Zenz / Creative Commons Attribution-Share Alike 3.0 Unported
Figure 1. There are many different types of vinegars such as balsamic vinegar, white wine vinegar or red wine vinegar shown in this image.
(Image credit: by Rainer Zenz, via Wikimedia Commons)
In this science project, you will determine the amount of acid in different vinegars using titration, a common technique in chemistry. Titration is a way to measure the unknown amount of a chemical in a solution by adding a measured amount of a chemical with a known concentration (the titrant, or titrating solution). The titrating solution reacts with your sample, and the endpoint of the reaction is monitored in some way. The unknown concentration of your sample can now be calculated from the amount of titrating solution added, and the ratio of the two chemicals in the chemical equation for the reaction. Let us go through the process with a specific example: the titration of acetic acid. But before we go over titration, here is a quick review of the chemistry of acids and bases.
It all has to do with hydrogen ions (abbreviated with the chemical symbol H+). In water (H2O), a small number of the molecules dissociate (split up). Some of the water molecules lose a hydrogen ion and become hydroxyl ions (OH−). The "lost" hydrogen ions join up with water molecules to form hydronium ions (H3O+). By convention (and for simplicity in writing chemical equations), hydronium ions are referred to as hydrogen ions (H+). In pure or distilled water, there is an equal number of hydrogen ions and hydroxide ions. Such a solution is called neutral. If the balance is shifted towards the hydrogen ions, the solution becomes acidic. In contrast, if the hydroxide ions outnumber the hydrogen ions, the solution is basic.
Where do the extra hydrogen or hydroxide ions come from? These come from acids or bases. Acids and bases are defined by whether they donate, or accept, hydrogen ions. An acid, like acetic acid, is a substance that donates hydrogen ions. When acetic acid is dissolved in water, the balance between hydrogen ions and hydroxyl ions is shifted. Now there are more hydrogen ions than hydroxyl ions in the solution—it is acidic. A base is a substance that accepts hydrogen ions. When a base is dissolved in water, the balance between hydrogen ions and hydroxyl ions shifts the opposite way. Because the base "soaks up" hydrogen ions, the result is a solution with more hydroxyl ions than hydrogen ions; the solution becomes basic. The pH of a solution is a measure of how acidic or basic it is. A neutral solution such as distilled water has a pH of 7. An acidic solution such as acetic acid, lemon juice, or battery acid has a pH below 7. Finally, a basic solution like baking soda or bleach has a pH above 7. For a refresher, see the Science Buddies page on Acids, Bases, & the pH scale.
To measure the acidity of a vinegar solution, you will add hydroxyl ions to balance out the extra hydrogen ions from the acid. The hydroxyl ions will react with the hydrogen ions to produce water. In order for a titration to work, you need three things, shown in Figure 2:
- A titrating solution (contains hydroxyl ions with a precisely-known concentration)
- A method for delivering a precisely-measured volume of the titrating solution
- A means of indicating when the acid has been neutralized, meaning that the endpoint has been reached
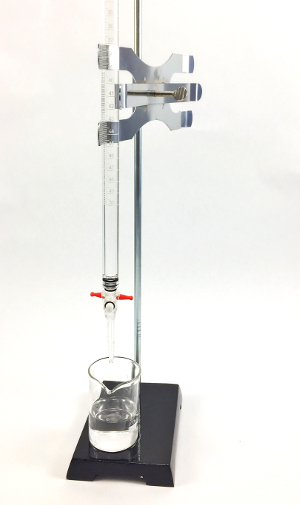
Figure 2. Titration setup with a buret (filled with titrating solution) mounted on a stand above a beaker containing the sample and indicator solutions.
For the titrating solution, you will use a dilute solution of sodium hydroxide (NaOH). Sodium hydroxide is a strong base, which means that it dissociates almost completely in water. So for every NaOH molecule that you add to the solution, you can expect one hydroxyl ion to be produced.
To dispense an accurately-measured volume of the titrating solution, you will use a buret. A buret is a long tube with a valve at the bottom and graduated markings on the outside to measure the volume contained in the buret. The buret is mounted on a stand, directly above the sample solution, as shown in Figure 2, above.
Lastly, in this experiment, you will use an indicator solution called pheonolphthalein. (I love to say that word: fee-nol-fthay-leen!) Phenolphthalein is a pH indicator solution that is colorless when the solution is acidic or neutral, but when the solution becomes slightly basic, phenolphthalein turns pinkish, and then light purple as the solution becomes more basic. So when your vinegar solution starts to turn pink, you know that the titration is complete and you have reached the endpoint.
 Image Credit: Wikimedia commons user Luigi Chiesa / Public Domain
A titrating solution drips from a buret into a beaker and changes the color of the solution in the beaker. An animated graph to the right shows the solution's pH over the volume of sodium hydroxide added. Both values remain low until the middle of the experiment when the solution hits an equivalence point and the graphs slope increases exponentially. Shortly after it plateaus and levels out when the solutions stops changing color.
Figure 3. This animation demonstrates the titration process, including recording a titration curve (Image credit: by Luigi Chiesa, via Wikimedia Commons).
You can visualize the process of an acid (vinegar) neutralization in a titration curve, which is a graph that shows the amount of added base (sodium hydroxide) on the x-axis and the pH of the solution (that you can measure throughout the titration with a pH meter) on the y-axis. The animation in Figure 3 summarizes the titration process and shows how the titration curve is recorded. For an acid titration, the titration curve typically starts with a low pH value. Once you start adding the base, the pH increases slightly until the acid is neutralized, which means that the number of hydroxyl ions and hydrogen ions are the same. This point, also called equivalence point, is characterized by a sharp increase in pH. At this point, the hydroxyl ions take over in the solution, which means that it turns basic and the pH indicator is changing color. In this project, you can record your own titration curve, but instead of monitoring the pH of the solution, you will measure the color change of the indicator using the light sensor of your phone. Which type of vinegar do you think will have the most acetic acid? Find out for yourself with this science project.
Terms and Concepts
- Vinegar
- Fermentation
- Acetic acid (CH3COOH)
- Titration
- Titrant
- Neutral
- Acidic
- Basic
- Acid
- Base
- pH
- Sodium hydroxide (NaOH)
- Buret
- pH indicator solution, e.g., phenolphthalein
- Titration curve
- Equivalence point
Questions
- How can you calculate the amount of a chemical in a solution using titration?
- What range of pH values do you expect different types of vinegar to have?
- How does a pH indicator solution work?
- At what pH does phenolphthalein change from colorless to pinkish?
Bibliography
To get you started, here is a Wikipedia article on vinegar:- Wikipedia contributors, 2007. Vinegar, Wikipedia, The Free Encyclopedia. Retrieved July 24, 2006.
- Science Buddies Staff (2012). Acids, Bases, and the pH Scale. Retrieved July 15, 2021.
- Carboni, G., 2004b. Experiments with Acids and Bases: How Acid Is That Vinegar? Fun Science Gallery. Retrieved July 24, 2007.
- U of MN, 2004a. What Is an Exponent? Math Review: Useful Math for Everyone, University of Minnesota, School of Public Health. Retrieved July 24, 2007.
- U of MN, 2004b. What Is a Logarithm? Math Review: Useful Math for Everyone, University of Minnesota, School of Public Health. Retrieved July 24, 2007.
Materials and Equipment
These items can be purchased from Carolina Biological Supply Company, a Science Buddies Approved Supplier:
- Small funnel, used only for chemistry and not for food
- Chemical splash safety goggles
- 0.5% Phenolphthalein solution in alcohol, used as the pH indicator solution
- Note: If you are ordering this chemical through Carolina Biological Supply Company, the chemical must be ordered by a teacher and shipped to a school or business address, so plan accordingly.
- 0.1 M sodium hydroxide solution
- Caution: Sodium hydroxide is caustic, which means it will cause a chemical burn on bare skin. It is also flammable. However, the 0.1 M solution is fairly dilute and relatively safe to use with proper chemical safety precautions (chemical safety goggles, lab coat or apron, and rubber gloves).
- Note: Since each molecule of sodium hydroxide (NaOH) can produce one hydroxide ion (OH−), 0.1 N sodium hydroxide is the same as 0.1 M.
- Note: If you are ordering this chemical through Carolina Biological Supply Company, the chemical must be ordered by a teacher and shipped to a school or business address, so plan accordingly.
- 250 mL beaker and a stirring rod. You can also use an Erlenmeyer flask.
- Note: If you are using a sensor app to record your titration curve, an Erlenmeyer flask will not work. You have to use a beaker instead.
- 25 or 50 mL buret and ring stand with buret clamp
- 10 mL graduated cylinder
- Disposable gloves. Alternatively, these can be purchased at a local drug store or pharmacy. If you are allergic to latex, use vinyl or polyethylene gloves.
You also need to gather these items:
- Vinegar, at least three different types
- Tip: It will be easier to see the indicator change color with lighter-colored vinegars.
- Distilled water. This can be purchased from a grocery store.
- Lab coat or lab apron. Can be purchased at scientific supply companies, or through an online supplier like Carolina Biological Supply Company. Alternatively, old, protective clothing may be used instead.
- Lab notebook
- For the titration curve: Flashlight
- For the titration curve: Timer or stopwatch
- For the titration curve: Smartphone with a sensor app such as phyphox, available for free on
Google Play for Android devices (version 4.0 or newer) or from the App Store for iOS devices (iOS 9.0 or newer). Note: Phyphox does not support the light sensor on iOS devices. If you need the light sensor, you have to use Android devices for your experiment. Note that on some devices the light sensor is only updated when there is a coarse change of illuminance. This means that if the light intensity does not change or only changes slightly, the sensor appears to not record any data. The recording will continue once the light intensity changes again. If your experiments allows, it helps to wiggle the phone or the light source (e.g. flashlight) slightly to induce minimal reading fluctuations and keep the sensor active.
- For the titration curve: A transparent, waterproof plastic bag that fits your phone inside
Disclaimer: Science Buddies participates in affiliate programs with Home Science Tools, Amazon.com, Carolina Biological, and Jameco Electronics. Proceeds from the affiliate programs help support Science Buddies, a 501(c)(3) public charity, and keep our resources free for everyone. Our top priority is student learning. If you have any comments (positive or negative) related to purchases you've made for science projects from recommendations on our site, please let us know. Write to us at scibuddy@sciencebuddies.org.
Experimental Procedure
Note: This project requires the use of a sodium hydroxide solution, which is caustic. You will have to order this chemical through your school. Proper safety precautions should be used when working with this solution, including:
- Chemical splash safety goggles
- Lab coat/apron
- Gloves
Performing the Titration
During your titration, you have the option to use a sensor app to record your titration curve. Sensor apps such as phyphox let you record data using sensors that are built into many smartphones, including a light sensor which measures light levels (normally this sensor is used to automatically adjust the brightness of your phone's screen). In this project, you can use the app to record the color change in your sample once the pH indicator turns from acidic to basic.- Do your background research so that you are knowledgeable about the terms, concepts, and questions in the Background section. For information about doing a titration, visit the Science Buddies webpage Titration Tutorial: Tips & Tricks for Titrating.
-
Since you will be working with dilute sodium hydroxide, you should take proper safety precautions:
- Wear chemical splash safety goggles, a lab coat (or apron), and a pair of rubber gloves.
- If you spill sodium hydroxide on your skin, wash it off quickly with lots of running water.
- Pour 1 milliliter (mL) of vinegar in a beaker.
- Dilute the vinegar with about 50 mL of distilled water.
-
Add about 0.5 mL (about 10 drops) of 0.5% phenolphthalein solution and mix with a spoon or stirring rod.
- Phenolphthalein solution is colorless at acidic pH, and turns light purple at about pH 8.3.
- The vinegar solution is acidic, so it should remain colorless (although the solution might become cloudy temporarily).
- Use the buret clamp to attach the buret to the ring stand. The opening at the bottom of the buret should be just above the height of the beaker you used for the vinegar/water/phenolphthalein solution.
- Use a funnel to fill the buret with a 0.1 M solution of sodium hydroxide.
-
Note the starting level of the sodium hydroxide solution in the buret. Solutions in the buret tend to creep up the sides of the glass at the surface of the liquid. This is due to the surface tension of water. The surface of the liquid thus forms a curve, called a meniscus. To measure the volume of the liquid in the buret, always read from the bottom of the meniscus. In Figure 4 below, for example, the fluid level is about 17.25 mL.
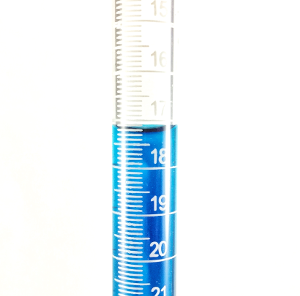
Figure 4. Always read the fluid level in the buret from the bottom of the meniscus.
- If you decide to record your titration on a titration curve, put your phone into a transparent, waterproof bag to protect it from any spills, and place it underneath the buret. Make sure the bag is transparent so light can get through.
- Make sure you know the location of the light sensor in your phone and test if it works as expected.
- In your sensor app, open the light sensor.
- Put the vinegar solution to be titrated under the buret on top of your phone's light sensor.
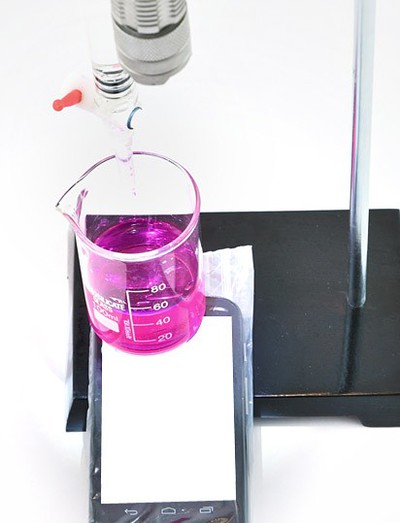
- Attach a flashlight to the stand above your phone so that it shines through the solution in your beaker right onto the light sensor. The reading should be constant as long as the light is not changing. Figure 5, below, shows an example of the experimental setup at the beginning of the titration.
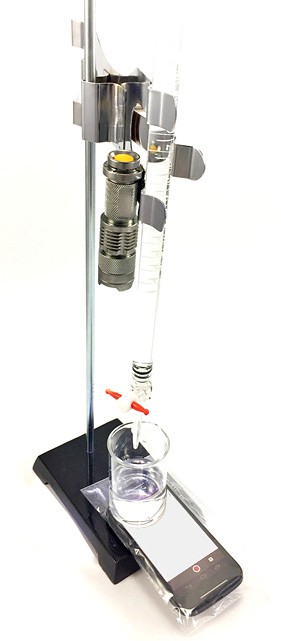 Image Credit: Science Buddies
Figure 5. Titration setup including the equipment for recording the titration curve at the beginning of your experiment. At the start of the vinegar titration, the phenolphthalein is colorless.
- Before you begin with the titration, press the play button in the phyphox app to start a recording.
- Open the valve of the buret and slowly drip the solution of sodium hydroxide into the vinegar solution one drop at a time (aim for about one drop per second). You might notice that the vinegar solution turns pink where the drop is falling into the solution. Do not stir the solution yet.
- Use a timer or stopwatch to count the number of drops that fall into the solution for 10 seconds. Do not swirl or stir the solution during that time. Record the number of drops in your lab notebook.
- Once you have counted the drops, use your stirring rod and stir the solution slightly. The pinkish color should quickly disappear as the solution is mixed. Be careful not to hit the buret or beaker, and do not block the light sensor of your phone. You will notice that the light sensor readings fluctuate while you stir. Keep the stirring to a minimum (only stir when the drop fell in and colors the solution) to not affect your data too much. Note: Depending on the acid concentration of your vinegar, the titration might take up to several minutes. If you record the titration curve, do not change the dripping speed during your experiment!
- When the vinegar solution turns pink and remains that color even with mixing, the titration is complete. With the buret valve still open, quickly read the remaining level of the sodium hydroxide solution in the buret and note it in your lab notebook. Remember to read from the bottom of the meniscus. Figure 6, below, shows how the solution color changes at the equivalence point (endpoint) of the titration.
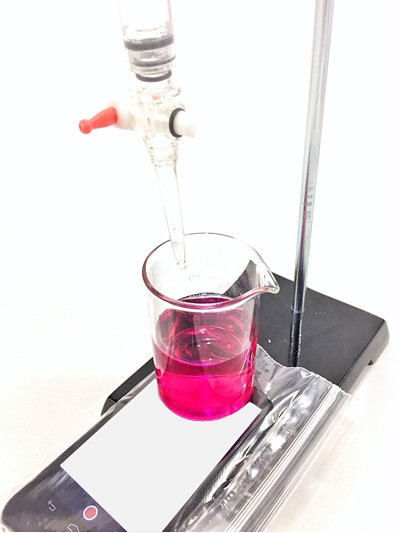
Figure 6. The endpoint of the titration is reached when the phenolphthalein in solution turns pinkish.
- Once you have reached the endpoint of your titration, take your timer or stopwatch and again count the number of drops that fall into the solution for 10 seconds. Write down this number in your lab notebook.
- Let the sodium hydroxide drip into the vinegar solution for 1–2 more minutes. Then, stop recording your data and close the tap (or pinch valve) of the buret. Make sure to save your data and name the experiment appropriately.
- Rinse out your beaker and refill the buret with sodium hydroxide solution. For each vinegar that you test, repeat the titration at least three times, starting with step 3. If you are careful with all of your volume measurements, the results of your three repeated trials should agree within 0.1–0.3 mL.
Analyzing Your Results
Here's how to figure out how much acetic acid was in each sample.
- For each trial, subtract the initial level of sodium hydroxide in the buret from the remaining level to figure out how much titrating solution you have used.
- Calculate the average volume of used titrating solution from all your trials for one type of vinegar.
- Then, determine the number of moles of sodium hydroxide used to titrate the vinegar.
- Multiply the volume of added sodium hydroxide (in liters) by the concentration (in moles/liter).
- For example, if you added 12.5 mL of sodium hydroxide, the number of moles would be 0.0125 L x 0.1 moles/L = 0.00125 moles.
-
Next, determine the concentration of acetic acid in the vinegar.
- The number of moles of sodium hydroxide equals the number of moles of acetic acid in your vinegar sample (Ms).
- The sample volume was 1 mL, or 0.001 L (Vs).
- You can use a proportion to determine the number of moles of acetic acid (Mx) in a standard volume (Vx = 1 L) of vinegar: Ms/Vs = Mx/Vx.
- Continuing with the previous example, the number of moles of acetic acid would be 0.00125. Dividing by 0.001 L gives 1.25 moles of acetic acid per liter, or a concentration of 1.25 M.
- You can also calculate the concentration in terms of grams of acetic acid per liter. To do this, multiply the molar concentration of acetic acid by the molecular mass of acetic acid, which is 60. In the case of our example, the concentration would be 1.25 x 60 = 75 g/L, or 7.5%.
- Repeat the calculations for each type of vinegar you tested. Which vinegar had the highest concentration of acetic acid?
Analyzing Your Titration Curves
A titration curve allows you to determine the amount of acid in a sample, even if you did not perform the titration experiment yourself (and therefore could not write down the amount of titrating solution used). This is how you can determine the amount of acid in your sample from a titration curve:- Analyze the titration curve for each of your trials and types of vinegar. They should look something like the graph in
Figure 7. As your vinegar solution started out colorless and clear, the light sensor was able to pick up a lot of light in the beginning. Besides some fluctuations from stirring the solution, the sensor readings should have stayed relatively constant until the titration endpoint was reached. At this point (when the solution turned pink permanently), the sensor readings should have dropped sharply, as with a darker solution less light gets through to the light sensor.
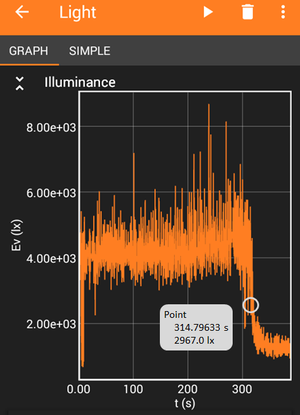 Image Credit: Science Buddies
A graph of light intensity measured in lux over time for a light that shines through a titrating solution. The light has a minimum value of about 900 lux and a maximum value of about 8,000 lux. A steep decrease in lux values marks the time the equivalence point was reached.
Figure 7. Example data from the phyphox app showing a titration curve. The x-axis of the graph shows time in seconds [s] and the y-axis is light intensity in lux. The image shows how you can determine the time of the equivalence point, or when the acid in your vinegar has been neutralized, from your data.
- First, you have to find the equivalence point in your titration curve, which is the point at which your acid has been neutralized by the titrating solution. In an original titration curve, this endpoint is characterized by a sharp increase of pH in your sample solution. At the same time, the pH indicator changes color. As you monitored the color of your sample with a light sensor in this experiment (and not the pH), the equivalence point will be characterized by a sharp change in light intensity as the solution changes color.
- Open the titration curve recording in the phyphox app and use the 'pick data' tool to pick the data point in the middle of the sudden drop in light intensity. The app will display the x- and y-values for the selected data point. In Figure 7, the equivalence point would be at 315 seconds (5:15 min:s).
- Note: For your calculations you need to know how much time into the titration the equivalence point occurred. If you started recording your titration curve earlier than you started the actual titration (dripping your titrating solution into your sample), you have to subtract the time before you started your experiment from the equivalence point time that you have determined in the previous step. The result will be the time it took from the beginning of your titration until the acid in your vinegar was neutralized.
- If necessary, convert your result into seconds by multiplying the number of minutes by 60 and adding the number of seconds.
- Next, you have to find out how much titrating solution has been used until the equivalence point was reached. In an original titration curve, the x-axis will already show the titration volume. However, in your titration curve, you have to first convert the titration time (shown on the x-axis of your graph) into titration volume.
- For this, you need to know the number of drops that dripped into the vinegar solution. You counted these in the beginning and end of your titration experiment. Alternatively, you can derive this information from your graph as well.
- Zoom into the very beginning of your graph when you counted the drops and were not stirring the solution yet. It should look something like Figure 8. Every single drop should make a little dip in your graph as the light intensity reaching your light sensor briefly changes when the drop hits the solution surface. Pick a 10 second interval on the graph and count the number of dips. The result will be the number of drops falling into your solution during that time. In Figure 8, this would be 5 drops in 10 seconds.
- Next, zoom into the the graph right after your equivalence point and again count the number of dips you see for a 10 second interval.
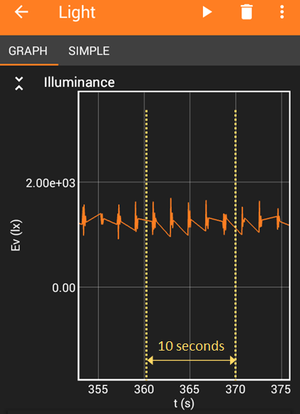 Image Credit: Science Buddies
Focusing on the first 10 seconds of a light intensity graph for light shining through a titrating solution shows small spikes in the lux values. The small spikes in data are the result of droplets falling into the solution.
Figure 8. Zooming into the beginning of your titration curve, you should be able to see a dip in light intensity for every drop that fell into the solution. The x-axis of the graph shows time in seconds [s] and the y-axis is light intensity in lux. Count the number of drops for a 10 second interval.
- Convert the number of drops for both of your counts into drops per second. For example, if you counted five drops in 10 seconds, then this would be 5/10 = 0.5 drops per second. Note: The dripping speed should have automatically slowed down throughout your titration, even though you did not change anything. This is because the height of the water column inside the buret is related to the flow rate of liquid from it, which means that with less titrating solution in the buret, there will be a slower flow.
- Calculate the average flow rate of your titrating solution (in drops per second) from your initial and final dripping speeds.
- As you know the time at which your sample was neutralized (determined in step 2.c of this section), you can now calculate how many drops of titrating solution were added until that point. For example, if your flow rate was 0.5 drops per second, and your acid was neutralized after 602 seconds, then you added 0.5 x 602 = 301 drops to your vinegar solution.
- Considering that one drop contains about 0.05 mL liquid, you added 301 x 0.05 = 15.05 mL titrating solution to your sample until it was neutralized.
- For this, you need to know the number of drops that dripped into the vinegar solution. You counted these in the beginning and end of your titration experiment. Alternatively, you can derive this information from your graph as well.
- Repeat steps 2 and 3 for each of your trials and calculate the average volume of used titrating solution from all your trials for one type of vinegar.
- Then, continue with step 3 in the "Analyzing Your Results" section to calculate how much acetic acid was in your vinegar sample.
- Finally, repeat steps 2–5 for each type of vinegar that you titrated.
- Are the results that you determined from your titration curves similar to the ones that you got from writing down the used amount of titrating solution during your titration experiment? If there are differences, can you explain these?
- What other information can you get from a titration curve?
Ask an Expert
Global Connections
The United Nations Sustainable Development Goals (UNSDGs) are a blueprint to achieve a better and more sustainable future for all.

Variations
- Measure the acidity of solutions such as beer or wine.
- Measure the acidity of other beverages, such as: different fruit juices, soda, sport drinks, coffee, or teas.
- Measure the acidity of fermenting apple cider over time.
- Measure the acidity of uncorked wine over time (check once a day over the course of a week).
Careers
If you like this project, you might enjoy exploring these related careers:


Related Links
- Science Fair Project Guide
- Other Ideas Like This
- Chemistry Project Ideas
- Science With Your Smartphone Project Ideas
- My Favorites
- Acids, Bases, & the pH Scale
- Chemistry Safety Guide
- Titration Tutorial: Tips & Tricks for Titrating