Abstract
Do you read the list of ingredients in foods and drinks before you buy them at the grocery store? If you do, you may have noticed that many of the items, especially colored drinks, contain dyes with names such as FD&C Blue 1, Red 40, or Yellow 5. But how much dye is needed to create all these colors? In this chemistry science project, you will build a simple spectrophotometer that is able to measure the concentration of colored chemicals in solutions. You will test your device by measuring the concentration of Blue 1 in a variety of sports drinks. How much color do you think they contain?
Summary
Some knowledge of basic chemistry, as well as familiarity with electronics, would be helpful, but is not required.
A kit is available from our partner Home Science Tools®. See the Materials section for details. For data analysis, a spreadsheet program, such as Google SheetsTM or Microsoft® Excel® is helpful.
David B. Whyte, PhD, Science Buddies
Svenja Lohner, PhD, Science Buddies
- Google SheetsTM is a registered trademark of Google, Inc.
- Microsoft® is a registered trademark of Microsoft Corporation.
- Excel® is a registered trademark of Microsoft Corporation.
Recommended Project Supplies
/-/https/www.sciencebuddies.org/cdn/Files/9151/22/SB-SENSOR-electronics-sensor-kit-image.jpg)
Objective
In this chemistry science fair project, you will measure the concentration of food color Blue 1 in a variety of sports drinks, with the help of a self-made simple electronic device that functions as a spectrophotometer.
Introduction
/-/https/www.sciencebuddies.org/cdn/Files/7860/17/sports-drinks-thumbnail.jpg)
Do you like sports drinks after exercising, or even when you are not working out? Most of these drinks have a very intense color, ranging from yellow, red, blue, purple, and green. Have you ever wondered where these colors come from? The food industry has developed many different food dyes—both artificial and natural—that they add to foods and beverages to make them more attractive. You can find these colors on the ingredients list of your drinks; they have names such as "Blue 1," "Red 40," or "Yellow 5." Different colors require different amounts of dye, or even a mixture of several colors. As an example, Blue 1 is the food dye of choice for blue drinks, and is also mixed with Red 40 to generate a purple color. Are you curious about how much food dye is in your sports drink? In this science project, you can find out, testing different samples of blue beverages.
To do this, you will build a simplified version of a special device, called a spectrophotometer, to measure the color of your samples and to determine the concentration of dye in your sample solution. The color of your sample is related to its wavelength, as shown in Figure 1.
/-/https/www.sciencebuddies.org/cdn/Files/7845/22/spectrehorizontal.jpg)
Figure 1. The spectrum and wavelengths of visible light. The units are nanometers (nm). (Image credit: by Maulucioni, via Wikimedia Commons)
A spectrophotometer measures the light absorption of your sample at a specific wavelength. It does this by separating white light into a rainbow of colors, using diffractive gratings, and then passing the light through the sample. The amount of light that is transmitted is measured by a light detector on the exit side of the sample. The result is an absorption spectrum, such as the one shown for the food dyes Blue 1 and Red 40 in Figure 2. For Blue 1, the detector measures two small peaks at around 320 nm and 420 nm and a large peak at around 620 nm, which corresponds to orange light. The solution appears blue because the red and yellow light has been absorbed by the dye.
/-/https/www.sciencebuddies.org/cdn/Files/7846/21/absorption-spectra.png)
Figure 2. Absorption spectra of the food dyes Blue 1 and Red 40. Note that the blue dye absorbs light strongly at a wavelength of about 620 nm, which is in the orange part of the visible spectrum (see Figure 1 for colors and wavelengths). Red 40 absorbs strongly at around 500 nm, roughly in the blue-green part of the spectrum. (Thomasson, 1998.)
Your simplified spectrophotometer will consist of a circuit that has a light source (a white light-emitting diode (LED)) and a light detector (a photoresistor). Your dye solutions will be placed between the light source and the detector, and you will measure the amount of light that passes through the sample, as shown in Figure 3. To keep your setup simple, you will not use diffractive gratings to split the light from your light source into separate wavelengths. Instead you will use an absorption filter, or wavelength selector (orange-colored water) to produce the desired input wavelength that corresponds to the absorbance maximum of Blue 1 (620 nm). Your measurement output will be the level of resistance from your detector. The photoresistor has a high resistance in the dark, and its resistance decreases as light levels increase. The resistance of your photoresistor is related to the absorbance of your sample and is measured with a digital multimeter in ohms (Ω). As more light is absorbed by your sample, less light passes through the solution, so the resistance increases.
/-/https/www.sciencebuddies.org/cdn/Files/7847/17/principle-spectrophotometer.png)
A white light from an LED shines through an absorption filter that only allows a specific wavelength of light to pass through. The filtered light passes through a cuvette filled with a sample solution and into a photoresistor that is attached to a multimeter.
Figure 3. Setup (not to scale) of your own simplified spectrophotometer device for measuring the concentration of food dye Blue 1 in sports drinks. The light from the LED passes through the filter (orange water) and the sample (blue liquid) before it hits the detector. It also passes through the sides of the vessels holding the liquids. These sides need to be clear, flat, and 1 cm wide. Cuvettes are designed precisely for this application.
But how do we get from the light absorbance of a dye sample to its concentration? This question is answered by the Beer-Lambert law (Equation 1), which states that the concentration of a chemical, such as Blue 1, in a sample solution is directly proportional to the amount of light it absorbs; if you double the concentration of the chemical or dye, the solution absorbs twice as much light.
Equation 1:
- A = absorbance, which is unitless
- ε = molar absorption coefficient, measured in liters/(mol x cm).
- c = concentration, measured in moles per liter (mol/L).
- l = path length of the light through the sample, measured in centimeters (cm).
The Beer-Lambert law specifically says that the absorbance of light by a chemical in a solution is equal to the product of the chemical's concentration, the path length of light in the container (l) in centimeters, and the molar absorption coefficient. It makes sense that the amount of light absorbed is proportional to the concentration and to the length of the light beam's path through the solution. These are familiar concepts from everyday observations. But what is the molar absorption coefficient? The size of the molar absorption coefficient reflects how well the molecule absorbs light of a given wavelength. A blue solution, such as Blue 1, absorbs red and yellow light better than it absorbs blue light, which is why we perceive it as blue. For the same reason, a red solution absorbs blue and green light better than it absorbs red light. The color of the solution is determined by the color of light the molecules do not absorb, since this is the color that is transmitted to your eyes. The molar absorption coefficient is high at the wavelengths that are absorbed the most, as shown in Figure 2.
This may all sound quite complicated, but do not worry, it is actually much easier than it sounds; so, prepare your sports drinks and try it out yourself!
Terms and Concepts
- Food dye
- Blue 1
- Spectrophotometer
- Wavelength
- Nanometer (nm)
- Light absorption
- Light transmission
- Absorption spectrum
- Light-emitting diode (LED)
- Photoresistor
- Absorption filter
- Wavelength selector
- Resistance, ohms (Ω)
- Beer-Lambert law
- Molar absorption coefficient
- Breadboard
- Standard solutions
- Calibration curve
Questions
- What are the terms in the Beer-Lambert equation?
- How does the absorbance (A) relate to the fraction of light transmitted (T/T0) through the sample?
- What are some ways chemists use spectrophotometers in their work?
- What causes certain chemicals, such as food dyes, to be brightly colored?
Bibliography
- Griffiths J.C. (2005). Coloring Foods & Beverages. Food Technology Vol. 59, No. 5. Retrieved May 3, 2016.
- Science Buddies Staff. (n.d.). How to Use a Breadboard. Retrieved September 25, 2015.
- Science Buddies Staff. (n.d.). How to Use a Multimeter. Retrieved June 10, 2016.
- Thomasson, K. "Applying Statistics in the Undergraduate Chemistry Laboratory: Experiments with Food Dyes." Journal of Chemical Education. Vol. 75, No. 2, 1998: p. 231.
- Sheffield Hallam University. (n.d.). Beer's Law. Retrieved December 9, 2008.
Materials and Equipment 
Recommended Project Supplies
- Electronic Sensors Kit, available from our partner Home Science Tools®. You will need these items from the kit:
- Solderless breadboard (1)
- Jumper wires (3)
- Alligator clip leads (2)
- 9 V battery (1)
- 9 V battery snap connector (1)
- Photoresistor (1)
- High-brightness white LED (1)
- 220 Ω resistor (1)
- Digital multimeter
- You will also need to gather these items, not included in the kit:
- Cuvettes; available from Amazon.com or Carolina Biological, item #653311
- Clear tape
- Cups or glasses, each must hold 12 oz. (9)
- Tap water
- Food coloring, including "Blue 1", red, and yellow; available from Amazon.com
- Liquid measuring cup
- Spoon
- Eyedropper or transfer pipette
- Small cardboard box or ceramic bowl to block light
- A variety of blue sports drinks, must contain food color Blue 1
- Permanent marker
- Lab notebook
-
Graph paper or spreadsheet software
Disclaimer: Science Buddies participates in affiliate programs with Home Science Tools®, Amazon.com, Carolina Biological, and Jameco Electronics. Proceeds from the affiliate programs help support Science Buddies, a 501(c)(3) public charity, and keep our resources free for everyone. Our top priority is student learning. If you have any comments (positive or negative) related to purchases you've made for science projects from recommendations on our site, please let us know. Write to us at [email protected].
Experimental Procedure
The following procedure can be broken into three parts:
- Build and test the spectrophotometer that converts the concentration of dye in a solution into electrical resistance, which you can read off a multimeter;
- Make a set of standard solutions, so that you know how to convert between the data you have (resistance) and the data you want (concentration); and
- Determine the amount of dye in your sports drink samples with unknown concentrations of Blue 1.
Part 1: Building and Testing the Spectrophotometer
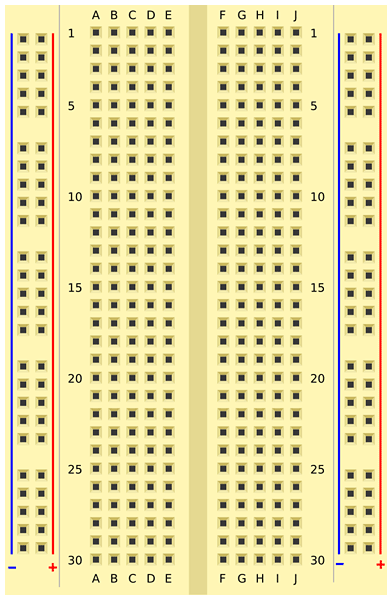
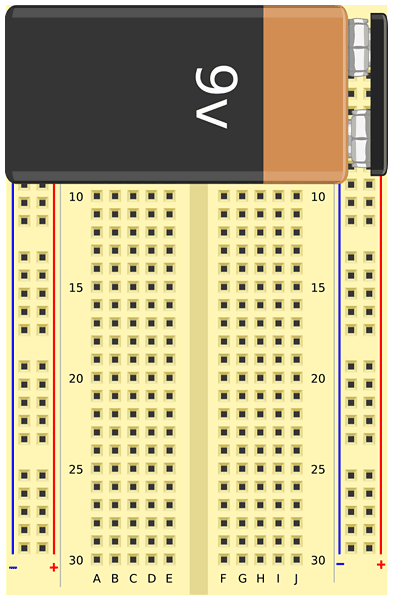
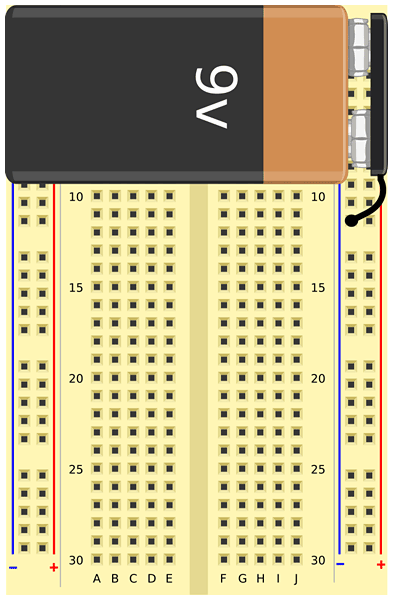
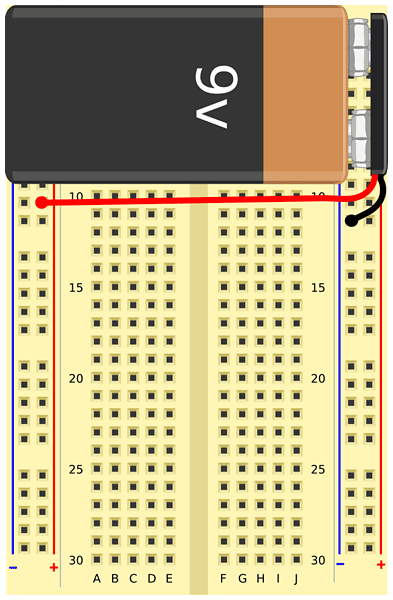
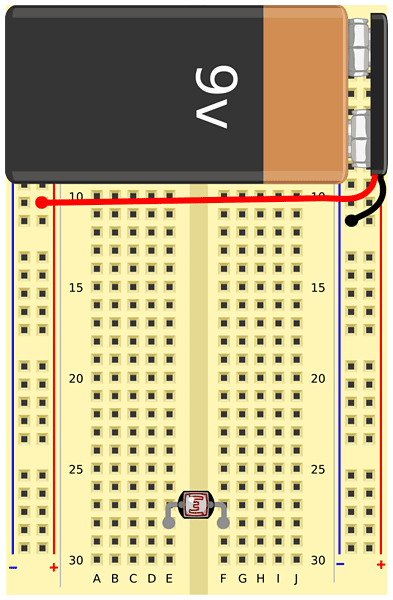
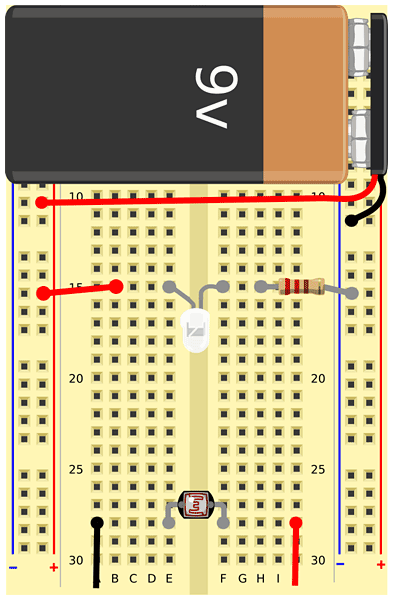
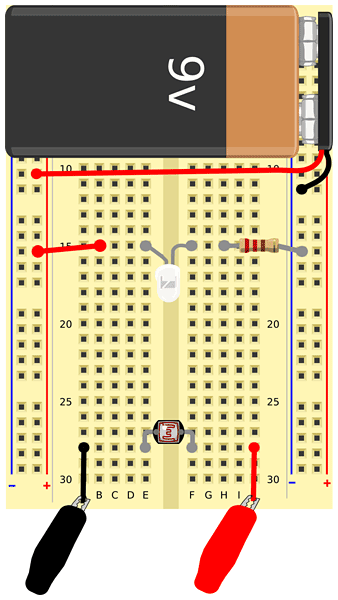
In this section, you will assemble a circuit on a breadboard. If you have never used a breadboard before, you should refer to the the Science Buddies resource How to Use a Breadboard for Electronics and Circuits before you proceed. You can follow a step-by-step slideshow that will show you how to put components in the breadboard one at a time. Alternatively, Table 1 lists each component and its location on the breadboard. Important: Read these notes before you proceed:
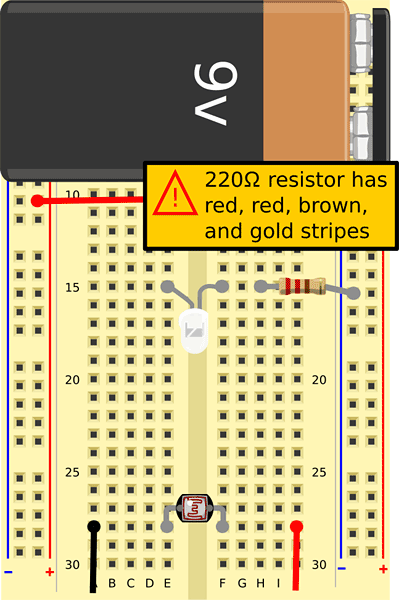
- Resistors are marked with colored bands. These colors do matter. Make sure you pick the right resistors for each step according to the markings.
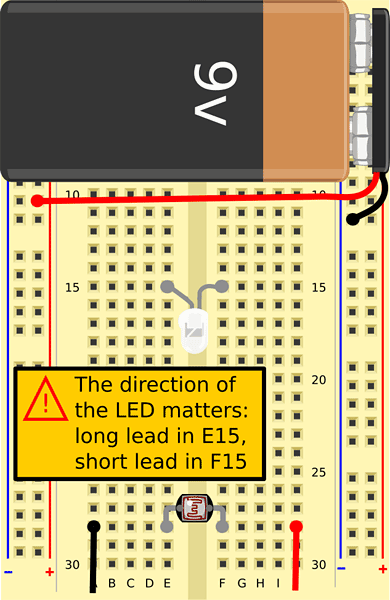
- It matters in which direction some of the components are facing. Make sure you read the slideshow captions for any special notes about inserting each part.
- This section only shows you how to assemble the circuit. For a detailed explanation of how the circuit works, see the Help section.
/-/https/www.sciencebuddies.org/cdn/Files/7884/14/slideshow-11-colorimeter.png)
/-/https/www.sciencebuddies.org/cdn/Files/7834/24/slideshow-1-colorimeter.png)
/-/https/www.sciencebuddies.org/cdn/Files/7836/23/slideshow-2-colorimeter.png)
/-/https/www.sciencebuddies.org/cdn/Files/7837/23/slideshow-3-colorimeter.png)
/-/https/www.sciencebuddies.org/cdn/Files/7838/23/slideshow-4-colorimeter.png)
/-/https/www.sciencebuddies.org/cdn/Files/7839/24/slideshow-5-colorimeter.png)
/-/https/www.sciencebuddies.org/cdn/Files/7840/23/slideshow-6-colorimeter.png)
/-/https/www.sciencebuddies.org/cdn/Files/7841/23/slideshow-7-colorimeter.png)
/-/https/www.sciencebuddies.org/cdn/Files/7842/26/slideshow-8-colorimeter.png)
/-/https/www.sciencebuddies.org/cdn/Files/7843/27/slideshow-9-colorimeter.png)
/-/https/www.sciencebuddies.org/cdn/Files/7844/23/slideshow-10-colorimeter.png)
Slideshow with step-by-step instructions viewable online.
| Part name | Picture | Breadboard Symbol | Location |
|---|---|---|---|
| 9 V battery | /-/https/www.sciencebuddies.org/cdn/Files/7852/34/9V-battery.jpg) |
/-/https/www.sciencebuddies.org/cdn/Files/7853/33/BB-battery.jpg) |
Red wire to (+) bus Black wire to (-) bus |
| Photoresistor | /-/https/www.sciencebuddies.org/cdn/Files/7854/33/photoresistor.jpg) |
/-/https/www.sciencebuddies.org/cdn/Files/7855/36/BB-photoresistor.png) |
E28, F28 |
| White LED | /-/https/www.sciencebuddies.org/cdn/Files/7856/34/white-LED.png) |
/-/https/www.sciencebuddies.org/cdn/Files/7857/43/BB-LED.png) |
Long lead to E15 Short lead to F15 |
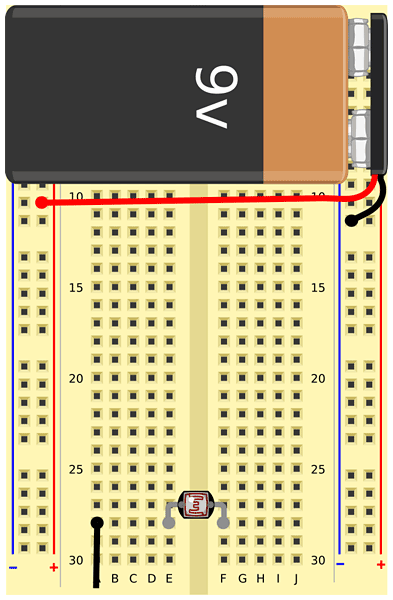
| Jumper wires (3) | /-/https/www.sciencebuddies.org/cdn/Files/7883/32/jumper-wire-black.png) |
/-/https/www.sciencebuddies.org/cdn/Files/7859/35/BB-jumper-wire-black.png) |
A28 to multimeter J28 to multimeter B15 to (+) bus |
| 220 Ω resistor | /-/https/www.sciencebuddies.org/cdn/Files/7220/16/220-resistor-picture.jpg) |
/-/https/www.sciencebuddies.org/cdn/Files/7861/32/BB-resistor.png) |
H15 to (-) bus |
Table 1. Components for the spectrophotometer circuit (Image credits: Jameco and Fritzing).
After you have finished building your circuit, testing the spectrophotometer is necessary to ensure that all the electronic components are connected correctly and your device works as expected.
- Place one empty cuvette, upside-down, over the LED; and another empty, upside-down cuvette over the photoresistor. If the cuvettes are not clear on all sides, but have two grooved or frosted sides, make sure that you put the clear side facing toward the LED as well as the photoresistor. Bend the LED and photoresistor as needed to fit underneath the cuvettes.
- Place two empty cuvettes between the LED and the photoresistor. Again, make sure that you always face the clear sides of the cuvette toward the LED and the photoresistor. The four cuvettes should touch each other and form a straight line. You can use clear tape to hold the cuvettes over the LED and the photoresistor in place. But do not block the light path!
- The light from the LED should now shine directly onto the photoresistor, as shown in Figure 4. Bend the wires on the LED and photoresistor for adjustment, if needed.
/-/https/www.sciencebuddies.org/cdn/Files/7848/24/LED-photoresistor-alignment.jpg)
Figure 4. Make sure that the LED and the photoresistor are properly aligned. Note that in this picture, the cuvettes are not yet placed on top of the photoresistor and LED.
- Set up the multimeter to measure the resistance of the photoresistor.
- Plug the black multimeter probe into the port labeled COM.
- Plug the red multimeter probe into the port labeled VΩmA.
- Turn the dial setting to 200 ohms (Ω).
- Turn the power switch to ON.
- Use alligator clips to attach the red and black multimeter probes to the red and black jumper wires connected to the photoresistor coming from A28 and J28.
- Turn on the LED by connecting the jumper wire from B15 to the power (+) bus.
- Cover the circuit (but not the multimeter) with the cardboard box to block ambient light.
- Read the resistance across the photoresistor and record it in your lab notebook.
- Note the units of the resistance. A "k" indicates kilo-ohms (kΩ) and an "M" indicates mega-ohms (MΩ).
- If your multimeter screen displays a "1 .", that means the resistance is too high for the dial setting. Turn the dial up to the next highest range (for example, from 200 to 2000) and check again.
- If this is your first time using a multimeter, refer to the Science Buddies resource How to Use a Multimeter, specifically the section How do I measure resistance?, to learn more.
/-/https/i.ytimg.com/vi/ts0EVc9vXcs/maxresdefault.jpg)
- Remove the box and turn off the LED by removing the jumper wire from the power (+) bus.
- Cover the circuit with the box again. In the dark, the resistance should be in the mega-ohm range. Remember that you may need to adjust the dial setting to get a measurement. Record the resistance in your lab notebook. Note: Stray light will cause problems with the data. Perform the readings in a dimly lit room if stray light is a problem and/or use a black permanent marker to shield the photoresistor from light from the sides and back of the cuvette.
- Remove the box and turn off the multimeter to conserve battery power.
Part 2: Calibrating the Spectrophotometer
Now that you know that your spectrophotometer is working, the next step is to make the standard solutions to calibrate it. You will make a series of dilutions of blue dye, as shown in Figure 5, with known concentrations, and measure them with your spectrophotometer to create a calibration curve. Each dilution is made by consecutively diluting your solution by half. It is essential to use dye-free utensils and cups to get an accurate set of standards.
/-/https/www.sciencebuddies.org/cdn/Files/7849/14/standards-with-cuvettes.jpg)
Figure 5. Standard solutions of Blue 1 for creating the calibration curve.
- Set out eight clean cups and label them 1–8.
- The solutions will be diluted as follows:
- 1 (most concentrated)
- 1/2
- 1/4
- 1/8
- 1/16
- 1/32
- 1/64
- Water only
- Pour 8 oz. of water into the first cup (#1) and 4 oz. of water into the remaining cups (2–8).
- Mix 1/8 teaspoon (tsp.) of blue dye with the 8 oz. of water in cup #1. Note: The concentration of blue dye in the commercial package is approximately 0.026 M (mol/L). After dilution (1/8 tsp in 1 cup = 1:384), the concentration is 68 µM (µmol/L).
- Stir the contents of cup #1 with a clean spoon.
- Using the measuring cup, pour 4 oz. from cup #1 into cup #2 and mix with a clean spoon.
- Thoroughly rinse the measuring cup and spoon and mix 4 oz. from cup #2 with the water in cup #3.
- Repeat the two-fold dilutions for cups 4–7. Cup #8 will be your "blank," and should not contain any dye.
- Transfer the blank and the standard solutions into eight clean and labeled cuvettes. Use the eyedropper, a transfer pipette, or pour carefully. Note: The cuvettes hold approximately 3 mL of solution.
- Prepare your orange absorption filter by adding 120 mL or 1/2 cup of water into a clean cup. Add two drops of red and two drops of yellow liquid food coloring and mix the solution well with a clean spoon.
- Transfer the orange solution into a clean cuvette and place the cuvette next to the LED so that the clear sides face the LED and the photoresistor.
- Attach the red and black multimeter probes to the red and black wires in contact with the photoresistor (coming from A28 and J28) using the cables with the alligator clips, if they are not yet connected.
- Set the multimeter to read resistance again. Remember that you might have to adjust the range as you take different readings.
- First, place your blank sample without dye in between the orange cuvette and the photoresistor, as shown in Figure 6. Again, the clear sides of the cuvettes should face toward the LED and the photoresistor.
/-/https/www.sciencebuddies.org/cdn/Files/7850/20/measuring-setup-calorimeter.jpg)
Figure 6. Spectrophotometer setup for measuring your blank (left), standard, and samples (right). Note that in these pictures, the LED is not yet switched on. For your measurements, you also have to cover the spectrophotometer with a cardboard box to block out surrounding light.
- Plug in the wire to turn on the LED and cover the breadboard with a small cardboard box. Read the resistance on the multimeter and record the data in your lab notebook.
- Remove the blank cuvette and replace it with the cuvette containing the next standard solution, starting with the lowest concentration. Cover the breadboard again with the cardboard box and write down the resistance for this solution. Continue the measurements for each of your seven standards.
- Repeat steps 14–16 with the entire set of standards, including the blank, two more times.
- Make a data table in your lab notebook, showing the dilutions and the concentrations of blue dye in all your standards (#1 = 68 µM, #2 = 34 µM, etcetera) together with all three recorded resistance measurements for each solution. The resistance should be higher as the solutions get darker.
Part 3: Measuring Your Sports Drink Samples
You are now ready to take readings from your spectrophotometer with real sports drink samples.
- Start with a visual evaluation of each of your blue beverages. Which one do you think contains the most amount of blue dye? Write down your assumptions in your lab notebook.
- Label as many clean cuvettes as you have sports drinks that you would like to test. Make sure the label is explicit for each drink.
- Using the clean eyedropper or a transfer pipette, fill each clean cuvette with one of the blue-colored beverages, such as in Figure 7.
/-/https/www.sciencebuddies.org/cdn/Files/7851/17/sports-drinks-cuvettes.jpg)
Figure 7. Several sports drink samples with unknown concentrations of Blue 1 prepared for measurement on the spectrophotometer.
- Check that your spectrophotometer setup is still in measuring mode with the leads attached to the multimeter, and both the LED and multimeter switched on. Place the cuvette with the orange solution next to the LED if it is not already there.
- Place one of your sports drink samples on the device in between the orange filter solution and the photoresistor. The clear sides of the cuvette need to face the LED and the photoresistor.
- Cover the spectrophotometer with the cardboard box and record the resistance on the multimeter in your lab notebook. Note: If the resistance of your solution exceeds the maximum resistance of your calibration curve, dilute your sample and measure again. You can do a 1:2 dilution in a fresh cuvette (1.5 mL water + 1.5 mL sample solution) or a 1:6 dilution (2.5 mL water + 0.5 mL sample solution).
- Measure your sample two more times.
- Continue measuring all your sports drink samples on the spectrophotometer and record the resistance for each in your lab notebook. Be sure to measure each sample a total of three times.
Analyzing Your Results
- Open a spreadsheet and enter the resistance data for your calibration curve. Calculate the average for your three resistance readings for each standard. Subtract the resistance that you measured for the blank from all of the readings you made for samples with dye. This step subtracts the light loss due to the plastic, the water, and other factors.
- Graph the average resistance of your three readings on the y-axis versus the concentration of the standard solutions in µM on the x-axis. Note: If you are using Microsoft Excel, use the "Scatterplot" chart. Excel also has tools for adding trend lines.
- More-advanced students can add a trend line to the data and display its equation and its correlation factor R2.
- Graph the average resistance of each of your blue beverages on the chart.
- Determine the concentration of blue dye in your sports drink samples, based on where they are on the graph or use your calibration curve to calculate the concentration of blue dye in your blue beverages. Remember to account for your dilutions if a sample had to be diluted.
- Which of the beverages had the highest concentration of blue dye? Do your results agree with your visual evaluation of the sports drinks?
Troubleshooting
For troubleshooting tips, please read our FAQ: How Blue is Your Sports Drink?.
Ask an Expert
Global Goals
The United Nations Sustainable Development Goals (UNSDGs) are a blueprint to achieve a better and more sustainable future for all.
/-/https/www.sciencebuddies.org/cdn/Files/19752/5/E-WEB-Goal-09.png)
Variations
- Repeat the procedure, but replace the orange filter with water. Do you see a difference in the sensitivity?
- Repeat the procedure to determine the concentration of red food coloring in various drinks using a blue-green dye filter.
- Try to analyze the concentration of red and blue dye in a purple sports drink. Use colored water filters to isolate absorption due to the red dye from that due to the blue dye, and vice versa.
- Assuming that the molar absorption coefficient is 100,000 L/(mol × cm), calculate how the absorbance (A) is related to the resistance.
Frequently Asked Questions (FAQ)
/-/https/www.sciencebuddies.org/cdn/Files/8189/20/photoresistor-LED-circuit-diagram.png)
Figure 8. Circuit diagram for the circuit used in this project.
Careers
If you like this project, you might enjoy exploring these related careers:
/-/https/careerdiscovery.sciencebuddies.org/cdn/Files/1223/17/iStock-971549326.jpg)
/-/https/careerdiscovery.sciencebuddies.org/cdn/Files/1107/19/pexels-photo-3938023.jpg)
/-/https/careerdiscovery.sciencebuddies.org/cdn/Files/1640/26/Fyysikot_tyossaan.jpg)
/-/https/careerdiscovery.sciencebuddies.org/cdn/Files/1316/17/unsplash-ePJQise0OkQ.jpg)
Contact Us
Our kits are developed in partnership with Home Science Tools®. If you have purchased a kit for this project, Home Science Tools® is pleased to answer any questions not addressed by the FAQ above.In your email, please follow these instructions:
- Include your Home Science Tools® order number.
- Please describe how you need help as thoroughly as possible:
Examples
Good Question I'm trying to do Experimental Procedure step #5, "Scrape the insulation from the wire. . ." How do I know when I've scraped enough?
Good Question I'm at Experimental Procedure step #7, "Move the magnet back and forth . . ." and the LED is not lighting up.
Bad Question I don't understand the instructions. Help!
Good Question I am purchasing my materials. Can I substitute a 1N34 diode for the 1N25 diode called for in the material list?
Bad Question Can I use a different part?
Contact Support

/-/https/img.youtube.com/vi/wlVZBXvYgiY/0.jpg)
/-/https/img.youtube.com/vi/FxjXrCyic6o/0.jpg)
/-/https/img.youtube.com/vi/rzEYT7V-yUk/0.jpg)