Abstract
Do you filter your tap water before drinking? Many commercials claim these filters make your drinking water cleaner and safer. But what, exactly, are these filters doing, and is the water really cleaner afterward? The cleaning power comes from their filtering material, called activated carbon. It exists in various forms: powder, granules, foams, and blocks. Do you think it matters what type of activated carbon is inside the filter? In this project, you will investigate whether larger or smaller particles of activated carbon work better for cleaning drinking water—with results you can see!
Summary
None
A kit for this project is available from our partner Home Science Tools®. See the Materials section for details.
Avoid dispersing the powdered activated carbon into the air and try not to breathe in the particles. Avoid dispersing the powdered activated carbon into the air and try not to breathe in the particles. Do not drink the water (filtered or unfiltered) as it may contain ink and/or carbon and could make you sick.
Alex Andres, Laboratory Assistant, UC CEIN
Courtney R. Thomas, PhD, Education Coordinator, UC CEIN
Catherine Nameth, PhD, Former Education Coordinator, UC CEIN
This science project is a collaboration between Science Buddies and the Education Division of California (UC) Center for Environmental Implications of Nanotechnology (CEIN).
/-/https/www.sciencebuddies.org/cdn/Files/20800/6/SB-CHARFILT_CupPour.jpg)
Objective
Investigate how the particle size of activated carbon affects drinking water filtration efficiency.
Introduction
Clean water is an essential part of life. Just think about how often you use water every day—for cooking, drinking, washing your clothes and dishes, brushing your teeth, or showering. You wouldn't want to do this with dirty water, right? Filtration is one important step in water cleanup. During the filtration process, particles or impurities such as chemicals and bacteria are separated from the solution that is filtered. The method of separation can be mechanical, physical, chemical, or even biological. To find out how water filters work, it is probably best to have a look inside the filter. Most of the filters that are used for home water treatment are carbon filters. The material inside is a special form of carbon called activated carbon or activated charcoal, which is shown in Figure 1.
/-/https/www.sciencebuddies.org/cdn/Files/8493/10/activated-carbon.jpg)
Figure 1. Activated carbon in powder and block form.
What makes activated carbon special is that it is a very porous form of carbon—almost like a sponge. It has many tiny microscopic pores that can soak up water or gases. Also, the surface of activated charcoal is not smooth. If you look under the microscope, you will see that the particles have a very crumbly shape, as shown in Figure 2. All these little micropores, together with its rough surface, create a huge surface area for each particle. Five teaspoons (10 grams) of granular activated carbon has a surface area that is approximately the area of a football field!
/-/https/www.sciencebuddies.org/cdn/Files/8494/10/activated-charcoal-powder-bright-field.jpg)
Figure 2. Activated charcoal particles are viewed under a microscope (each particle is about 0.1 mm wide). The crumbly particle structure and shape result in a large surface area for each particle.
This massive surface area gives activated carbon unique properties. When water or liquid travels through the porous structure of the filter, impurities (such as small amounts of chemicals or metals) can be removed by a process called adsorption. Adsorption occurs when compounds physically or chemically adhere to the carbon surface. Physical or chemical trapping happens due to van der Waals forces, weak forces that exist between molecules or particles that can be attractive or repulsive, as well as to chemical bonding on the carbon surface. This is why the surface area, or the surface area to volume ratio, of the activated carbon matters. The more surface area (area exposed to the surroundings), the more possible bonding sites there are for contaminants. If all the bonding sites are taken up, then the impurities remain in the water, and it is time to replace your water filter.
Activated charcoal can come in many forms and particle sizes (some of them are shown in Figure 1). The two types you will be using in this experiment are the granular and powdered forms. Granular carbon can be compared to small pebbles, while powdered carbon can be compared to fine sand. Looking at Figure 3, you can think of the left cube as the granulated carbon and the smaller cubes as the powdered carbon. They both have the same volume (a total of 8 small cubes), but the surface area exposed to the surrounding is much larger with the 8 individual cubes compared to the one large cube. Therefore, the granular form has a smaller surface area to volume ratio than the powder form.
/-/https/www.sciencebuddies.org/cdn/Files/8496/10/surface-area-comparison.jpg)
Figure 3. Although both the cube on the left, and the 8 individual small cubes on the right, have the same volume, the total surface area is much higher for the smaller cubes than the large one. This means smaller particles have a higher surface area to volume ratio than bigger particles.
Besides the surface area to volume ratio, the time the water spends in contact with the activated carbon is also an important factor that determines the efficiency of the filtration process. The longer the contact time or the slower the flow rate of the water through the filter, the more adsorption can take place. You will see for yourself in this project when you clean up colored tap water with activated carbon. Which material do you think will be better to clean up your water, powdered or granular carbon?
Terms and Concepts
- Filtration
- Carbon filter
- Activated carbon, or activated charcoal
- Surface area
- Adsorption
- Van der Waals forces
- Surface area to volume ratio
- Particle size
- Contact time
Questions
- What are typical uses of activated carbon?
- Why does the form of activated carbon and its particle size matter for filtration?
- How do carbon filters clean contaminated drinking water?
- Can you think of other processes or reactions in which the particle size or surface area to volume ratio matters?
Bibliography
- Science News. (2006, November 8). Activated-Carbon Filtering Pitcher Significantly Reduces Chemicals in Tap Water. Science Daily. Retrieved January 17, 2017.
- Lemley A., Wagenet L., Kneen B. (1995, December 3). Activated Carbon Treatment of Drinking Water. Water Treatment Notes, Cornell Cooperative Extension, College of Human Ecology. Retrieved January 17, 2017.
For help creating graphs, try this website:
- National Center for Education Statistics, (n.d.). Create a Graph. Retrieved June 25, 2020.
Materials and Equipment 
Recommended Project Supplies
/-/https/www.sciencebuddies.org/cdn/Files/20897/4/SB_CHARFILT__75082.jpg)
-
Charcoal Water Filter Kit, available from our partner Home Science Tools®.
You will need the following supplies from the kit:
- Ink, 10%, 30 mL (note: ink color may differ from what is shown in pictures)
- Charcoal Granular, activated, 30 g
- Charcoal Powder, activated, 30 g
- Coffee filters
- Digital scale
- Marker
- Measuring cup
- Plastic cups
- Rubber bands
- Additional supplies you will need include:
- Spoon
- Tap water
- Timer
- Paper towels
- Optional: Camera (phone or digital)
- Lab notebook
Disclaimer: Science Buddies participates in affiliate programs with Home Science Tools®, Amazon.com, Carolina Biological, and Jameco Electronics. Proceeds from the affiliate programs help support Science Buddies, a 501(c)(3) public charity, and keep our resources free for everyone. Our top priority is student learning. If you have any comments (positive or negative) related to purchases you've made for science projects from recommendations on our site, please let us know. Write to us at [email protected].
Experimental Procedure
In this experiment, you will filter 3 different water samples with varying amounts of a “contaminant” (ink) using 3 different types of filtration: granular activated carbon, powdered activated carbon, and no carbon. After filtering, you will compare the water samples to see how well each filter removed the ink.
Preparing Your Samples and Filters
In this experiment, you will test 3 levels of water contamination samples with 3 different filter conditions for a total of 9 tests. In this section, you will prepare a total of 27 cups to get ready for experimentation. Ultimately, you will need to do 3 trials of the experiment. You can clean and reuse the 27 cups for each trial, or prepare new cups.
-
Prepare water samples: You will prepare 3 different water samples, each with a different ink concentration or ‘contamination’ level. These samples will be used to test the effectiveness of 3 different filters, so you will have 9 cups at the end of this step. See Figure 4 below for what these will look like when this step is complete.
-
Label your cups: With a permanent marker, label 3 cups, one for each ink concentration:
-
0 drops of ink
-
15 drops of ink
-
30 drops of ink
-
-
Measure water into each cup: Using a measuring cup, pour 12 ounces (oz) of tap water into each labeled cup.
-
Add ink to the water:
-
For the "0 drops of ink" cup, no ink is added.
-
For the "15 drops of ink" cup, add 15 drops of ink.
-
For the "30 drops of ink" cup, add 30 drops of ink.
-
-
Mix the ink and the water: Stir each solution thoroughly with a clean spoon to make sure the ink is evenly mixed.
-
Divide water samples into 3 test groups: You will test each water sample with 3 filter types: no activated carbon, granular activated carbon, and powdered activated carbon.
-
Label 9 cups using the following labels:
-
3 x ‘No ink’
-
3 x ‘15 drops ink’
-
3 x ‘30 drops ink’
-
- Divide your 12 oz water samples so there is 4 oz of water in each of the corresponding cups.
Figure 4. Prepared water samples with different concentrations of ink for the carbon filtration experiment (from left to right: 0 drops of ink per 12 oz of water, 15 drops of ink per 12 oz of water, and 30 drops of ink per 12 oz of water). Note that samples are mixed in a single cup with 12 oz of water and then distributed between 3 cups, each with 4 oz of the water sample. Note: your ink color may differ from what is shown in the picture.
-
-
-
Prepare activated carbon: Next, prepare the activated carbon for your filters. You will test 3 different experimental conditions (granular activated carbon, powdered activated carbon, and no activated carbon) for each of the ink concentrations, so you will prepare a total of 9 cups. See Figure 5 below for what your cups will look like when you are done with this step. Note that you are not adding any water/ink to cups in this step!
-
Label 9 Cups: For this step, you will need 9 cups. Label the cups to indicate both the type of carbon and the ink concentration. You can use abbreviations, for example:
-
GC - no ink, GC - 15 drops ink, GC - 30 drops ink
-
PC - no ink, PC - 15 drops ink, PC - 30 drops ink
-
NC - no ink, NC - 15 drops ink, NC - 30 drops ink
-
-
Add Activated Carbon to the Cups: Add 3 grams (g) of the appropriate type of carbon to each cup as outlined below. You can do this by putting the cup on the scale, pushing the ‘Tare’ button (this zeros out the scale) and using a spoon to carefully add the carbon until it reaches 3 g.
-
Weigh out 3 grams (g) of granular activated carbon and place it in each of the cups labeled GC.
-
Weigh out 3 grams (g) of powdered activated carbon and place it in each of the cups labeled PC.
-
The cups labeled NC (no carbon) should remain empty.
-
Note: Avoid breathing in the activated carbon powder and try not to disperse too much of the powder into the air.
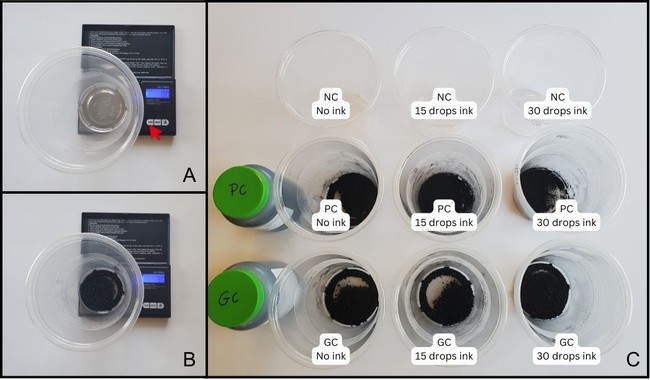
Figure 5. Prepared activated carbon conditions for each ink concentration. A: Place the cup on the scale and press ‘Tare’ to zero it out. B: Add 3 g of activated carbon to each activated carbon cup. C: Top row - cups with no activated carbon; Middle row - cups with powdered activated carbon; Bottom row - cups with granular activated carbon.
-
-
-
Prepare filters: Next, you will set up filters for the different forms of activated carbon and ink concentrations. You will test 3 different experimental conditions (granular activated carbon, powdered activated carbon, and no activated carbon) for each of the ink concentrations, so you will prepare a total of 9 cups. See Figure 6 below for what your cups will look like when you are done with this step.
-
Label 9 cups in total, one for each testing condition. Again, make sure that your label is specific to the type of activated carbon and the ink concentration that you are going to test. At the end, you should have 9 cups with the following labels:
-
GC - No ink; GC - 15 drops ink; GC - 30 drops ink
-
PC - No ink; PC - 15 drops ink; PC - 30 drops ink
-
NC - No ink; NC - 15 drops ink; NC - 30 drops ink
-
-
Take 4 coffee filters and stack them. As shown in Figure 6, press the stack of filters into the top of a cup, fold their edges over the cup's rim, and secure them with a rubber band.
-
Repeat step b. for the remaining filtration cups.
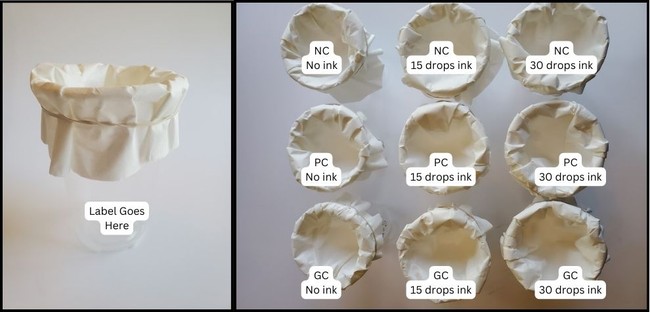
Figure 6. Using 4 layers of coffee filter, prepare a basket-shaped filter inside each filtration cup and secure it with a rubber band.
-
-
Prepare for testing: You should now have 27 total cups ready for testing (see Figure 7 below):
-
9 cups with water samples (prepared in Step 1)
-
9 cups with charcoal (prepared in Step 2)
-
9 cups with filter baskets (prepared in Step 3).
-
/-/https/www.sciencebuddies.org/cdn/Files/20795/5/Figure4_InkConcentrations.jpg)
/-/https/www.sciencebuddies.org/cdn/Files/20796/5/Figure5_ActivatedCarbonConditions.jpg)
/-/https/www.sciencebuddies.org/cdn/Files/20797/5/Figure6_Filters.jpg)
Filtering Your Samples
- Arrange all your prepared cups as shown in Figure 7, but don't mix anything together yet!

Figure 7. Setup of 27 prepared cups for 1 trial of the experiment. During experimentation, water samples are poured into the activated carbon cups, stirred, and then allowed to sit for 10 minutes before being poured over the corresponding filter cup. - Before you start with your filtration experiment, prepare a data table similar to Table 1 in your lab notebook.
/-/https/www.sciencebuddies.org/cdn/Files/20798/5/Figure7_FilterExperimentSteps.jpg)
| Water sample color rating after treatment (0-10) | ||||||
|---|---|---|---|---|---|---|
| Activated Carbon Type NC = no carbon PC = powdered carbon GC = granular carbon |
Water sample ink concentration | Water sample color rating before treatment (0-10) | Trial 1 | Trial 2 | Trial 3 | Average |
| NC | No ink | |||||
| PC | No ink | |||||
| GC | No ink | |||||
| NC | 15 drops ink | |||||
| PC | 15 drops ink | |||||
| GC | 15 drops ink | |||||
| NC | 30 drops ink | |||||
| PC | 30 drops ink | |||||
| GC | 30 drops ink | |||||
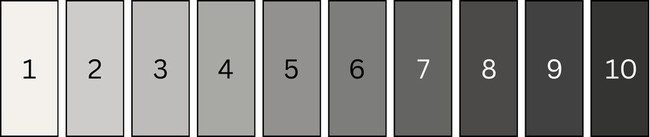
- You will rate the color of your water samples on a scale from 0–10, where 0 is totally clear and 10 is the darkest. Assess all your water samples before the filtration. Within a specific ink concentration, they should all look the same. You can use the scale in Figure 8 below to help you. Document the pre-filtration colors in the 'Water sample color rating before treatment (0-10)' column of your data table.
Figure 8. A color scale to rate water samples before and after filtration.
-
If you have a camera available, take a photo of all your solutions before starting the filtration. This will be helpful for your display board and to compare your water samples to after you finish filtering them. Make sure that all the pictures are taken with the same lighting, background, and camera settings (it is probably best to use a white background) so you can compare them to each other.
-
Now it’s time to start filtering! As shown in Figure 7, you will pour each water sample into the corresponding carbon cup, mix it, and wait at least 10 minutes. Then, you will pour the water sample-carbon mixture over the prepared coffee filter basket. We recommend doing a maximum of 3 cups (1 row) at a time to make sure you keep the time between mixing, stirring, and pouring as consistent as possible.
-
Start with the filtration experiment using the no-ink water samples.
-
Pour each cup of no-ink water into the respective cups containing the activated carbon (GC, PC, and NC) that you prepared in step 2 of "Preparing Your Samples and Filters."
-
Set your timer to 10 minutes and quickly stir each solution using a clean spoon. Note: you may get better results if you wait more than 10 minutes, so you can wait longer if you have time.
-
After at least 10 minutes, pour the water and carbon mixture into the filters that you prepared in step 3 of "Preparing Your Samples and Filters," and let the water seep through the filters.
-
-
Repeat the steps a.i.- a.iii. above for the 15 drop ink water samples and 30 drop ink water samples. Make sure you run each trial for the same amount of time.
-
-
Rate each filtered water sample using the same scale you used in Step 1 with the pre-filtered samples and record each rating in your data table. Did any of the water samples change color? Do you observe a difference depending on ink concentration or type of activated carbon? Note: Make sure that the water drains out of the filters completely and collects in the cup below the filter before rating your samples. There should not be any water remaining in the filter.
-
If you have a camera available, take a photo of all the solutions that you collected in the filtration cups after the filtration experiment. Again, this will be helpful for your display board, and you can compare it to your pre-filtered samples. Make sure that all the pictures are taken with the same lighting, background, and camera settings that you used in step 6 (it is probably best to use a white background) so you can compare them to each other.
-
Once you have filled out your data for trial 1, set up and perform two more filtration trials, starting with "Preparing Your Samples and Filters." Responsible scientists always do their experiments at least 3 times to confirm that their results always show the same trend, meaning that they are reproducible.
/-/https/www.sciencebuddies.org/cdn/Files/20799/5/Figure8_ColorScale.jpg)
Analyzing Your Data
-
Calculate the average color rating for each test you did after treatment. To do this, for each of your samples, add the color values from each individual trial and then divide the result by 3. Write down the average in your data table.
-
Compare the average color values that you wrote down for each experimental condition before and after the filtration. Can you see a trend in your data? Did your water samples become less colored or even colorless after filtration? Did the filtration material or the ink concentration make a difference?
-
More advanced students can do more quantitative measurements of the water colors, using their pictures of the pre- and post-filtration samples and an online color picker tool. Looking at each of your filtered water samples, select the corresponding color from the color palette. The tool gives you color values for H (Hue), S (Saturation), B (Brightness), R (Red), G (Green), and B (Blue). Stay within the same Hue for your color assessment, and for each selected color write down the color saturation (S) and brightness (B) value. Calculate the average of your determined brightness and saturation values from the 3 trials for all your experiments. Note: With more lightly colored water samples, you should see an increasing value for brightness.
-
For each type of carbon (granular carbon, powdered carbon, and no activated carbon) make a bar graph comparing the observed color (either using the average color numbers or, for more advanced students, the average brightness values) before and after filtration. On the x-axis, put the ink concentration (0, 15, and 30 drops of ink), and on the y-axis graph the average color number (or, if you used the color picker tool, the average color brightness values) before and after the filtration process. You can either make a separate graph for each ink concentration or use one bar graph with different colors indicating the different ink concentrations. The Bibliography lists an online graphing tool that can help you create graphs.
-
If you chose to use the color picker tool, make another graph similar to that in step 4, but this time plot your average saturation values on the y-axis.
-
When using the color picker tool, remember that the higher your brightness values are, the clearer your water is. A higher saturation value means that the water is more colored. A saturation value of 0 with a brightness value of 100 means that your water is clear and has no color anymore!
-
Comparing all your graphs, can you tell if granular or powdered carbon is the more efficient filter using a contact time of 10 minutes? How do you think you can improve the efficiency of your filters?
Ask an Expert
Global Goals
The United Nations Sustainable Development Goals (UNSDGs) are a blueprint to achieve a better and more sustainable future for all.
/-/https/www.sciencebuddies.org/cdn/Files/19749/5/E-WEB-Goal-06.png)
Variations
- In this project, you used the same amount of activated carbon for each experimental condition. Do you think the results will change when you use more or less activated carbon? Repeat this experiment, but this time, vary the amount of activated carbon you put into your filters. You can either choose another amount of activated carbon for the different ink concentrations or keep the ink concentration constant and vary the amount of activated carbon instead.
- You may want to investigate how water filtration effectiveness depends on the contact time. Design an experiment in which you investigate the dependence of contact time on the filtration efficiency. Do a time series with different contact times for your water samples and activated carbon. You can also change the ink concentration in your water sample for these experiments if necessary.
- Can the activated carbon you used for your experiment be re-used for another water sample? After how many filtration steps did you reach the adsorption capacity of the carbon? Does it depend on the ink concentration of your water sample? Design an experiment to find out!
- What else can be filtered with activated carbon? Does food coloring give you the same results? Try separating other mixtures with your carbon filter such as a sand/soil and water mixture, or a mixture of oil and water. What about removing smells from your water sample, do you think you can filter out a vanilla or peppermint aroma?
- Besides contact time and particle size, what other parameters can influence the filtration efficiency of your water filter? Do you think the temperature of the water sample makes a difference? What about the pH of your water sample? Test your hypotheses by varying these parameters and see how clean your water gets each time!
- If you are interested in the environmental aspect of water filtration or using different filtration materials, check out the Science Buddies science project From Contaminated to Clean: How Filtering Can Clean Water.
Careers
If you like this project, you might enjoy exploring these related careers:
/-/https/careerdiscovery.sciencebuddies.org/cdn/Files/1107/19/pexels-photo-3938023.jpg)
/-/https/careerdiscovery.sciencebuddies.org/cdn/Files/20218/6/EnvEng_KeyPhoto.jpg)
/-/https/careerdiscovery.sciencebuddies.org/cdn/Files/1876/20/iStock-1188858196.jpg)
Contact Us
Our kits are developed in partnership with Home Science Tools®. If you have purchased a kit for this project, Home Science Tools® is pleased to answer any questions.In your email, please follow these instructions:
- Include your Home Science Tools® order number.
- Please describe how you need help as thoroughly as possible:
Examples
Good Question I'm trying to do Experimental Procedure step #5, "Scrape the insulation from the wire. . ." How do I know when I've scraped enough?
Good Question I'm at Experimental Procedure step #7, "Move the magnet back and forth . . ." and the LED is not lighting up.
Bad Question I don't understand the instructions. Help!
Good Question I am purchasing my materials. Can I substitute a 1N34 diode for the 1N25 diode called for in the material list?
Bad Question Can I use a different part?
Contact Support

/-/https/img.youtube.com/vi/WdCBoRW-J2I/0.jpg)
/-/https/img.youtube.com/vi/SBLFBsbbKa8/0.jpg)
/-/https/img.youtube.com/vi/SH3M1WZs7FM/0.jpg)