Abstract
Sunspot activity has been monitored continuously since about 1700. The historical data shows that sunspot activity rises and falls in a roughly 11-year cycle. This project shows you how you can use both graphical and statistical analysis to look for patterns in cyclical data.Summary
Andrew Olson, Ph.D., Science Buddies
Sources
- The idea for this project sprang from a discussion of the aspect ratio in statistical displays on page 25 in:
Tufte, E.R., 1997. Visual Explanations: Images and Quantities, Evidence and Narrative. Cheshire, CT: Graphics Press. - The original source which Tufte cites is:
Cleveland, W.S., 1994. The Elements of Graphing Data, revised edition. Murray Hill, NJ: AT&T Bell Laboratories, pp. 66 - 79. - Monthly sunspot data was obtained from:
Van der Linden, R.A.M. and the SIDC team, 1749-2006, Sunspot Index and Long-term Solar Observations , SIDC, Royal Observatory of Belgium. Retrieved February 20, 2006. - Galileo's sunspot drawing was reproduced, with permission, from Professor Owen Gingerich's copy of the first edition of Istoria e Dimostrazioni Intorno Alle Macchie Solari e Loro Accidenti Rome (History and Demonstrations Concerning Sunspots and their Properties, published 1613), and published online here:
Van Helden, A. and E. Burr, 1995. "Galileo's Sunspot Drawings," The Galileo Project, Rice University. Retrieved February 20, 2006.
/-/https/www.sciencebuddies.org/cdn/Files/2286/8/Astro_img058.gif)
Objective
Do sunspot cycles consistently have a faster rise time and a slower decay time? The goal of this project is to find out, using historical data and basic statistical analysis. As an added bonus, you'll learn the basics of working with a spreadsheet program.
Introduction
Sunspots were first discovered by Galileo Galilei in 1612. Galileo made regular observations of sunspots and was able to prove that he was seeing features on the surface of the sun, which moved as the sun rotated. (Another interesting project involving sunspots is to recreate Galileo's experiments using satellite imagery that you can collect online. See Using the Solar & Heliospheric Observatory Satellite (SOHO) to Determine the Rotation of the Sun.)
/-/https/www.sciencebuddies.org/cdn/Files/2285/5/Astro_img019.gif)
Figure 1. Reproduction of one of Galileo's sunspot drawings from his book on the subject, published in 1613.
What is a sunspot, anyway? The SOHO Explore Glossary defines a sunspot this way: "a temporary disturbed area in the solar photosphere that appears dark because it is cooler than the surrounding areas. Sunspots consist of concentrations of strong magnetic flux. They usually occur in pairs or groups of opposite polarity that move in unison across the face of the Sun as it rotates." (SOHO Explore Glossary, 2006)
To see what sunspots looks like, here are two images of the sun's photosphere, taken by the Solar and Heliospheric Observatory (a joint project of NASA and the European Space Agency). The one on the left was taken on November 15, 1999. The one on the right was taken on February 20, 2006.
/-/https/www.sciencebuddies.org/cdn/Files/2282/5/Astro_img016.gif)
/-/https/www.sciencebuddies.org/cdn/Files/2283/5/Astro_img017.gif)
Figure 2. Solar and Heliospheric Observatory (SOHO) Michelson Doppler Imager (MDI) intensitygrams, showing the brightness of the sun's photosphere in visible light. Dark areas are sunspots. White box indicates the region covered by high-resolution imager. The image on the left was taken on November 15, 1999. The image on the right was taken on February 20, 2006.
For more solar images, check out the SOHO links in the Bibliography. The EIT (Extreme ultraviolet Imaging Telescope) images show the sun's atmosphere for specific wavelengths in the ultraviolet region of the spectrum. For example, at 171 angstroms (one angstrom is one ten-billionth of a meter, or 10-10 m) the UV light is mostly emitted by Fe IX and X (iron ionized 8 or 9 times) at 1 million degrees Kelvin. Iron emissions provide visualization of the magnetic field lines. Here are two examples of these amazing images, corresponding to the same dates as the visible-light images:
/-/https/www.sciencebuddies.org/cdn/Files/2286/8/Astro_img058.gif)
/-/https/www.sciencebuddies.org/cdn/Files/2287/7/Astro_img059.gif)
Figure 3. Solar and Heliospheric Observatory (SOHO) Extreme ultraviolet Imaging Telescope images at 171 angstroms. The image on the left was taken on November 15, 1999. The image on the right was taken on February 20, 2006. Compare to visible light images from the same dates.
We've come a long way from Galileo's telescope in 1612! But as you'll see, there is still value in data from hundreds of years ago. We have annual data on sunspot numbers going back to 1700, and monthly data to 1749. The sunspot number for an observation is equal to the number of individual sunspots observed plus ten times the number of groups of sunspots observed. The reason for doing this is that viewing conditions are not always ideal, and an average group has about ten sunspots. This way, the data is reliable even when small spots are hard to visualize. The monthly sunspot number is the average of all the daily numbers for the month. Here are two graphs of the monthly data.
/-/https/www.sciencebuddies.org/cdn/Files/2284/3/Astro_img018.gif)
Graph of monthly sunspots visible on the sun for every month from the year 1749 to 2005. A smaller version of the same graph is reproduced underneath the main graph and highlights a pattern of rising and falling sunspot numbers at regular intervals.
Figure 4. Monthly sunspot number, 1749–2005, shown at two different vertical scales.
The data is the same in both graphs; it is just shown with two different vertical scales. It is obvious from both graphs that sunspot activity is cyclical, with the numbers regularly rising and falling. The tick marks on the horizontal axis are at 11-year intervals, the approximate length of the solar cycle. For example, if you compare the tick marks over the period from 1838 to 1893, you see that they fall at about the peak of each of those cycles.
The reason for showing two graphs is to show you that sometimes you can discover something new in your data just by looking at it differently. The top graph is how the data would appear with typical default settings of a graphing program. Typical default settings will produce a graph with an aspect ratio (horizontal length divided by vertical length) of about 1.6, and a y-axis scale chosen so that the data fills the graph region. These settings produce a reasonable-looking graph, and the cyclical nature of sunspot activity is readily apparent.
Compare the two graphs carefully, though, and see if the lower graph shows you anything more. The lower graph is made following an idea from William Cleveland. He used a computer algorithm to select an aspect ratio so that selected line segments in the data would have a slope of ±45° (Cleveland, 1994, cited in Tufte, 1997). In the upper graph, the sunspot cycles all rise and fall steeply. This makes it difficult for your eye to notice any subtle patterns in the cycles. Cleveland's idea is to select an aspect ratio so that the rising and falling slopes are closer to a ±45° angle, on average. Showing the data this way makes it much easier for your eye to see subtle patterns in the cycles. For example, compare the onset of each cycle to the decay. The onset time is the time from the beginning of the cycle to the maximum of the cycle. The decay time is the time from the maximum of the cycle to the end of the cycle. Are they about equal, or is one longer than the other? Which has a steeper slope? This comparison is much easier to make in the lower graph than in the upper one.
For some of the cycles, the onset time and decay time look fairly similar. For others, it appears that the onset time is shorter than the decay time. Is there a way to measure how strong the effect is? By answering these kinds of questions, we can get a better understanding of the solar physics underlying sunspots.
In this project, you will learn how to use basic statistical analysis of the historical data to test the hypothesis that sunspot cycles consistently have a faster rise time and a slower decay time. As an added bonus, you'll learn the basics of working with a spreadsheet program.
Terms and Concepts
To do this project, you should do research that enables you to understand the following statistical terms and concepts:
- Sunspots
- Parts of the sun:
- Core
- Radiative zone
- Convective zone
- Chromosphere
- Photosphere
- Corona
- Sunspot cycle
- Statistical terms:
- Population
- Sample
- Mean
- Standard deviation
- Variance
- Null hypothesis
- t-test
- Statistical significance
Bibliography
- Van Helden, A. and E. Burr, 1995. Galileo's Sunspot Drawings, The Galileo Project, Rice University. Retrieved February 20, 2006.
- Here are several links to the ESA/NASA SOHO site:
- The SOHO home page is:
ESA & NASA, 2006. SOHO Home Page, European Space Agency and NASA. Retrieved February 20, 2006. - For background information on the Solar and Heliospheric Observatory, see:
ESA & NASA, 2006. SOHO Explore, European Space Agency and NASA. Retrieved February 20, 2006. - For a glossary of solar terms, see:
ESA & NASA, 2006. SOHO Glossary, European Space Agency and NASA. Retrieved June 23, 2020.
- The SOHO home page is:
- Hathaway, D.H., 2005. The Sunspot Cycle, NASA Science Directorate, Marshall Space Flight Center. Retrieved February 20, 2006.
- Historical sunspot data is available from:
Van der Linden, R.A.M. and the SIDC team, 2006, Online Catalogue of the Sunspot Index, SIDC, Royal Observatory of Belgium. Retrieved February 20, 2006. - Here is an Excel tutorial to get you started with using a spreadsheet program:
Excel Easy. (n.d.). Excel Easy: #1 Excel tutorial on the net. Retrieved March 10, 2014. - This website has descriptions and calculators for several statistical tests, including the paired t-test that you'll use in this project:
Kirkman, T., date unknown. "Student's t-Tests," Department of Physics, College of St. Benedict & St. John's University. Retrieved February 23, 2006.
Materials and Equipment
To do this experiment you will need the following materials and equipment:
- Computer with Internet access and a spreadsheet program.
Experimental Procedure
- Do your background research so that you are knowledgeable about the terms and concepts.
- If you are not familiar with using a spreadsheet program, be sure to take the time to go through the Excel tutorial listed in the Bibliography.
- Here is a short version of the data analysis steps you'll be following in order to test the hypothesis that the sunspot cycle onset times are faster than the decay times. The links following each step will jump you to the detailed instructions for that step. You can use your browser's "Back" button to return to these brief instructions.
- Import the historical data into Excel. (Downloading and Importing Data)
- Graph the data so that you can identify the approximate beginning and end of each cycle. (Graph the Data)
- From the spreadsheet data, identify the beginning, end, and maximum of each cycle. Make a table of these values. (Extracting the Cycle Data)
- Use the spreadsheet functions to calculate the onset time and decay time for each cycle. Also, calculate the difference between onset time and decay time for each cycle. (Calculating Onset Time and Decay Time)
- Compare the results. Is there a difference between onset time and decay time? Is the difference statistically significant? You will be using a "paired t-test" for this calculation. The t-test tells you how confident you can be that your results are not simply due to random chance. You can use the t-test calculator given in the Bibliography, or you can put the formula in your spreadsheet, if you know it. (Testing for Statistical Significance)
- If spreadsheets are something new for you, then the detailed explanations that follow should help. If you are already comfortable with using spreadsheets, then you should be in good shape on your own.
Downloading and Importing Data
Note: the spreadsheet details provided are based on Microsoft Excel 2003. For other versions of Excel, or other spreadsheets, you can use the instructions here as a guideline and consult the help function of your spreadsheet program for more specifics.
- Download the tables of historical sunspot numbers from this Sunspot Numbers page. There are two separate files for monthly sunspot numbers and smoothed montly sunspot numbers. You could also choose to work with the daily or yearly data.
- The "Info" button next to each file explains the format of the data files. Note: as of 2015, the files have been updated to include additional data that is not shown in the screenshots below. Make sure you read the Info page and understand what the data columns represent in each file.
- Import the sunspot data into your spreadsheet program. Here's how to do it in Excel:
- From the menu, select File/Open.... You'll see a dialog:
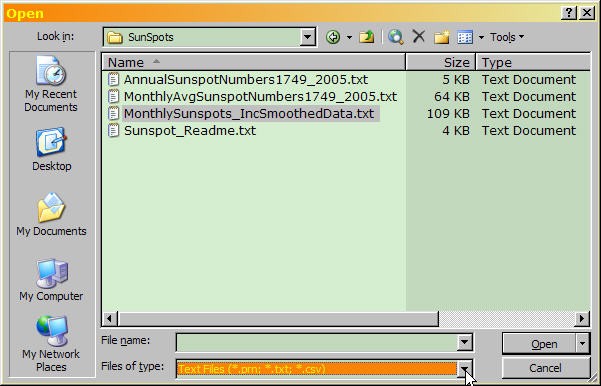
A cropped screenshot of the open file dialog window in Microsoft Excel shows a file explorer window where a file from the computer can be opened in the program. At the bottom of the window, text files are selected from a drop-down menu, and the file related to monthly sunspot data is selected.
- At the bottom of the File Open dialog, under "Files of type:" use the drop-down list to select "Text Files (*.prn, *.txt, *.csv)".
- Navigate to the directory where you saved your sunspot file, select it, and click "Open."
- Excel now takes you through the "Text Import Wizard," a series of three dialogs. The first dialog looks like this (monthly sunspot data file shown):
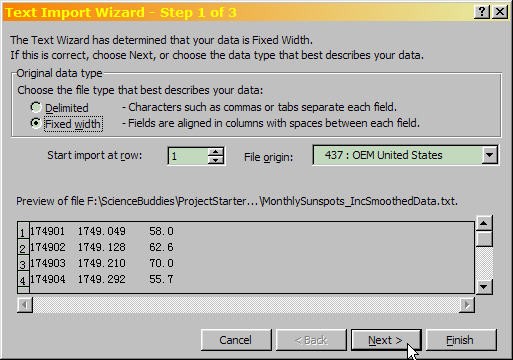
A cropped screenshot of the text import dialog window in Microsoft Excel shows the first step to importing text files. The dialog window includes delimited and fixed width options for the original data type. In this screenshot, fixed width is selected before continuing to the next step.
- Make sure "Fixed width" file type is selected, then click "Next."
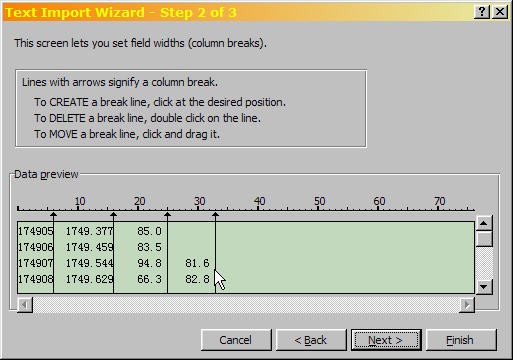
- The second Text Import Wizard dialog is used to set the field widths. It looks like this:
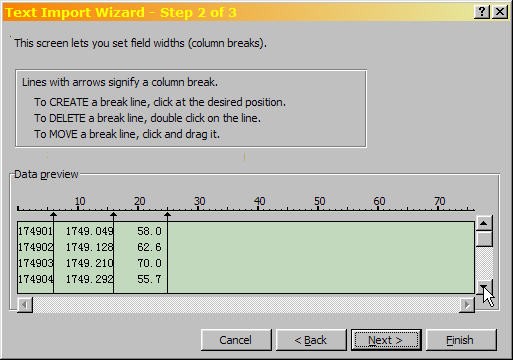
A cropped screenshot of the text import dialog window in Microsoft Excel shows the second step to importing text files. A table near the bottom of the dialog window shows a preview of data in a table with columns that separate the data.
- For the yearly sunspot data file, you can accept the defaults (skip down to step 3j).
- For the monthly sunspot data file, there is a fourth column of numbers, which starts at the seventh row. (This is the monthly smoothed sunspot number, which is a running average of the preceeding and following six months.) Use the arrow to scroll down to row seven, as shown:
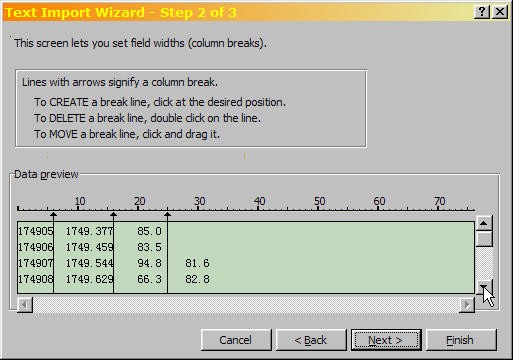
A cropped screenshot of the text import dialog window in Microsoft Excel shows hidden data in the second step to importing text files. A table near the bottom of the dialog box shows a preview of the data from a text file. Scrolling down in the table reveals data that is unmarked and without a column designation.
- To import the fourth data column, click next to it as shown:
A cropped screenshot of the text import dialog window in Microsoft Excel shows an extra data column being added in the second step to importing text files. A table near the bottom of the dialog box shows a preview of the data from a text file. Clicking on empty space in the table preview creates an extra column for additional data.
- Click "Next." For the yearly sunspot data, click "Finish" and go on to the section "Graph the Data".
- For the monthly sunspot data, scroll down to the last few rows of data in the fourth column, and you will see some asterisks (indicating that these averages were computed with provisional data). Make sure that the asterisks are in the fifth data column, as shown here:
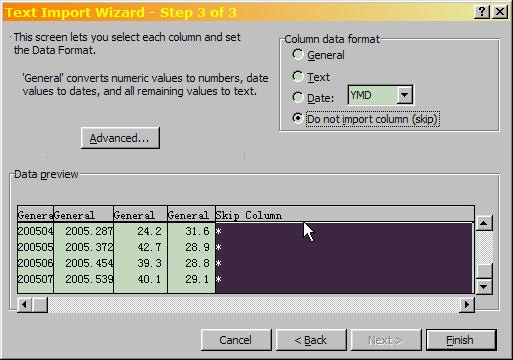
A cropped screenshot of the text import dialog window in Microsoft Excel shows a preview table during the third step to importing text files. A table near the bottom of the dialog box shows a preview of data from a text file and columns that separate the data. A fifth column with asterisks is highlighted in black as it is excluded from the text import.
- You can choose to skip import of the asterisk column if you want. Click "Finish" to import the monthly data.
- From the menu, select File/Open.... You'll see a dialog:
/-/https/www.sciencebuddies.org/cdn/Files/2288/3/Astro_img020.jpg)
/-/https/www.sciencebuddies.org/cdn/Files/2289/3/Astro_img021.jpg)
/-/https/www.sciencebuddies.org/cdn/Files/2290/3/Astro_img022.jpg)
/-/https/www.sciencebuddies.org/cdn/Files/2291/3/Astro_img023.jpg)
/-/https/www.sciencebuddies.org/cdn/Files/2292/3/Astro_img024.jpg)
/-/https/www.sciencebuddies.org/cdn/Files/2293/3/Astro_img025.jpg)
Graph the Data
- Before you graph your data, insert a new row at the top of the spreadsheet and add labels to identify the data in each column. (If you don't know how to do this, the Excel tutorial can you show you, or you can use the Help function in Excel.)
- Also, it is useful to know the range of values you'll be graphing, so that you can select the appropriate scale for your graph. You can use the "min" and "max" functions to have the spreadsheet find these values for you. (Again, the Excel tutorial shows how to do this.)
- Use the Chart Wizard to create a graph of the data. You'll use the graph to identify the approximate location for the beginning of each cycle.
- Select Insert/Chart... to open Excel's Chart Wizard.
- Select the "Area" Chart type, and the top-left Chart sub-type as shown:
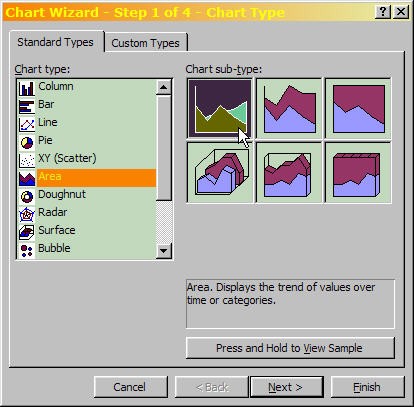
A cropped screenshot of the wizard dialog window in Microsoft Excel showign options for chart type and sub-type. A list of chart types on the left side of the screen allows users to select different charts and six pictures to the right of the chart list show sub-types of the selected chart.
- Click "Next," then select the "Series" tab in the "Source Data" dialog as shown:
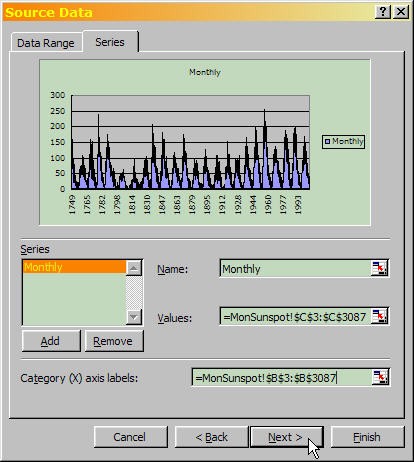
A cropped screenshot of the chart wizard dialog window in Microsoft Excel showing options to select data for the chart. The series tab at the top of the dialog box is selected and a preview graph is shown under the tab. Under the preview graph there are fields to input the graph name (Monthly is written in this example), data range for the values, and labels for the x-axis. To the left of the text fields there is a list of graph series with a single entry labeled "Monthly".
- In this example, we're going to be plotting two series of data: the monthly numbers, and then the smoothed monthly numbers. The dialog shows all of the information filled in for the first series.
- We gave it a name: "Monthly".
- We provided the range of values to plot on the y-axis (the monthly sunspot numbers from column "C", rows 3–3087).
- We provided the range of labels for the x-axis (the year, from column "B", rows 3–3087).
- When your first data series is all set up, click the "Add" button to add the next data series, like this:
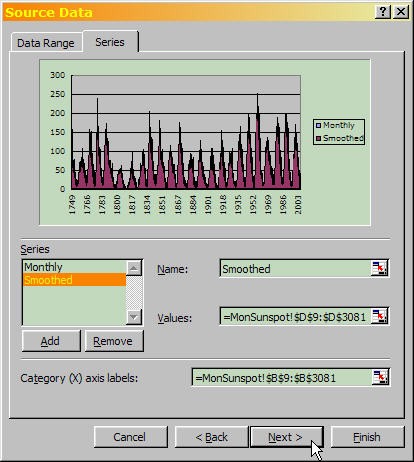
A cropped screenshot of the chart wizard dialog window in Microsoft Excel showing a second graph series. The series tab at the top of the dialog box is selected and a preview graph is shown under the tab. Under the preview graph a button labeled 'Add' is clicked and a second entry for a graph series is created and named 'Smoothed'. To the right of the graph series list there are text fields to input the graphs name (Smoothed is written in this example), data range for the values and labels for the x-axis.
- When your second data series is all set up, click the "Next" button for step 3, Chart Options. Add a title for the chart, and labels for the x- and y-axes:
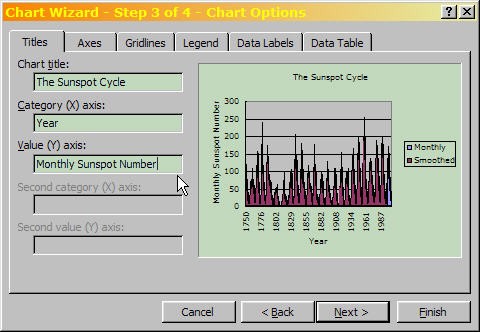
A cropped screenshot of the chart wizard dialog window in Microsoft Excel shows the chart title being set. The titles tab at the top of the dialog box is selected and a preview graph is shown on the right side of the dialog box. Three fields on the left of the preview allow changes to be made to the title (The Sunspot Cycle), label for the x-axis (Year) and label for the y-axis (Monthly Sunspot Number).
- We think the chart looks cleaner without heavy gridlines, so turned them off using the Gridlines tab:
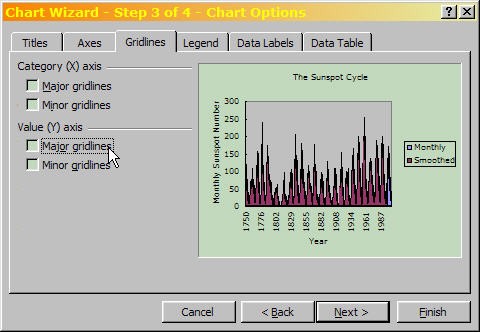
A cropped screenshot of the chart wizard dialog window in Microsoft Excel shows gridlines being removed . The gridlines tab at the top of the dialog box is selected and a preview graph is shown on the right side of the dialog box. Four boxes for gridlines, on the left side of the preview, are unchecked to remove all gridlines from the chart.
- Click "Next", then select where you want the chart to appear (we've chosen to place it on a new worksheet), then click "Finish."
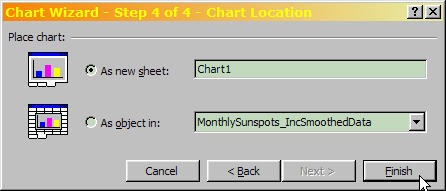
A cropped screenshot of the chart wizard dialog window in Microsoft Excel shows placement options for the new chart. Two options are available for placement: posting the chart in a new sheet or as an object in an existing sheet. The option to post in a new sheet is selected and the sheet is named "Chart1".
- The graph created by the Chart Wizard is OK, but there are still some additional tweaks to make it better. For example, we can choose an interval for labeling the years on the x-axis that relates to the 11-year period of the solar cycle. We can change the scale of the y-axis to more closely match the range of the data. We can change the color of the data series, and show the smoothed data as a line over the solid monthly average.

A cropped screenshot of a sunspot cycle graph created in Microsoft Excel that measures the number of sunspots every month over the course of 247 years. The total number of sunspots seen monthly changes drastically from year to year but a recurring pattern of rising and falling sunspot numbers at regular intervals is consistent over the entire graph.
- To make changes to the x-axis, double-click on the x-axis labels. You should see a "Format Axis" dialog:
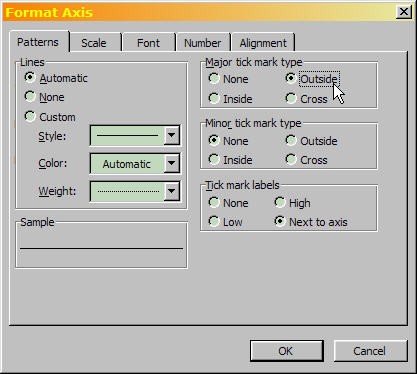
A cropped screenshot of the format axis dialog window in Microsoft Excel shows outside tick marks added to a graph. Four radial buttons on the top-right of the format axis dialog window (under the patterns tab), show options to change the major tick mark type (with Outside selected).
- Change the "Major tick mark type" to "Outside", as shown above. Then click on the "Scale" tab:
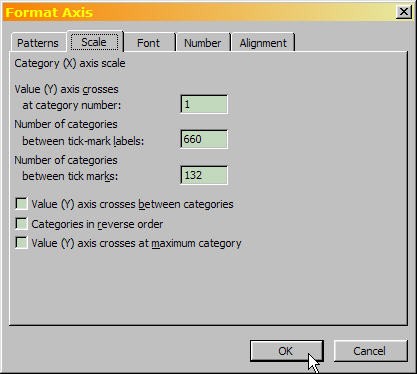
A cropped screenshot of the format axis dialog window in Microsoft Excel shows intervals for x and y-axis labels changed to better represent the data on a graph. Three text boxes at the top of the dialog window (under the scale tab), allow changes to be made to the value y-axis crosses at category number, the number of categories between tick mark labels and the number of categories between tick marks (values of 1, 660 and 132, respectively).
- We'd like our x-axis labels to relate to the 11-year period of the solar cycle. A reasonable choice is to have labels appear every 55 years, with tick marks in between at 11-year intervals. So we've changed the "Number of categories between tick-mark labels" to 660 (= 55 years × 12 months/year). We've changed "Number of categories between tick marks" to 132 (= 11 years × 12 months/year). When you've made these changes, click "OK."
- To make changes to the y-axis, double-click on the y-axis labels. You should see a "Format Axis" dialog again. Set the "Major tick mark type" to "Outside", as we did for the x-axis. Then select the "Scale" tab:
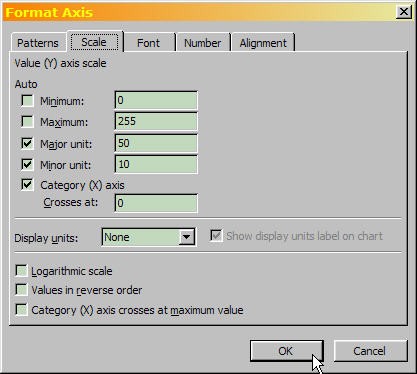
A cropped screenshot of a format axis dialog window in Microsoft Excel shows the scale of the y-axis changing to fit the data of a sunspot graph. Five text boxes at the top of the dialog box (under the scale tab), allow changes to be made to the minimum, maximum, major unit, minor unit and category x-axis crosses at for the y-axis of a graph (values of 0, 255, 50, 10 and 0, respectively).
- Here we've set the minimum and maximum values are set closer to the actual range of the data (0–253.8, in our case). When you've made these changes, click "OK."
- Finally, to change options for the appearance of the data (like color), double click on a data point. (If you "hover" the mouse over the graph, you should see a tooltip that tells you which data series you're over.) Here we double-clicked on one of the "Smoothed" data points:
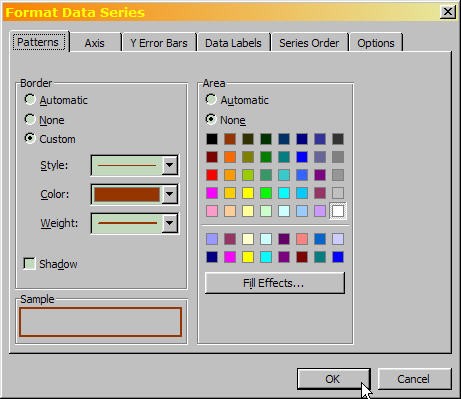
A cropped screenshot of the format data series dialog window in Microsoft Excel shows options to change the visual appearance of a data set in a graph. The dialog includes options to set the border style, color and weight, and the area fill color. No color is chosen to fill the graph, but a brown border with a straight line style is chosen to represent the smoothed set of data for a sunspot graph.
- We want the "Smoothed" data set to appear as a line, on top of the "Monthly" data set. So we selected "None" for the Area, and chose a "Custom" border, which we set to a brown color and a medium-thick line. For the "Monthly" data, we chose "None" for the border, and a black-filled Area. Here is how the finished graph looks:

Graph showing the number of sunspots visible on the sun for every month from the year 1749 to 2005. The data in the histogram is colored black and a brown line outlines the edges of spikes that occur in the graph at regular intervals.
- The colors are chosen to go well with one another and with the background. Jarring contrasts are avoided. We also don't bother with effects like flashy gradient fills that have no relation to the data. Avoid meaningless clutter in your graphs. You should strive to present the data clearly, so it can speak for itself.
/-/https/www.sciencebuddies.org/cdn/Files/2294/3/Astro_img026.jpg)
/-/https/www.sciencebuddies.org/cdn/Files/2295/3/Astro_img027.jpg)
/-/https/www.sciencebuddies.org/cdn/Files/2296/3/Astro_img028.jpg)
/-/https/www.sciencebuddies.org/cdn/Files/2297/3/Astro_img029.jpg)
/-/https/www.sciencebuddies.org/cdn/Files/2298/3/Astro_img030.jpg)
/-/https/www.sciencebuddies.org/cdn/Files/2299/3/Astro_img031.jpg)
/-/https/www.sciencebuddies.org/cdn/Files/2304/3/Astro_img036.jpg)
/-/https/www.sciencebuddies.org/cdn/Files/2300/3/Astro_img032.jpg)
/-/https/www.sciencebuddies.org/cdn/Files/2301/3/Astro_img033.jpg)
/-/https/www.sciencebuddies.org/cdn/Files/2302/3/Astro_img034.jpg)
/-/https/www.sciencebuddies.org/cdn/Files/2303/3/Astro_img035.jpg)
/-/https/www.sciencebuddies.org/cdn/Files/2305/3/Astro_img037.jpg)
Extracting the Cycle Data
- Now that you have a graph of the data, you can use it to help identify the beginning and end of each solar cycle. In order to measure onset time and decay time accurately, we need complete solar cycles. Using the monthly data, there were 22 complete cycles between 1775 and 1996.
- You should construct a second table in your spreadsheet that shows the beginning, peak and end of each cycle. We can build this table by finding the row numbers for the beginning of each solar cycle in the data table.
- Use the graph to find the approximate dates for the beginning of each cycle (the lowest point in the "trough" between cycles). When the mouse "hovers" over a data point, a tooltip pops up with information about that point, as shown:
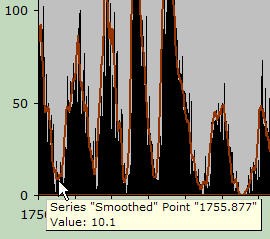
A cropped screenshot of a tooltip for the lowest data point of the first dip in a sunspot histogram made in Microsoft Excel. The tooltips says the specific data point is part of the "Smoothed" series, a point value of "1755.877" and a value of 10.1 sunspots.
- Then, switch to the data table and scroll down to that approximate date (in this case, 1755.877). Scan the sunspot numbers around that date and find the smallest one. That's the data row that you want. In the column at the right, write in the cycle number (starting with zero, as shown).
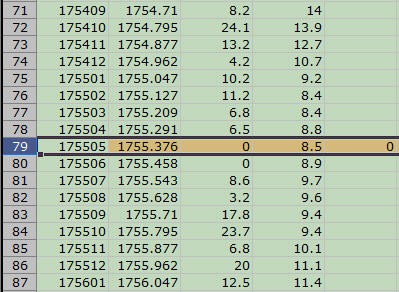
A cropped screenshot of row 79 highlighted in a data sheet within Microsoft Excel. Row 79 has five columns of numerical data with values of 175505, 1755.376, 0, 8.5 and 0.
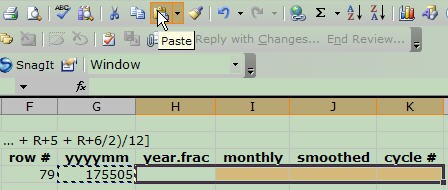
- Then copy the row number to your new data table, as shown:

A cropped screenshot of an empty row in a spreadsheet within Microsoft Excel. The row has six columns and headers (from left-to-right): row #, yyyymm, year.frac, monthly, smoothed and cycle. The column for row number is filled with a value of 79.
- Next, you'll use Excel's "value" function to copy the data values for the beginning of the cycle.
- Enter the formula:

A cropped screenshot of a value function used in Microsoft Excel. A row has six columns and headers (from left-to-right): row #, yyyymm, year.frac, monthly, smoothed and cycle. The column for row number is filled with a value of 79 and a value function is typed into the second column of the row. The value function is written as "=value(A79)" which will input the value from cell A79 into the current cell.
- Hit "Enter" and Excel copies the value for you:

A cropped screenshot of data entered into a row in a spreadsheet within Microsoft Excel. The row has six columns and headers (from left-to-right): row #, yyyymm, year.frac, monthly, smoothed and cycle. The column for row number is filled with a value of 79 and 175505 is entered into the second column.
- Then copy your formula:

A cropped screenshot of a cell being copied in a spreadsheet within Microsoft Excel. A row has six columns and headers (from left-to-right): row #, yyyymm, year.frac, monthly, smoothed and cycle. A black and white border around the second cell in the row shows that the cell has been copied.
- And paste it in to the next four columns:
A cropped screenshot shows a cursor over a clipboard icon labeled paste in Microsoft Excel. The clipboard icon is to the left of center at the top of the program window. Four columns in a row are highlighted as the cells to paste a value function into.
- Excel fills in the remaining values for you:

A cropped screenshot of data entered into a row in a spreadsheet within Microsoft Excel. The row has six columns and headers (from left-to-right): row #, yyyymm, year.frac, monthly, smoothed and cycle. The row has values of 79, 175505, 1755.376, 0, 8.5 and 0, respectively.
- Enter the formula:
- Repeat steps 3–6 for each of the 22 cycles, leaving a blank row in your new data table (for filling in the maximum point of each cycle later). Remember to increase the cycle number by 1 each time.
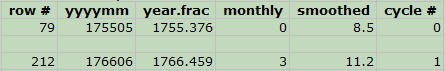
A cropped screenshot of two rows of data, with a row of space between them, entered in a spreadsheet within Microsoft Excel. The rows have six columns and headers (from left-to-right): row #, yyyymm, year.frac, monthly, smoothed and cycle. The first row has values of 79, 175505, 1755.376, 0, 8.5 and 0, respectively. The second row has values of 212, 176606, 1766.459, 3, 11.2 and 1, respectively.
- Now you're ready to find the maximum for each cycle. Again, you can have Excel do some of the work for you. Using the row number information from your table, you'll use the "max" formula to have Excel find the maximum sunspot number within each cycle.
- Column "C" is the monthly sunspot number, and the first cycle begins at row 79 and ends at row 212. Here's the formula for the maximum monthly sunspot number for the first cycle:
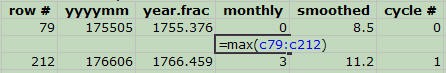
A cropped screenshot of two rows of data, with a max function added between the rows, entered in a spreadsheet within Microsoft Excel. The rows have six columns and headers (from left-to-right): row #, yyyymm, year.frac, monthly, smoothed and cycle. The max function returns the highest value from a selected data range, it is entered into the 4th column of an empty row between two rows of data. The max function is written as "=max(c79:c212)".
- Click "Enter" and Excel finds the value for you:
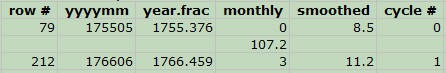
A cropped screenshot of two rows of data, with a max function added between the rows, entered in a spreadsheet within Microsoft Excel. The rows have six columns and headers (from left-to-right): row #, yyyymm, year.frac, monthly, smoothed and cycle. The max function returns the highest value from a selected data range, it is entered into the 4th column of an empty row between two rows of data. The max function returns a value of 107.2.
- Column "C" is the monthly sunspot number, and the first cycle begins at row 79 and ends at row 212. Here's the formula for the maximum monthly sunspot number for the first cycle:
- Now you need to find the date that corresponds to the maximum sunspot number for the cycle. You can use Excel's "Find" feature for this.
- First click on column "C" (the monthly sunspot number) to select only this column for searching. Then select Edit/Find... (or use Ctrl+F) and fill in the maximum value that Excel just found for you (in this case, "107.2"):
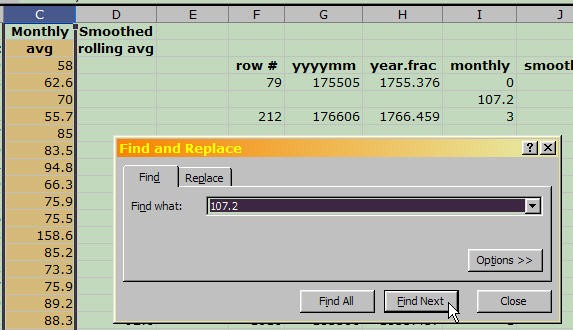
A cropped screenshot of the find and replace dialog window in Microsoft Excel includes a text box labeled "Find what". The dialog is set to find values matching the number "107.2".
- Click on "Find Next." Excel finds the first occurrence of this value in column "C." You can copy the date information:
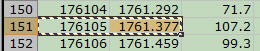
A cropped screenshot of two date cells being copied in a spreadsheet within Microsoft Excel. The two cells in row 151 outlined with a black and white border show that the cells have been copied.
- and then paste it in your data table:
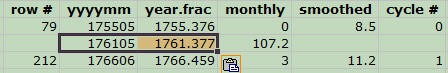
A cropped screenshot of data pasted into a row in a spreadsheet within Microsoft Excel. Two cells are pasted between two rows of data in the columns for yyyymm and year.frac, both cells are outlined in black and have values of 176105 and 1761.377, respectively.
- Note that the value you are searching for may occur more than once in the data table. If the date is too early, just click on "Find Next" again until you find the date for the right solar cycle.
- First click on column "C" (the monthly sunspot number) to select only this column for searching. Then select Edit/Find... (or use Ctrl+F) and fill in the maximum value that Excel just found for you (in this case, "107.2"):
- Repeat steps 8 and 9 for each of the 22 solar cycles.
/-/https/www.sciencebuddies.org/cdn/Files/2306/3/Astro_img038.jpg)
/-/https/www.sciencebuddies.org/cdn/Files/2307/3/Astro_img039.jpg)
/-/https/www.sciencebuddies.org/cdn/Files/2308/3/Astro_img040.jpg)
/-/https/www.sciencebuddies.org/cdn/Files/2309/3/Astro_img041.jpg)
/-/https/www.sciencebuddies.org/cdn/Files/2310/3/Astro_img042.jpg)
/-/https/www.sciencebuddies.org/cdn/Files/2311/3/Astro_img043.jpg)
/-/https/www.sciencebuddies.org/cdn/Files/2312/3/Astro_img044.jpg)
/-/https/www.sciencebuddies.org/cdn/Files/2313/3/Astro_img045.jpg)
/-/https/www.sciencebuddies.org/cdn/Files/2314/3/Astro_img046.jpg)
/-/https/www.sciencebuddies.org/cdn/Files/2315/3/Astro_img047.jpg)
/-/https/www.sciencebuddies.org/cdn/Files/2316/3/Astro_img048.jpg)
/-/https/www.sciencebuddies.org/cdn/Files/2317/3/Astro_img049.jpg)
/-/https/www.sciencebuddies.org/cdn/Files/2318/3/Astro_img050.jpg)
/-/https/www.sciencebuddies.org/cdn/Files/2319/3/Astro_img051.jpg)
Calculating Onset Time and Decay Time
- Now you have all the information you need to calculate the onset time and decay time for each solar cycle. With what you've learned about spreadsheets so far, you should be able to do this on your own.
- In addition, you should have Excel calculate the difference between the onset time and decay time for each solar cycle.
- Finally, for all three values (onset time, decay time and difference), calculate the average and standard deviation for all 22 solar cycles.
- Is there a difference?
Testing for Statistical Significance
- How can you tell if a trend in your data is real? Is there some way for you to know how reliable the data is? Yes: the answer is to apply the proper tests of statistical significance.
- Here is a quick summary of how such a test works:
- Formulate a "null hypothesis" (essentially the converse of what you want to prove). In this case, the null hypothesis would be that there is no difference between onset time and decay time.
- Select the appropriate statistical test for the data. In this case, the onset time and decay time are paired values, since each one is describing a different feature of the same solar cycle. The test to use in this case is "Student's paired t-test.
- The result of the t-test will tell us, under certain assumptions, the probability that the null hypothesis is true. By convention, the probability is referred to as a "p value" and is given as an inequality. For example, if p < 0.01, this means that the probability of the null hypothesis is true is less than 0.01, or less than 1 in 100. Another way to put it is that we are 99% certain that our desired hypothesis (the converse of the null hypothesis) is, in fact, true.
- You can use this Physics link from College of Saint Benedict & Saint John's University to run a paired t-test on your data. Select the "paired t-test" choice. First you'll have to enter the number of data pairs (22). Next you'll get a page with a form where you can enter your pairs of onset and decay times for each solar cycle. When you've entered all the data, click on the "Calculate Now" button at the top of the page to get the results (which you can copy and paste for your lab notebook).
- Include the p value with your results on your display board. You should be prepared to explain what it means.
Ask an Expert
Global Goals
The United Nations Sustainable Development Goals (UNSDGs) are a blueprint to achieve a better and more sustainable future for all.
/-/https/www.sciencebuddies.org/cdn/Files/19756/5/E-WEB-Goal-13.png)
Variations
- In addition to testing the onset and decay times, test the rate of rise and decay (includes both time and magnitude). Is there a correlation between the magnitude of sunspot activity and the a difference in onset vs. decay rate?
Careers
If you like this project, you might enjoy exploring these related careers:
/-/https/careerdiscovery.sciencebuddies.org/cdn/Files/1815/24/stat.jpg)
/-/https/careerdiscovery.sciencebuddies.org/cdn/Files/902/18/iStock-1174945987.jpg)
/-/https/careerdiscovery.sciencebuddies.org/cdn/Files/17070/11/pexels-photo-5716042.jpg)

/-/https/img.youtube.com/vi/QSITi4j_HZI/0.jpg)
/-/https/img.youtube.com/vi/hIsUn2ZIy_Y/0.jpg)
/-/https/img.youtube.com/vi/rvyNRQ2J1_c/0.jpg)