Abstract
So you've just heard the "Happy Birthday" song and now it's time to blow out the candles. If you are sitting far away from the candles, you know you'll have to blow harder to get them all out than if you were sitting closer. In this science fair project, you'll blow on different kinds of pinwheels with a blow-dryer and see how far away you can get before they stop spinning. This will give you clues about how sensitive the pinwheels are to wind, and why. So come spin your wheels and get somewhere, too!Summary
Kristin Strong, Science Buddies
/-/https/www.sciencebuddies.org/cdn/Files/3332/5/EnvEng_img060.jpg)
Objective
In this science fair project, you will determine which pinwheel configurations are most sensitive to a wind source.
Introduction
Has this situation ever happened in your family? You turn on a TV and one person says, "I can barely hear it. Please turn it up." While another person says, "It's too loud. Please turn it down." Everyone has different thresholds of sensitivity to pain, light, sound, smell, taste, temperature, and vibration. The pain, light, sound, smell, taste, temperature, and vibrations are inputs, and the ways you experience them in your brain are called outputs. Mechanical devices also have inputs and outputs. For a pinwheel, the input is wind, and the output is spinning motion. For a wind generator, the input is wind, and the output is electrical power. In this science fair project, you'll find the threshold at which different pinwheels can produce an output in response to a wind source input.
In your testing for this science fair project, you will create pinwheels with different numbers of blades. This means some pinwheels will be symmetrical and others will be asymmetrical. You know symmetry when you see it because there is a sense of balance on both sides, or from all around. In the examples in Figure 1, you see that the symmetrical shapes are equal on both their left and right sides, while those that are asymmetrical are not equal on both sides.
/-/https/www.sciencebuddies.org/cdn/Files/3331/5/EnvEng_img059.jpg)
You'll explore whether symmetrical pinwheel shapes have greater sensitivity thresholds than asymmetrical ones, and how the number of pinwheel blades affects sensitivity thresholds as well.
Terms and Concepts
- Threshold
- Sensitivity
- Input
- Output
- Wind generator
- Symmetry
- Asymmetry
Questions
- How do you know when you have crossed a threshold for a mechanical device?
- What is the difference between symmetry and asymmetry?
- Is symmetry more important to the sensitivity threshold of a pinwheel, or is the number of blades more important?
Bibliography
- This source define and give examples of symmetry from both an artistic and mathematical sense:
Wikipedia Contributors. (2008, May 23). Symmetry. Wikipedia: The Free Encyclopedia. Retrieved May 23, 2008. - For help creating graphs, try this website:
National Center for Education Statistics (n.d.). Create a Graph. Retrieved May 23, 2008.
Materials and Equipment
- Pinwheels, 8-blade style (3)
- Heavy cushions or stacks of books
- Room that is free from drafts of air
- Measuring tape
- Colored sticky notes, small size (21)
- Pen
- Hair blow-dryer
- Scissors
- Lab notebook
- Graph paper (or use a program online, like Create a Graph)
Experimental Procedure
Test Your Pinwheel
- Prop up one of your pinwheels between two cushions or two stacks of books in a room that is free from drafts of air.
- Extend and lock your measuring tape several feet on the floor from where the base of the pinwheel is located, straight back, as in Figure 2.
- Label seven of the sticky notes from 0-6.
- Look at the pinwheel. Count how many blades have been cut off. The first pinwheel you experiment with should have all eight blades, meaning zero have been cut off yet. Pick up the label that has the number of cut-off blades on it.
-
Turn the blow-dryer on low power, and hold it level with the pinwheel, as shown in Figure 2. Start right next to the pinwheel. Be sure the blow-dryer never touches the pinwheel to avoid burning. Slowly back up until the pinwheel stops turning. Turn off the blow-dryer and lower it straight down to the ground beside the measuring tape.
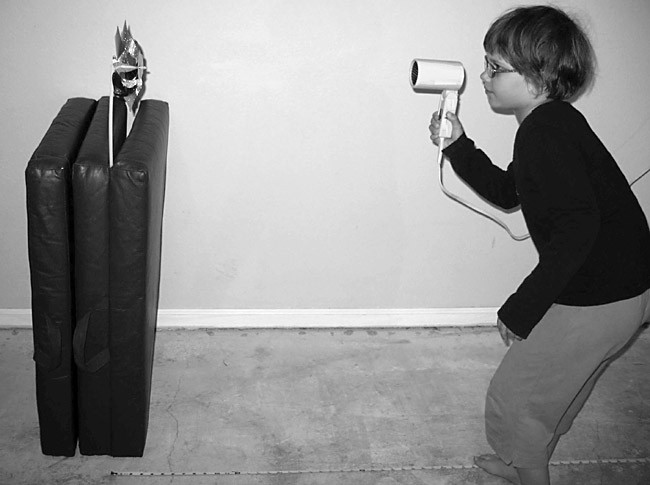
Figure 2. This shows how to set up the pinwheel and test it with a blow-dryer. - Mark the point at which the pinwheel stopped turning on the floor by placing the sticky note beside the measuring tape on the floor.
-
Look at the pinwheel and pick a blade to remove. Try to keep the pinwheel as symmetric as possible when you choose which blade to remove. Cut off the blade you have chosen with the scissors. The blade is attached to a front wheel and a back wheel, so you will need to make two cuts to remove it. Be careful with the scissors.
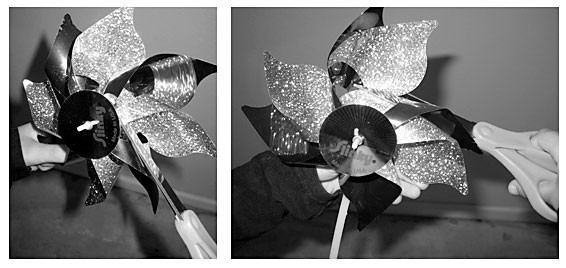
Figure 3. These photos show how to remove a blade from the pinwheel with two cuts. - Reposition your pinwheel between the cushions or stacks of books.
- Repeat steps 4-8 until there is only one blade left. Be careful as you step backwards that you are not moving the sticky notes that are next to the measuring tape.
/-/https/www.sciencebuddies.org/cdn/Files/3332/5/EnvEng_img060.jpg)
/-/https/www.sciencebuddies.org/cdn/Files/3333/5/EnvEng_img061.jpg)
Record Your Measurements
-
Go to each of the labels on the floor and measure the distance at which it is located on the measuring tape. These are threshold distances. Record your measurements in your lab notebook in a data table.
Data Table for Pinwheel Number 1 Number of Pinwheel
Blades RemovedPinwheel Shape Threshold Distance at Which the Pinwheel Stopped Turning (inches) 0 Symmetric 1 Asymmetric 2 Symmetric 3 Asymmetric 4 Symmetric 5 Asymmetric 6 Symmetric - To ensure solid results, repeat steps 1-9 for the remaining two pinwheels, and record your measurements by making a new data table for each pinwheel. You should end up with three data tables.
Combine and Analyze Your Data Tables
-
Fill out the data table with the information from the other three data tables:
Number of Pinwheel Blades Removed and Pinwheel Shape Threshold Distance at Which Pinwheel Number 1 Stopped Turning (inches) Threshold Distance at Which Pinwheel Number 2 Stopped Turning (inches) Threshold Distance at Which Pinwheel Number 3 Stopped Turning (inches) Sum of Threshold Distances (inches) Average of Threshold Distances (inches) 0 (symmetric) 1 (asymmetric) 2 (symmetric) 3 (asymmetric) 4 (symmetric) 5 (asymmetric) 6 (symmetric) - Plot the number of pinwheel blades removed (x-axis) vs. the average threshold distance in inches that it took for the pinwheels to stop turning (y-axis). You can make the line graph by hand or use a website like Create a Graph to make the graph on the computer and print it.
- As more blades were cut off, what happened to the threshold distance? Was the threshold distance greater for symmetrical pinwheel shapes or asymmetrical pinwheel shapes?
Ask an Expert
Global Goals
The United Nations Sustainable Development Goals (UNSDGs) are a blueprint to achieve a better and more sustainable future for all.
/-/https/www.sciencebuddies.org/cdn/Files/19750/5/E-WEB-Goal-07.png)
Variations
- Repeat the experiment with the blow-dryer on high, rather than on low power. Do the sensitivity thresholds for high power change in the same way that they did for low power?
- Repeat the experiment using the blow-dryer on low power, but directed at an angle to the pinwheel. Do the sensitivity thresholds change in the same way that they did when the blow-dryer was directed perpendicular to the pinwheel?
Careers
If you like this project, you might enjoy exploring these related careers:
/-/https/careerdiscovery.sciencebuddies.org/cdn/Files/1888/17/unsplash-IU10leGdwxg.jpg)
/-/https/careerdiscovery.sciencebuddies.org/cdn/Files/1894/17/iStock-870031246.jpg)
/-/https/careerdiscovery.sciencebuddies.org/cdn/Files/1147/17/unsplash-fJebhGIP0P4.jpg)

/-/https/img.youtube.com/vi/tv6LvMgVDcQ/0.jpg)
/-/https/img.youtube.com/vi/c4Iu_-jqegw/0.jpg)
/-/https/img.youtube.com/vi/YTnjxnA292E/0.jpg)