Abstract
Is your PC an energy hog? Check out this science fair project to determine how much power your PC really uses, and if it is an energy hog, how you can reduce its appetite for energy. You'll learn how to profile and streamline your computer's power usage, while still enjoying every feature of your machine.Summary
Kenneth L. Hess, President of Science Buddies
Kristin Strong, Science Buddies
Edited by Peter Boretsky, Lockheed Martin
- Kill a WattTM is a registered trademark of P3 International.
- Microsoft® and WIndowsTM are registered trademarks of Microsoft Corporation.
- WiiTM is a trademark of Nintendo.
/-/https/www.sciencebuddies.org/cdn/Files/3537/5/Energy_img027.jpg)
Objective
To determine how much power the major parts of your computer system consume, and to determine how to configure your PC so that it conserves power.
Introduction
So, imagine it's time for bed. You've been playing video games all evening long and you're beat. You've brushed your teeth and put on your pajamas. Now the question is: Should you turn off the computer before going to sleep? Would that save a lot of energy? Or, should you just turn off the monitor? Or, how about letting the screen saver take care of things? Would that be better? In this science fair project, you'll find out which parts of your personal computer system (PC) are the most power hungry, and how you can set up your system to reduce its appetite and save energy.
Your computer system, whether desktop or laptop, contains some of the following hardware components:- A monitor or screen
-
A computer, containing:
- Power supply
- Fan
- One or more hard drives
- A central processing unit or CPU
- Memory
- Video or graphics card (which may have its own CPU, fan, and memory)
-
Peripheral devices:
- Printer
- Scanner
- CD/DVD writer
At any moment, the amount of power each piece of hardware is consuming depends upon what the hardware is doing (powering up, idling, performing an action, or powering off). For many devices, peak power usage is seen when a device is powering up. This is called transient or changing power usage, and it usually lasts a few minutes at most. After the device powers on and it is idling and waiting to be used, it settles down to a lower power usage state. This lower power state is steady and unchanging and is called steady-state. An example of a power curve with periods of transient and steady-state power usage is shown in Figure 1. Note: you can find more background information about electricity in the Science Buddies Electricity, Magnetism, & Electromagnetism Tutorial.
/-/https/www.sciencebuddies.org/cdn/Files/3536/5/Energy_img026.jpg)
Example graph of the power usage of an electronic device upon startup. The power used by the device peaks and then lowers to a steady state within the first minute. After the first minute the device maintains a steady power usage. The initial peak usage of power is called the transient state.
Figure 1. This is an example of power usage for a device, showing transient and steady-state power consumption
Your computer also contains software, which runs an operating system that manages and coordinates the computer's hardware and actions. Some operating systems are better at managing the computer's resources than others are, and upgrading to a new operating system, even if the hardware components are the same, can sometimes save energy.
Other software programs called applications, such as word processors and media players, can also impact power usage. Applications that work the graphics card or CPU intensely will cause more power consumption than those that do not.
Video games are also one of the most demanding forms of software available, as they require intense computations to create realistic, three-dimensional graphics. Gamers often require high-performance, power-hungry computers that are fast and have special graphics cards that can handle the complex animations.
In this science fair project, you will investigate the power consumption of several hardware components in your PC when they are powering up, idling, or performing an action under the command of software. Which component do you think is the energy hog?
Terms and Concepts
- Energy
- Monitor
- Screen saver
- Power
- Hardware
- Hard drive
- CPU
- Memory
- Video or graphics card
- Peak power
- Transient
- Steady state
- Software
- Operating system
- Applications
Questions
- What are the major components of a computer system?
- What are watts and kilowatts?
- What is the difference between transient and steady-state power?
Bibliography
This source discusses the pros and cons of turning off PC's at night:
- Enbysk, M. (n.d.). Do you need to turn off your PC at night? Microsoft Small Business Center. Retrieved March 14, 2014.
For help creating graphs, try this website:
- National Center for Education Statistics (n.d.). Create a Graph. Retrieved May 23, 2008.
Materials and Equipment
- Personal Computer (PC), desktop or laptop
- Peripheral devices (optional)
- An electricity usage monitor, like the P3 International P4400 Kill a Watt Electricity Usage Monitor; these units can be purchased from Amazon.com.
- Power strip
- Stopwatch
- Lab notebook
Disclaimer: Science Buddies participates in affiliate programs with Home Science Tools®, Amazon.com, Carolina Biological, and Jameco Electronics. Proceeds from the affiliate programs help support Science Buddies, a 501(c)(3) public charity, and keep our resources free for everyone. Our top priority is student learning. If you have any comments (positive or negative) related to purchases you've made for science projects from recommendations on our site, please let us know. Write to us at [email protected].
Experimental Procedure
Note: The detailed instructions given below in the PC Power Usage Data Table are for the Microsoft Windows Vista operating system, but the general procedure, as outlined, is applicable to any operating system. For example, you can complete the procedure with Microsoft Windows 98, Mac OS X, or Linux. Consult your computer manual or online resources, such as those listed below, for details:
- For Windows XP support, visit http://windowshelp.microsoft.com/Windows/en-US/usingwindowsxp.mspx
- For MAC OS X support, visit http://www.apple.com/support/hardware/
- For Linux support, visit http://www.linux.org/docs/
Experimental Setup
- To set up your desktop or laptop computer system for testing, first make sure all hardware components are turned off. This includes the computer, monitor (if you have a desktop system), and any two peripheral devices of your choosing, such as a printer, scanner, speakers, or CD/DVD writer.
-
Configure the power cords for your hardware, as shown in Figure 2. Plug the power cords for the computer, monitor (if applicable), and any two peripheral devices (if available) into the power strip. Because the Kill A Watt meter has a 15-amp maximum current limit, do not add more than two peripheral devices to avoid exceeding this limit.
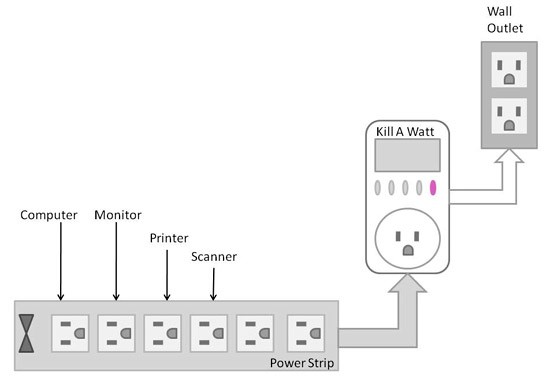
Figure 2. This drawing shows how to configure the power cords on an example computer system for power testing. - Plug the Kill A Watt meter into a wall outlet.
- Plug the power strip cord into the Kill A Watt meter.
/-/https/www.sciencebuddies.org/cdn/Files/3537/5/Energy_img027.jpg)
Testing Your Computer System
- Turn on the power strip.
- Find the power button (Watt) in the center of the Kill A Watt meter, and press it. What value does it show on the display? With everything turned off, it should read zero, unless you are testing a laptop, and it is charging its internal battery, in which case the meter will likely read a low 1-2 watts (W).
-
Create a data table in your lab notebook like the one shown below. Conduct each action listed and record the peak power you measure with the Kill A Watt meter during the first seconds of the action. Then record the steady-state power you observe after the action has completed and the Kill A Watt meter stops changing. If the Kill A Watt meter continue to oscillate between two numbers during the steady-state time period, average the two numbers, and go on to the next action. Spots in the data table marked with an "X" indicate that you do not need to record the peak power measurement for that action.
PC Power Usage Data Table (Trial 1) Action Computer State Monitor State Peripheral Devices' States Peak Power (W) Steady-state Power (W) 1. Turn on the computer and the monitor. ON ON OFF 2. If you are testing a desktop system, turn the monitor off using the monitor's power button. If you are testing a laptop, move on to step 3 and test the screen saver. ON OFF OFF X 3. Turn the monitor back on and make the screen go blank with the screen saver after 1 minute. In the Vista operating system, this is done by right-clicking on the background, going to Personalize, and then selecting: Screen Saver, Blank, Wait 1 min, Apply. ON ON OFF X 4. Return the screen saver to its normal settings and adjust the brightness on your monitor to minimum. In the Vista Operating System, this is done by right-clicking on the background, going to Personalize, and then selecting: Screen Saver, Change Power Settings, Adjust the Display Brightness, and Save Changes. ON ON OFF X 5. Adjust the brightness on your monitor to maximum. In the Vista Operating System, this is done as described in step 4. ON ON OFF X 6. Run a disk defragmenter program for a few minutes to exercise the disk to the maximum. For the Vista Operating System, this is done by going to: Start, Programs, Vista Manager, Misc. Utilities, Windows Utilities, Disk Utilities, Disk Defragmenter. ON ON OFF 7. Stop the disk defragmenter, and start up a word processing application. ON ON OFF 8. Close the word processing application and start a video game (you can tell your parents it's in the interest of science, really!). ON ON OFF 9. Close the video game and play a DVD (again, in the interest of science!). ON ON OFF 10. Stop the DVD, and power up one of your peripheral devices (if available); for example, the printer. Write down the name of the peripheral device you are testing right here: _______________________ If you don't have any peripheral devices, move on to step 14. ON ON ON (first peripheral device is on; all others are off) 11. Operate your peripheral device. For example, open up a document and print out a test page on a printer. ON ON ON (first peripheral device is on) 12. Power off your peripheral device and power on a second peripheral device (if available). Write down the name of the peripheral device you are testing now right here: ________________________ If you don't have a second peripheral device, move on to step 14. ON ON ON (second peripheral device is on; all others are off) 13. Operate your second peripheral device. ON ON ON (second peripheral device is on; all others are off) 14. Turn off your second peripheral device, and put your computer in "sleep" mode. In the Vista Operating System, this is done by going by selecting: Start, Shut Down, Sleep, and OK. Sleep mode is a special lower power, standby mode in which the computer turns off the display and hard drives. When you touch your mouse or keyboard after entering sleep mode, your computer quickly "wakes up." Record the steady-state power reading for sleep mode. SLEEP ON until turned OFF by sleep mode. OFF X 15. Get out your stopwatch and start it as soon as you touch the mouse or keyboard to recover from sleep mode. Stop the stopwatch when the screen returns and the mouse is responsive. Record the time to recover from sleep mode here: __________________(sec). This time will be used to see what the trade-off is between power and time for each of the three "shut down" modes: Sleep, Hibernate, and Shut Down. Recovery from SLEEP MODE ON OFF X X 16. Put your computer in "hibernate" mode. In the Vista Operating System, this is done by selecting: Start, Shutdown, Hibernate, and OK. Hibernate mode is a special lower-power standby mode that can be thought of as a deeper state of sleep than sleep mode. Before hibernating, the computer copies system data to a reserved area on the hard drive before completely turning itself off. On recovery from hibernate mode, the computer returns to the same operating state it was in before hibernation was started. HIBER-NATE ON OFF X 17. Zero out the stopwatch, and start it again as soon as you touch the mouse or keyboard. Stop the stopwatch when the display returns, and the mouse is responsive. Record the time to recover from hibernate mode here: ________________(sec) Recovery from HIBER-NATE MODE ON OFF X X 18. Shut down the computer completely. In the Vista Operating System, this is done by selecting: Start, Shut Down, Shut Down, Shut Down, OK. OFF ON OFF X 19. Zero out the stopwatch, and start it again as soon as you power on the computer. Stop the stopwatch when the display returns, and the mouse is responsive. Record the time for a boot up from complete shut down here: _________________(sec) ON ON OFF X X
- You will need to conduct two more trials of your experiment, by repeating the steps in the Power Usage Data Table two more times.
- Create a fourth data table that averages the peak power (if measured), steady-state power, and recovery times you measured in your three trials.
- Plot, in bar chart form, the average peak power (in watts) on the y-axis vs. the test action on the x-axis. You can make the bar chart by hand, or use a website like Create a Graph to make the graph on a computer and print it.
- Plot, in bar chart form, the average steady-state power (in watts) on the y-axis vs. the test action on the x-axis.
- Which hardware component used the most peak power? Which used the most steady-state power? What is the best way to set-up your monitor? At night, do you think it is better to turn off your computer completely, put it in sleep mode, or put it in hibernate mode? What is the time trade-off for each of these modes?
Ask an Expert
Global Goals
The United Nations Sustainable Development Goals (UNSDGs) are a blueprint to achieve a better and more sustainable future for all.
/-/https/www.sciencebuddies.org/cdn/Files/19755/5/E-WEB-Goal-12.png)
Variations
- For Figure 2, replace the power cords of your computer system going into the power strip with the power cords of your home TV system. Compare the power usage while watching a DVD on a TV system with the power usage of watching a DVD on a computer. Which is more efficient?
- Compare the power usage between playing a video game on your PC with playing a video game on your WiiTM or other game system. Are there big energy savings by playing video games on a devoted game system like a Wii?
- Profile the power usage of a computer system using a desktop computer, and the power usage of a computer system using a laptop. What kind of energy savings do you get by switching to a laptop?
- Get a monthly electric bill for your family, and see what the power company charges per kilowatt hour. Using the steady-state power measurements you collected, determine how much it costs to operate each of the components for one month. You will have to estimate or measure how much they are used on average per day.
- Measure power usage for major hardware components while they are undergoing benchmark tests.
Careers
If you like this project, you might enjoy exploring these related careers:
/-/https/careerdiscovery.sciencebuddies.org/cdn/Files/1261/17/iStock-1250621440.jpg)
/-/https/careerdiscovery.sciencebuddies.org/cdn/Files/1832/17/iStock-1158126977.jpg)
/-/https/careerdiscovery.sciencebuddies.org/cdn/Files/1153/17/pexels-photo-1181354.jpg)

/-/https/img.youtube.com/vi/iqtQ8Ikq-Ew/0.jpg)
/-/https/img.youtube.com/vi/mabHwDuuLfU/0.jpg)
/-/https/img.youtube.com/vi/GWIzEp2FZJE/0.jpg)