Abstract
Your drinking water probably started out brown and muddy. Are you surprised? Maybe you were picturing it flowing from a clean mountain spring instead? All over the world, including in 68% of American homes, people get their drinking water from rivers, lakes, and other surface waters. This water is filled with dirt, debris, and other contaminants as it travels hundreds of miles. So, how does your drinking water go from brown and muddy to crystal clear? Often, flocculants—substances that help clump particles together so that they can be filtered out—are used to turn water from turbid to clear. How do flocculants work? See for yourself in this science project!
Summary
Some basic knowledge in chemistry would be helpful, but is not necessary.
A kit is available from our partner Home Science Tools®. See the Materials section for details. For data analysis, a spreadsheet program, such as Google SheetsTM or Microsoft® Excel®, is helpful.
No issues
Recommended Project Supplies
/-/https/www.sciencebuddies.org/cdn/Files/9151/22/SB-SENSOR-electronics-sensor-kit-image.jpg)
Objective
Investigate the optimal flocculant concentration to clean up murky water.
Introduction
Do you know where your drinking water comes from? Sure, it comes out of your faucet, but how does it get there? Drinking water all over the world originates from either surface waters such as lakes, reservoirs, and rivers or from underground sources such as groundwater. In the United States, 68% of the population that gets water delivered from community water systems receive their drinking water from surface waters. Large river systems, such as the Mississippi River and its tributaries, are examples of surface waters that millions of people rely on for their drinking water. In fact, the Mississippi River provides 23% of the public surface water supplies in the United States, and supplies 18 million people with drinking water every year! Surface waters often contain soil particles, organic matter, and dirt that make the water look murky and cloudy, as shown in Figure 1; it does not exactly look like water that you would want to drink, does it? The solids floating in the water are called total suspended solids (TSS). They are usually so small and light that it takes a long time until they settle to the bottom of the water body. This is a problem, as potentially dangerous bacteria can stick to these tiny particles, which makes the water unsafe to drink.
/-/https/www.sciencebuddies.org/cdn/Files/8088/12/aerial-jameson-island-big-muddy.jpg)
Figure 1. Surface waters, such as the Big Muddy River in Illinois, are a common source for drinking water.
(Image credit: by Hillebrand, Steve — US Fish and Wildlife Service, via Wikimedia Commons)
To become clean and clear, the water has to undergo several treatment steps before it is safe to drink. This cleanup happens in a drinking water treatment plant. One of the first steps in a treatment plant is getting rid of the total suspended solids with a process called flocculation. In this step, chemicals called flocculants or coagulants are added to the water; they help clump all the small particles together into bigger ones so they settle more readily to the bottom of the water supply, due to their increased weight. The way this works is shown in Figure 2. Most suspended solids in water have a negative surface charge and thus, repel each other, which prevents them from sticking together and makes them stay in suspension. However, if a chemical with an opposite (positive) charge is added to the water, the particles become neutralized and are able to cling together to form larger particles or microflocs. These settle down much faster and the water becomes much clearer.
/-/https/www.sciencebuddies.org/cdn/Files/8089/17/Flocculation-mechanism.png)
Most pollutants in water have a negative surface charge which repels them from other pollutants in the water. Positively charge flocculants can be added to contaminated water and will cause negatively charged particles to clump together and their increased weight will allow them to settle more quickly in the water.
Figure 2. During flocculation, the negative surface charges that repel individual particles are neutralized by the addition of positively charged flocculants (in this image, positively charged aluminum (Al3+) ions). This way, particles can clump together and build microflocs, which are able to settle down.
A common way environmental engineers assess drinking water quality is by measuring its turbidity, which is an optical determination of water clarity. The turbidity of water is based on the amount of light that is scattered by particles in the water. More particles mean that more light will be scattered and the water is more turbid. For this reason, total suspended solids and turbidity are closely related, and turbidity changes often indicate a change in total suspended solid concentrations in the water. The device for measuring turbidity is called a turbidimeter or nephelometer and measures light scattering. In light scattering, the incoming light bounces off of small, suspended particles, and is thus redirected away from its initial path. A number of factors affect the scattering of light by suspended particles. The concentration and the size of the particles are two such factors. The physical characteristics of the particles are clearly important, too. Another factor is the wavelength of the light. Blue light is scattered by the atmosphere more than red light is, which is why the sky looks blue. As sunlight passes through the atmosphere, the blue light is redirected, and we "see" it here on the ground. Sunsets are red/orange for the same reason—the sunlight has been depleted of blue colors by passing through the atmosphere.
You will build your own simplified turbidimeter for this science project. The instrument measures how much light is redirected, or scattered, at a 90° angle from the direction of the incoming light, as shown in Figure 3. Your turbidimeter will consist of a circuit that has a light source (a white light-emitting diode (LED)) and a light detector (a photoresistor). Your water solutions will be placed between the light source and the detector. Your measurement output will be the level of resistance from your detector, measured in ohms (Ω). The photoresistor has a high resistance in the dark, and its resistance decreases as light levels increase. As more light is scattered by your sample, more light reaches the detector, so the resistance decreases.
/-/https/www.sciencebuddies.org/cdn/Files/8090/12/turbidimeter-principle.png)
A turbidimeter works by measuring light that is reflected off particles suspended in water. A white LED will shine light through a water sample and any scattered light will be detected by a photoresistor that is connected to a multimeter. When light is reflected off a particle in the water and detected by the photoresistor a current will be visible on the multimeter.
Figure 3. Principle and setup (not to scale) of your self-made turbidimeter. Some of the incoming light from the white LED is scattered by suspended particles in your water sample, and is then detected by the detector (photoresistor) at an angle of 90° from the initial path of the light beam. The remaining light is transmitted through the liquid and emerges on the opposite side.
In this science project, you will perform a so-called jar test, which is a method of simulating a full-scale water treatment process in a jar. This type of test provides treatment plant operators with information on the efficiency of water treatment, depending on different concentrations of treatment chemicals, such as flocculants. You will use alum powder as a flocculant, which is an aluminum salt or, more specifically, KAl(SO4)2. The positively charged aluminum ions Al3+ neutralize the negatively charged particles in the water. In addition to water purification, alum is also commonly used as an antiseptic in cosmetics, for dyeing processes, and in the food industry for pickling. How clean do you think your water will get after adding alum powder? Get ready to find out in this science project!
Terms and Concepts
- Drinking water
- Community water system
- Total suspended solids (TSS)
- Drinking water treatment plant
- Flocculation
- Flocculant
- Coagulant
- Microfloc
- Turbidity
- Turbidimeter
- Nephelometer
- Light scattering
- Wavelength
- Light-emitting diode (LED)
- Photoresistor
- Resistance, ohms (Ω)
- Jar test
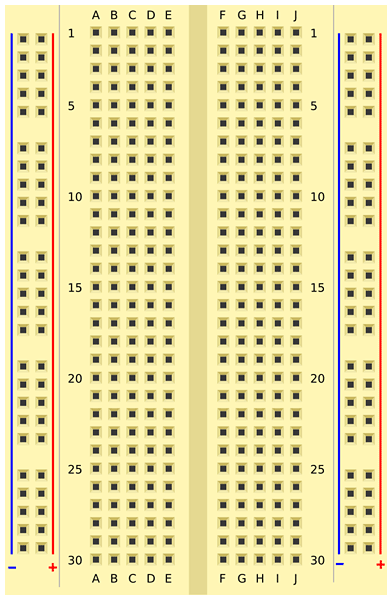
- Breadboard
- Standard
- Calibration curve
Questions
- What properties of particles determine how they contribute to the turbidity of water?
- How and where is turbidity regularly measured?
- What are the best ways to reduce turbidity of different waters?
- Why is it important to treat drinking water via flocculation?
- What other treatment processes are necessary to create clean and safe drinking water?
Bibliography
To find out more about drinking water in general, you can use these references:
- The USGS Water Science School. (2016, May 2). Water Questions & Answers. Retrieved July 25, 2024.
- American Water. (2011, April 8). Water and You: The Water Treatment Process. Retrieved June 14, 2016.
These references provide more information about water quality and turbidity:
- Fundamentals of Environmental Measurements. (2014, June 13). Turbidity, TSS, and Water Clarity. Retrieved June 6, 2016.
- Fundamentals of Environmental Measurements. (2014, September 5). Measuring Turbidity, TSS, and Water Clarity. Retrieved June 6, 2016.
Read more about flocculation and jar testing in these references:
- Sustainable Sanitation and Water Management (SSWM). (n.d.). Coagulation - Flocculation. Retrieved June 6, 2016.
- Satterfield, Z., Tech Brief, published by the National Environmental Services Center. (2005). Jar Testing. Retrieved July 25, 2024.
For help with the multimeter and breadboard circuit, use these resources:
- Science Buddies. (n.d.). How to Use a Multimeter. Retrieved May 9, 2016.
- Science Buddies. How to Use a Breadboard. Retrieved May 9, 2016.
Materials and Equipment 
Recommended Project Supplies
- Electronic Sensors Kit, available from our partner Home Science Tools®. You will need these items from the kit:
- Solderless breadboard (1)
- Jumper wires (3)
- Alligator clip leads (2)
- 9 V battery (1)
- 9 V battery snap connector (1)
- Photoresistor
- White LED (1)
- 220 Ω resistor (1)
- Digital multimeter
- You will also need to gather these items, not included in the kit:
- Clear tape
- Permanent marker
- Dry, fine soil from your garden or another source (about 20–30 g)
- Fine-mesh sieve
- Mortar and pestle
- Plastic cups 7 oz (14)
- Transfer pipettes (13), available from Amazon
- Measuring cup
- Regular spoons (8)
- Cuvettes 3.5 mL (frosted or grooved sides are fine) (25), available from Amazon
- Timer
- Digital scale with 0.1 g increments. A digital scale that would be suitable is the Fast Weigh MS-500-BLK Digital Pocket Scale, available from Amazon
- A sturdy stick, about 20 inches long (1)
- Strong tape, such as gaffer tape
- Piece of dark (black, brown, or dark blue) construction paper
- Alum, available in the spice section at many grocery stores
- Bowls with at least 1 L capacity (2)
- Bowl or cardboard box to cover the turbidimeter
- Pen
- Lab notebook
Disclaimer: Science Buddies participates in affiliate programs with Home Science Tools®, Amazon.com, Carolina Biological, and Jameco Electronics. Proceeds from the affiliate programs help support Science Buddies, a 501(c)(3) public charity, and keep our resources free for everyone. Our top priority is student learning. If you have any comments (positive or negative) related to purchases you've made for science projects from recommendations on our site, please let us know. Write to us at [email protected].
Experimental Procedure
Building Your Turbidity Meter
In this section, you will assemble a circuit on a breadboard. If you have never used a breadboard before, you should refer to the Science Buddies resource reference How to Use a Breadboard for Electronics and Circuits before you proceed. You can follow a step-by-step slideshow that will show you how to put components in the breadboard one at a time. Alternatively, Table 1 lists each component and its location on the breadboard. Important: Read the following notes before you proceed.
- Resistors are marked with colored bands. These colors do matter. Make sure you pick the right resistors for each step, according to the markings.
- It matters which direction some of the components are facing. Make sure you read the slideshow captions for any special notes about inserting each part.
- This section only shows you how to assemble the circuit. For a detailed explanation of how the circuit works, see the Help section.
/-/https/www.sciencebuddies.org/cdn/Files/8087/9/slideshow-11-turbidity.png)
/-/https/www.sciencebuddies.org/cdn/Files/7834/24/slideshow-1-colorimeter.png)
/-/https/www.sciencebuddies.org/cdn/Files/8078/9/slideshow-2-turbidity.png)
/-/https/www.sciencebuddies.org/cdn/Files/8079/9/slideshow-3-turbidity.png)
/-/https/www.sciencebuddies.org/cdn/Files/8080/9/slideshow-4-turbidity.png)
/-/https/www.sciencebuddies.org/cdn/Files/8081/9/slideshow-5-turbidity.png)
/-/https/www.sciencebuddies.org/cdn/Files/8082/9/slideshow-6-turbidity.png)
/-/https/www.sciencebuddies.org/cdn/Files/8083/9/slideshow-7-turbidity.png)
/-/https/www.sciencebuddies.org/cdn/Files/8084/9/slideshow-8-turbidity.png)
/-/https/www.sciencebuddies.org/cdn/Files/8085/9/slideshow-9-turbidity.png)
/-/https/www.sciencebuddies.org/cdn/Files/8086/9/slideshow-10-turbidity.png)
Slideshow with step-by-step instructions viewable online.
| Part name | Picture | Breadboard Symbol | Location |
|---|---|---|---|
| 9 V battery | /-/https/www.sciencebuddies.org/cdn/Files/7852/34/9V-battery.jpg) |
/-/https/www.sciencebuddies.org/cdn/Files/7853/33/BB-battery.jpg) |
Red wire to (+) bus Black wire to (-) bus |
| Photoresistor | /-/https/www.sciencebuddies.org/cdn/Files/7854/33/photoresistor.jpg) |
/-/https/www.sciencebuddies.org/cdn/Files/7855/36/BB-photoresistor.png) |
F24, F26 |
| White LED | /-/https/www.sciencebuddies.org/cdn/Files/7856/34/white-LED.png) |
/-/https/www.sciencebuddies.org/cdn/Files/7857/43/BB-LED.png) |
Long lead to B17 Short lead to D16 |
| Jumper wires (3) | /-/https/www.sciencebuddies.org/cdn/Files/7883/32/jumper-wire-black.png) |
/-/https/www.sciencebuddies.org/cdn/Files/7859/35/BB-jumper-wire-black.png) |
J24 to multimeter J26 to multimeter A17 to (+) bus |
| 220 Ω resistor | /-/https/www.sciencebuddies.org/cdn/Files/7220/16/220-resistor-picture.jpg) |
/-/https/www.sciencebuddies.org/cdn/Files/7861/32/BB-resistor.png) |
E16 to (-) bus |
Table 1. Components for the turbidity meter circuit (Image credits: Jameco and Fritzing).
Testing Your Turbidity Meter
After you have finished building your circuit, testing the turbidity meter is necessary to ensure that all the electronic components are connected correctly and your device works as expected. Note: Stray light will cause problems and may result in fluctuating data. Perform the readings in a dimly lit room if stray light is a problem, and make sure to always place the cuvettes into your device the same way. If the sides of your cuvettes are not all clear but two of them are grooved or frosted, make sure that the clear side is always facing towards the LED and the frosted or grooved side is facing towards the photoresistor. Place a bowl or cardboard box upside-down over your breadboard during measurement to block out surrounding light. If you get fluctuating data, make sure to check if your cuvettes are free of smears or dirt on the outside and that there are no air bubbles sticking to the sides.
- Cut a small piece of construction paper and roll it into a tube that just fits on the head of the LED. The tube length should be about 2 cm. Place the tube on the head of the LED and attach it with some tape so it is not able to slide off.
- Place an empty cuvette upside-down over the photoresistor. Make sure that for this cuvette the clear side faces towards the front of the photoresistor. Bend the photoresistor leads as needed to fit underneath the cuvette. Use tape to hold the cuvette over the photoresistor in place. But do not block the light path!
- The light path from the LED and the tube should be exactly aligned with the height of the photoresistor, as shown in Figure 4. Bend the wires on the LED and photoresistor for adjustment, if needed.
/-/https/www.sciencebuddies.org/cdn/Files/8091/12/white-LED-photoresistor-alignment-cuvette.jpg)
Figure 4. The light path of the LED should be directly aligned with the height of the photoresistor.
- Set up the multimeter to measure the resistance of the photoresistor.
- Plug the black multimeter probe into the port labeled COM.
- Plug the red multimeter probe into the port labeled VΩmA.
- Turn the dial setting to 200 kΩ.
- Turn the multimeter's power switch ON.
- Make sure you remembered to use the alligator clips to attach the multimeter probes to the jumper wires connected to the photoresistor coming from J24 and J26.
/-/https/i.ytimg.com/vi/ts0EVc9vXcs/maxresdefault.jpg)
- As you connected the jumper wire from A17 to the power (+) bus already, your LED should still be turned on.
- Cover the circuit (but not the multimeter) with a bowl to block ambient light.
- Read the resistance across the photoresistor and record it in your lab notebook.
- Note the units of the resistance. A "k" indicates kilo-ohms (kΩ).
- If your multimeter screen displays a "1.", that means the resistance is too high for the dial setting. Turn the dial up to the next highest range (for example, from 200 k to 2000 k) and check again.
- If this is your first time using a multimeter, refer to the Science Buddies resource How to Use a Multimeter, specifically the section How do I Measure Resistance?, to learn more.
- Remove the bowl and turn off the LED by removing the jumper wire from the power (+) bus.
- Cover the circuit with the bowl again. In the dark, the resistance should be in the mega-ohm range. Remember that you may need to adjust the dial setting to get a measurement. Record the resistance in your lab notebook.
- Remove the bowl and turn off the multimeter to conserve battery power.
Calibrating Your Turbidity Meter
Now that you have set up and tested the turbidity meter, the next step is to make the standard solutions to calibrate it. You will make a series of dilutions containing different amounts of soil, or total suspended solids (TSS), with known concentration (as shown in Figure 5) and measure them with your turbidity meter to create a calibration curve. Each dilution is made by consecutively diluting your turbid water by half.
/-/https/www.sciencebuddies.org/cdn/Files/8092/12/standards-7.jpg)
Figure 5. Standard solutions with different amounts of total suspended solids for calibration of the turbidimeter.
- Gather some dry soil from your garden or another source. Use the fine-mesh sieve to filter out larger materials, such as stones or sticks and leaves. You will need about 15–20 g of sifted soil.
- Transfer the sifted soil into a mortar. Grind the soil really well until you have a very fine, homogeneous soil powder.
- Take seven clean plastic cups and label them #1–7 with your permanent marker.
- Use the measuring cup to pour 100 mL of tap water into the first cup (#1). Add 50 mL of water into cups #2–7 each.
- With the digital scale, weigh 0.5 g of your ground, very fine soil, and mix it into cup #1. Stir with a clean spoon until you get a nice turbid solution. The solution should stay turbid for a while once you stop stirring, but it is fine if some of the soil particles settle to the ground immediately.
- Use the measuring cup to pour 50 mL from cup #1 into cup #2 and mix with a clean spoon. Make sure that you stir cup #1 just before you pour some of it into the measuring cup so that you also transfer the suspended solids that have settled from cup #1 to cup #2.
- Thoroughly rinse the measuring cup and mix 50 mL from cup #2 with the water in cup #3. Again, make sure to stir cup #2 just before you transfer the liquid so the particles that tend to settle on the bottom can also be transferred.
- Repeat the two-fold dilutions for cups #4–7.
- Label seven clean cuvettes #1–7 (at the very top of the cuvette to not block the light path with your writing) and transfer the seven standard solutions into the matching cuvette using a fresh or rinsed transfer pipette for each one. Make sure you get a good representative sample into the cuvette by stirring the standard solutions again before transferring them into the cuvette. Note: The cuvettes hold approximately 3 mL of solution.
- Set the multimeter to read resistance again. Remember that you might have to adjust the range as you take different readings.
- Place your first standard sample between the white LED and the photoresistor, as shown in Figure 6. Before you put the standard in the turbidity meter, cover the cuvette with your thumb and shake it really hard to get all the settled particles distributed within the solution. The little tube on the LED head should touch the cuvette and should be positioned approximately in the middle of the cuvette. If your cuvettes have frosted or grooved sides, make sure this side is facing toward the photoresistor and the clear side is facing toward the LED.
/-/https/www.sciencebuddies.org/cdn/Files/8093/12/white-LED-measuring-sample.jpg)
Figure 6. Setup of the turbidity meter for measuring your standard solutions and samples. Note that in these pictures, the LED is switched on, but the setup is not covered with a bowl yet.
- Plug in the jumper wire from A17 into the power (+) bus to turn on the LED. Cover the breadboard with a bowl and slowly count to 5. Then read the resistance on the multimeter and record the data in your lab notebook. As for your standards and samples some of the particles tend to settle to the bottom once you shake the solution, the turbidity will change over time. Therefore, it is important to read the resistance values for each standard and sample at the same time after shaking it. If you find that your data fluctuates a lot, try to reduce the amount of ambient light by going to a darker room, or wait until nighttime to do your experiment. Note: Solutions that are very clear, such as the standards with low concentrations of suspended solids, tend to result in more data fluctuations.
- Remove the first standard and replace it with the cuvette containing the next standard solution. Shake the cuvette again before placing the standard in your device. Cover the breadboard with the bowl, and again slowly count to 5. Then write down the resistance for this solution. Continue the measurements for each of your seven standards.
- Repeat the measurements with the entire set of standards two more times.
- Make a data table in your lab notebook showing the dilutions and concentrations of the total suspended solids in all your standards (#1 = 5 g/L, #2 = 2.5 g/L, etcetera) together with all three recorded resistance measurements for each solution. The resistance should be higher as the solutions get clearer.
Conducting Your Flocculation Experiment
Now that you know how the turbidity of your sample—or the amount of suspended solids in your water—relates to the resistance measured with your turbidity meter, you can monitor the cleanup of your murky water sample during your jar test. You will test six different flocculant concentrations to find out which one of them results in the best cleanup process.
- Build a stirring device that allows you to simultaneously stir six samples.
- Line six cups up next to each other and label them #0–#5.
- Take a long stick and, with tape, attach 6 spoons to the stick. Position the spoons so that each spoon fits into one of the cups once you hold the stick above the cups, as shown in Figure 7.
/-/https/www.sciencebuddies.org/cdn/Files/8094/12/stirring-device.jpg)
Figure 7. Stirring device that allows for simultaneous stirring of six sample solutions. Note that this image shows glass Mason jars, but you can also do the experiment in plastic cups.
- Take one of your bowls and fill it up with 1,000 mL of tap water using the measuring cup.
- Use the digital scale to weigh 5 g of your ground soil and mix it into the bowl with water.
- Dispense 150 mL of this mixture into each of the six cups, making sure that you stir the solution with a clean spoon each time, just before you transfer the solution into a new cup, to make sure to also transfer the particles that tend to settle on the bottom.
- Prepare your alum flocculant solution.
- Fill the second bowl with 1,000 mL of tap water using the measuring cup.
- Weigh 7.5 g of alum using the digital scale and add it to the bowl with water. Stir the solution with a spoon until everything is dissolved.
- Line up all your cups containing the turbid water next to each other. With a permanent marker, draw a line on each cup, halfway between the bottom of the cup and the top of the solution, as shown in Figure 8. Note: It is important to extract all your samples from the same depth in your filled water cups (from where you made the line on the jars or cups) to be able to compare the flocculation and settling process in each cup.
/-/https/www.sciencebuddies.org/cdn/Files/8095/12/water-samples.jpg)
Figure 8. Turbid water samples before adding different amounts of flocculant (alum). Note that although this image shows glass Mason jars, you can also use plastic cups for your experiment.
- Pre-label one set of six clean cuvettes for each of your sampling time points (0 minutes, 2 minutes and 15 minutes). On each cuvette, first write the cup number (#0–#5) and the time point ("0", "2," and "15"). Remember to only write on the very top of the cuvette. Put the cuvettes aside until they are needed.
- Label six transfer pipettes #0–5 and use one for each cup to transfer about 3 mL of liquid from each cup into the first set ("0") of labeled cuvettes. Make sure to stir the solutions (you can use the transfer pipette for that) first before you take the sample. When taking samples, make sure the tip of the transfer pipette lines up with the permanent marker line on the outside of the cup. Put the filled cuvettes aside for now and make sure you do not accidentally knock them over.
- Rinse the transfer pipettes with tap water by sucking up and squirting out tap water a couple of times.
- Add different volumes of your prepared alum solution to each of the cups, according to Table 2, resulting in six solutions with a different alum concentration in each.
| Cup number [#] | Volume of alum solution added [mL] |
Concentration of alum [mg/L] |
|---|---|---|
| 0 | 0 | 0 |
| 1 | 0.5 | 25 |
| 2 | 1.5 | 75 |
| 3 | 2.5 | 125 |
| 4 | 3.5 | 175 |
| 5 | 4.5 | 225 |
Table 2. Added amounts and concentration of alum in each cup.
- Set your timer for 2 minutes and use your self-made stirrer to stir each cup simultaneously for 2 minutes, as fast as you can, but being careful not to knock the cups over.
- Stop stirring after 2 minutes and set your timer again for 2 minutes. Make sure not to disturb the solutions anymore once you have stopped stirring. Depending on the added alum concentrations, microflocs might be forming in your solutions and start settling down.
- Prepare your second set of labeled cuvettes ("2") and after 2 minutes of settling time in the previous step, use your rinsed transfer pipettes to take a sample of each cup. Do not forget to take the sample at the same depth (where you put the permanent marker line). Transfer about 3 mL of sample from each cup into the labeled transfer pipettes. This time, do not stir the solutions! Put the full cuvettes to the side until measurement.
- Set your timer again for 13 minutes and start it. Observe the flocculation process in each cup. Prepare your third set of labeled cuvettes ("15") and after 13 minutes use your rinsed transfer pipettes again to take a sample of each cup. Do not forget to take the sample at the same depth as before (where you put the permanent marker line). Transfer about 3 mL of sample from each cup into the labeled transfer pipettes. Again, do not stir the solutions! Put the full cuvettes to the side until measurement.
- You can leave the cups for further observation, although you will not take any more measurements.
Measuring Your Samples
- Get all your samples from each time point ready ("0", "2," and "15").
- Make sure you are in a dark room with minimal light and have your turbidity meter ready with the multimeter leads still attached to the jumper wires.
- Set the multimeter to read resistance again. Remember that you might have to adjust the range as you take different readings.
- Plug in the jumper wire from A17 into the power (+) bus to turn on the LED if it is not turned on yet.
- Start with measuring the first sample solution from time point "0". Place the cuvette in between the white LED and the photoresistor, as you did with the standards before. Remember to face the clear side of the cuvette towards the LED and the frosted or grooved side towards the photoresistor. Before you put the sample in the turbidity meter, cover the cuvette with your thumb and shake it really hard to get all the settled particles mixed in the solution. Cover the breadboard again with the bowl and slowly count to 5. Then write down the resistance for this sample. Continue the measurements for each of your samples of time point "0". Then repeat the measurements with the entire set of samples two more times.
- Continue measuring the next time point samples ("2") and then proceed to the last time point samples ("15"). Make sure to also repeat the measurements with all samples for each time point two more times. Note: Remember that very clear solutions, such as sample solutions with low concentrations of suspended solids, tend to result in more data fluctuations.
Analyzing Your Data
- Open a spreadsheet and enter the data (the TSS concentration [g/L] and resistance values of your standards) for your calibration curve. Calculate the average for your three resistance readings for each standard.
- Graph the average resistance of your three readings on the y-axis versus the TSS concentration of the standard solutions in g/L on the x-axis. You will notice that the relationship between measured intensity of scattered light (or the resistance) and concentration is nonlinear. You can linearize the data by performing a base-10 logarithmic transformation of your data. Simply graph the average resistance data on the y-axis versus the log10 of the total suspended solids concentration of your standards on the x-axis. Now you should get a linear calibration curve.
- Add a trend line to the linearized data and display its equation and its correlation factor R2.
- For each time point (0, 2, and 15 minutes), enter your resistance data into the spreadsheet for each cup and calculate the average of your three readings for each sample.
- Using your calibration curve, determine the concentration of total suspended solids in each of your sample solutions for each time point. Remember that the results from your calculations will be the log(TSS). To get the real concentration of TSS, you have to convert your result from log(TSS) to TSS by taking your calculated result from the calibration curve and raise 10 to that number.
- Make a graph that shows the settling time (0, 2, and 15 minutes) on the x-axis and the calculated concentration of total suspended solids (in g/L) on the y-axis. Do you see that the amount of total suspended solids changes over time?
- Calculate the TSS decrease over time for each of the cups/alum concentrations in percent. The TSS concentration at time point 0 will be 100%. To calculate the percentage for each of the following time points, use Equation 1, as follows:
- Finally, make a bar graph showing the alum concentration added to each jar on the x-axis and the percentage of TSS on the y-axis for each time point. How do the graphs compare for each alum concentration and the control without alum addition? From this graph, can you tell which alum concentration is the optimal one? Do you think increasing the alum concentration even more would make sense?
Troubleshooting
For troubleshooting tips, please read our FAQ: How Flocculation Cleans Up Drinking Water.
Ask an Expert
Global Goals
The United Nations Sustainable Development Goals (UNSDGs) are a blueprint to achieve a better and more sustainable future for all.
/-/https/www.sciencebuddies.org/cdn/Files/19749/5/E-WEB-Goal-06.png)
Variations
- In this experiment, you made your own turbid water using soil, grinding it, and mixing it with tap water. But what about real surface water samples? Find some rivers, streams, or lakes and take some water samples (including some of the sediment to make it murky). Repeat the experimental procedure and find out what alum concentration works best for real surface water samples. You might have to adjust the alum concentration range, depending on your samples.
- Alum is just one flocculant that is used in a drinking water treatment plant. Test if other types of flocculants, such as polymer flocculants, which can be found in some pool water clarifiers work as well as alum.
- After adding the alum solution, you stirred the solutions for 2 minutes. What happens if you do not stir the water or stir it longer or for less time? Find out how the stirring behavior changes the flocculation process. Does stirring the solutions slowly or quickly make a big difference?
- How do the water conditions affect the flocculation process? What if the surface water has a fluctuating pH? You can test how the pH affects flocculation by adding an acid or a base to your water, such as lemon juice or baking powder. Do you think this will help the flocculation process or prevent floc formation?
Frequently Asked Questions (FAQ)
/-/https/www.sciencebuddies.org/cdn/Files/8189/20/photoresistor-LED-circuit-diagram.png)
Figure 9. Circuit diagram for the circuit used in this project.
Careers
If you like this project, you might enjoy exploring these related careers:
/-/https/careerdiscovery.sciencebuddies.org/cdn/Files/20218/6/EnvEng_KeyPhoto.jpg)
/-/https/careerdiscovery.sciencebuddies.org/cdn/Files/1281/17/pexels-photo-3580281.jpg)
/-/https/careerdiscovery.sciencebuddies.org/cdn/Files/1870/17/iStock-497975685.jpg)
/-/https/careerdiscovery.sciencebuddies.org/cdn/Files/1223/17/iStock-971549326.jpg)
Contact Us
Our kits are developed in partnership with Home Science Tools®. If you have purchased a kit for this project, Home Science Tools® is pleased to answer any questions not addressed by the FAQ above.In your email, please follow these instructions:
- Include your Home Science Tools® order number.
- Please describe how you need help as thoroughly as possible:
Examples
Good Question I'm trying to do Experimental Procedure step #5, "Scrape the insulation from the wire. . ." How do I know when I've scraped enough?
Good Question I'm at Experimental Procedure step #7, "Move the magnet back and forth . . ." and the LED is not lighting up.
Bad Question I don't understand the instructions. Help!
Good Question I am purchasing my materials. Can I substitute a 1N34 diode for the 1N25 diode called for in the material list?
Bad Question Can I use a different part?
Contact Support

/-/https/img.youtube.com/vi/O_u_jYB_abY/0.jpg)
/-/https/img.youtube.com/vi/AOVD7WgFP2s/0.jpg)
/-/https/img.youtube.com/vi/6fx0PEx0g5k/0.jpg)