Abstract
Did you know that when you use fertilizer in your garden, it can eventually reach a lake, stream, or pond? There are many different chemicals present in fertilizers. How will they affect the aquatic organisms in the ecosystem? In this science project you will get to find out!Summary
Sara Agee, Ph.D., Science Buddies

Objective
Test the effects of liquid fertilizer on an aquatic environment containing small aquatic animals and plants.
Introduction
Fertilizers are chemicals that are added to the soil to increase the growth of plants in yards, gardens, or large agricultural facilities. The effect on crops can be increased growth, but fertilizers can have a negative impact on surrounding organisms in the soil.
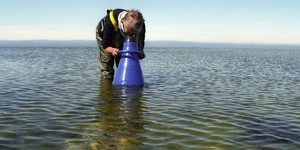
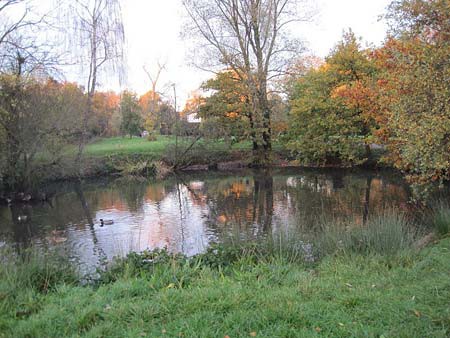
When a heavily fertilized field is irrigated, excess water can flow along the surface of the land and pick up the fertilizers. This is known as surface runoff. The fertilizer-rich surface runoff can directly flow into nearby streams, lakes, or ponds, like the one shown in Figure 1, below. Additionally, chemicals present in the fertilizer can also infiltrate the ground water system and contaminate it. This polluted ground water can also make its way into nearby ponds, streams, or lakes. What happens to the aquatic organisms that are present in the environment when chemical fertilizers are present? How do the fertilizers affect the organisms' ecosystem?
In this science project you will test the effect of liquid fertilizer on an aquatic environment. Each aquatic environment will be a mixture of small aquatic plants and animals. By adding different brands of fertilizer, you can test how they affect the environment. Which fertilizers are the best choice for the environment?
Terms and Concepts
- Fertilizers
- Surface runoff
- Ground water
- Contamination
- Ground water pollution
- Ecosystem
Questions
- How will fertilizer affect an aquatic environment?
- Will all of the organisms be affected similarly or differently?
- Which brand(s) of fertilizer will cause an effect?
- Are organic fertilizers less toxic to aquatic ecosystems?
Bibliography
This project was adapted from the Duckweed Bio-Assay protocol from Cornell University:- EIP, Date unknown. Assessing Toxic Risk: Student Edition, Environmental Inquiry Program (EIP), Cornell University. Retrieved July 3, 2006.
- Habeck, M., 2006. Toxics, Eco-USA.net. Retrieved July 3, 2006.
- PAN, 2006. The PAN Pesticides Database, Pesticide Action Network (PAN), San Francisco, CA. Retrieved July 3, 2006.
- National Center for Education Statistics. (n.d.). Create a Graph. Retrieved August 19, 2008.
Materials and Equipment
- You will need these items from Something's Fishy About That Fertilizer kit, available from Carolina Biological Supply Company, a Science Buddies Approved Supplier:
- 100 mL graduated cylinder. Alternatively, a metric measuring cup may be used.
- pH test strips
- Small aquatic animals, such as small pond snails or Daphnia (at least 20). Pick one or two different types. Alternatively, these may be available from pet stores, aquarium supply stores, bait shops, or ponds.
- Note If you want to use Daphnia, you should have watering pipets, which are available from Carolina Biological, or medicine droppers, which are available in grocery stores, to easily move the Daphnia from one container to another.
- Small aquatic plants, such as duckweed or Elodea (at least 40 if you are using smaller plants, like duckweed, or at least 12 if you are using larger plants, like Elodea). Pick one or two different types. Alternatively, these may be available from aquarium supply stores, ponds, or plant nurseries.
- You will also need to gather these items, not included in the kit:
- Large, sealable, reusable plastic containers with lids, e.g., Glad or Zip-lock (4). These should each hold at least 1400 mL, or about 6 cups.
- Permanent marker for labeling
- Distilled water (2 gal.). This is available in most grocery stores.
- Different brands of liquid fertilizer (3). You can find these at plant nurseries, the plant section of a hardware store, or through online suppliers such as Amazon. These may also be called "plant food," but you will want to confirm with a sales person at the store that these are also considered fertilizers.
- Lab notebook
Disclaimer: Science Buddies participates in affiliate programs with Home Science Tools, Amazon.com, Carolina Biological, and Jameco Electronics. Proceeds from the affiliate programs help support Science Buddies, a 501(c)(3) public charity, and keep our resources free for everyone. Our top priority is student learning. If you have any comments (positive or negative) related to purchases you've made for science projects from recommendations on our site, please let us know. Write to us at scibuddy@sciencebuddies.org.
Experimental Procedure
- Rinse each container thoroughly with water. Do not use soap because it can coat the plastic container and may be harmful to the organisms in your experiment.
- Assign a number (from 1 to 3) to each fertilizer you use. Use a permanent marker to label the fertilizers' bottles, or just write the numbers you assigned in your lab notebook.
- Label each container "1," "2," or "3" with a permanent marker. Also label one container "Control."
- In your lab notebook, make a data table like Table 1, to record your data in.
- Use a graduated cylinder or metric measuring cup to prepare the solutions for each container according to Table 1. Prepare one container for each fertilizer, making sure the numbers on the containers match the ones you assigned to the fertilizers. In the container you labeled "Control," only fill it with distilled water, but no fertilizer, since it is your positive control. Use bottled distilled water, not tap water, because tap water may contain chemicals, like chlorine or chloramine, harmful to aquatic life.
| Fertilizer Number | Amount of Water (mL) |
Amount of Fertilizer (mL) |
Total Volume (mL) |
pH | Observations |
| 1 | 975 mL | 25 mL | 1000 mL | ||
| 2 | 975 mL | 25 mL | 1000 mL | ||
| 3 | 975 mL | 25 mL | 1000 mL | ||
| Control (distilled water only) | 1000 mL | 0 mL | 1000 mL |
- Check the pH of each container with your pH test strips and record the data in your data table. Also record any observations about the fertilizer or container you put it in.
- Evenly distribute the aquatic animals into each container, putting at least 5 into each container. If you are using more than one type of animal, make sure there is the same number of each animal type in each container.
- If you are using Daphnia, you can use a watering pipet or medicine dropper to move them from one container to another.
- Put 3 to 10 plants into each container, depending on the size of the plant.
- For example, if you are using small duckweed plants, 10 is a good amount, while if you are using the larger Elodea plants, 3 plants in each container is a better amount.
- If you are using duckweed, make sure that each plant has a stem (the part sticking down).
- If you are using large Elodea plants, you can carefully cut them into smaller pieces, about one or two inches long, so it is easier to count their leaves.
- In your lab notebook, make data tables like Table 2 and Table 3. In Table 2, write down the total number of animals in each container. In Table 3, write down the total number of plant leaves in each container.
- Note: If you are using more than one type of animal or plant, you can make another data table like Table 2 or Table 3 and separately record each type of animal or plant in its own data table.
- Each day, for five days, write down your observations in your data tables. Specifically, count and write down the total number of animals that are alive in each container, and the total number of plant leaves in each container.
| Fertilizer Number | Number of Animals Living | ||||
| Day 1 | Day 2 | Day 3 | Day 4 | Day 5 | |
| 1 | |||||
| 2 | |||||
| 3 | |||||
| Control (distilled water only) | |||||
| Fertilizer Number | Number of Leaves on Plants | ||||
| Day 1 | Day 2 | Day 3 | Day 4 | Day 5 | |
| 1 | |||||
| 2 | |||||
| 3 | |||||
| Control (distilled water only) | |||||
- Graph your results.
- You can make line graphs by hand or on a computer using a program like Create a Graph and then print the graphs out.
- Make one line graph that shows the number of animals living in each container over time. On the horizontal axis (x-axis) put the time (in days). On the vertical axis (y-axis) put the number of animals living. Make a line for each container you tested, including the control.
- Note: If you tested more than one type of animal, you can make a separate graph for each animal type.
- Make one line graph that shows the number of plant leaves in each container over time. On the x-axis put the time and on the y-axis put the number of plant leaves. Make a line for each container you tested, including the control.
- Note: If you tested more than one type of plant, you can make a separate graph for each plant type.
- Analyze your results and see if you can draw conclusions about how the different fertilizers affected the animals and plants.
- Did one type of fertilizer affect the animals more than another type of fertilizer? What about the plants?
- Did the animals and plants respond similarly or differently to the fertilizers?
- Overall, which seemed to be the least toxic? Which seemed to be the most toxic?
Ask an Expert
Global Connections
The United Nations Sustainable Development Goals (UNSDGs) are a blueprint to achieve a better and more sustainable future for all.

Variations
- In this experiment you tested different brands of fertilizer, but what about different amounts of fertilizer? Try an experiment making different dilutions of fertilizer in your bowls. What are the exposure limits for each of the different organisms in your study?
- Different fertilizers can have different chemicals in them. Do some research on the types of chemicals commonly found in different fertilizers. Based on your research, predict which chemicals might be more, or less, harmful on aquatic environments. Then repeat this experiment but specifically compare fertilizers with different chemicals in them to test your prediction. Is your prediction correct or incorrect?
- Try these other Science Buddies experiments to test the effects of toxins on aquatic environments:
Careers
If you like this project, you might enjoy exploring these related careers: