Looking Downstream: Could Nanosilver in Consumer Products Affect Pond Life?
Abstract
Do you know that many consumer products, such as sports clothes, cosmetics, and even food containers contain tiny silver particles? These so-called nanoparticles—usually 1–100 nanometers (a billionth of a meter) in size—are toxic to bacteria and fungi and therefore, are used to prevent them from growing on everyday items you use. But what happens if the silver nanoparticles get into the water; for example, when you wash off your makeup or clean your clothes? Do they affect freshwater organisms, and what about their effects on the environment? In this science project you will investigate how a specific freshwater organism, Daphnia magna, responds to the exposure to different concentrations of nanosilver.Summary
This science project is a collaboration between Science Buddies and the Education Division of California (UC) Center for Environmental Implications of Nanotechnology (CEIN).
Edited by Svenja Lohner, PhD, Science Buddies

Objective
Investigate the effects of different nanosilver concentrations on the aquatic organism Daphnia magna.
Introduction
When thinking about silver, beautiful jewelry or coins probably come into your mind first. But did you know that silver can also be in your clothes, your sunscreen, or even your toothpaste? So why are these products not as shiny as coins, rings, or necklaces? The reason is that the silver particles contained in these products are so tiny that you do not see them. They are only 1–100 nanometers (nm) wide (1 nm is one billionth of a meter (m) long, or 1.0x10⁻⁹ m)—that is about 50,000 times smaller than the diameter of a strand of hair! This is why they are also called nanoparticles. Nanoparticles can come in many different materials, sizes, or shapes, and all these features change how these particles behave. So why is there nanosilver, which when suspended in a liquid is also called colloidal silver, in consumer products? It turns out that silver does have a special property—it is antimicrobial, which means that it is toxic to bacteria and other microbes and prevents them from growing. This is why it is used to keep your clothes, sunscreen, or toothpaste free from bacteria.
But what makes the silver toxic to bacteria? Scientists have found that silver releases silver ions (Ag+, individually charged atoms) that interfere with critical proteins inside the bacterial cell. Once they are interrupted, the microorganism cannot properly function anymore and dies. What is the benefit of using silver nanoparticles instead of larger silver particles? The answer lies in the size of these particles. Because they are 10–100 times smaller than a bacterial cell, they not only release silver ions that affect bacteria, but they can also attach to the bacterial membrane and alter their properties. In addition, silver nanoparticles can actually penetrate inside the bacterial cell and cause harm there by damaging important biomolecules.
Now that you know that colloidal silver can have detrimental effects on microorganisms, do we have to worry about other organisms, too? What if you wash your clothes and the nanosilver gets into the water? Once silver nanoparticles enter the environment, it is very difficult to detect and measure them. A good way to learn if there are any toxic substances in the water (besides measuring them) is doing a bioassay. A bioassay is an experimental procedure that uses living organisms to determine if specific substances have a harmful effect on them. At the same time, it is possible to identify what concentration (amount per liter of water) is toxic. Bioassays are a powerful tool to assess environmental pollution or toxicity in a specific environment (ecotoxicity). The most common way to do a bioassay is to expose the organism of choice to different concentrations of the suspected toxin and then measure their response or count how many of them survive over time. It is critically important to maintain a control population of the organisms so that you do not mistake the naturally occurring death rate as the effect of toxins.
In this science project, you will use a freshwater organism called Daphnia magna (common name "water flea") to assess how they will be affected by different concentrations of colloidal silver. You will try both high concentrations and make dilutions (solution with weaker concentrations) to test how the daphnia react. Daphnids, like the one shown in Figure 1, are small freshwater organisms that are widely used for testing ecotoxicity. They are up to 5 mm in size and found around the world in most types of standing freshwater, such as ponds or lakes. They are good swimmers and mostly transparent, which makes it easy to assess their viability or if they are still alive (as you can actually see their heart beating!). How do you think the daphnia in this experiment will react to nanosilver? Will different concentrations make a big difference?
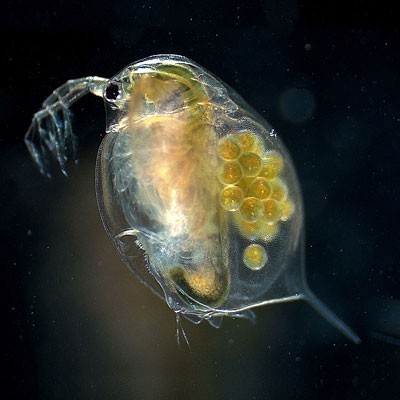
Figure 1. A female adult of the water flea Daphnia magna (Image credits: Wikimedia commons).
Terms and Concepts
- Nanometer (nm)
- Nanoparticle
- Nanosilver
- Colloidal silver
- Antimicrobial
- Ions
- Proteins
- Bioassay
- Ecotoxicity
- Daphnia magna
- Dose-response-curve
- Threshold concentration
- LC50
Questions
- What are nanoparticles and how big are they?
- Why is colloidal silver in so many consumer products?
- What makes nanosilver toxic to bacteria?
- What are daphnia and what are they used for in the laboratory?
- Why do we need bioassays and how do they work?
- Do you think nanosilver from consumer products poses a risk to the environment?
- Do you think silver nanoparticles have any effect on humans?
Bibliography
More information about colloidal silver and its effects can be found using theses resources:
- Nature News. Owens, B. (2013). Silver makes antibiotics thousands of times more effective. Retrieved September 25, 2015.
- Science News. (2014). More dangerous chemicals in everyday life: Now experts warn against nanosilver. Retrieved October 5, 2015.
- Phys Org. (2013). Investigating the environmental impact of nanosilver. Retrieved September 25, 2015.
This resource will give you more information about bioassays and Daphnia magna:
- Environmental Inquiry. (2009). Bioassays: Why Daphnia?. Cornell University and Penn State University. Retrieved September 25, 2015.
Materials and Equipment
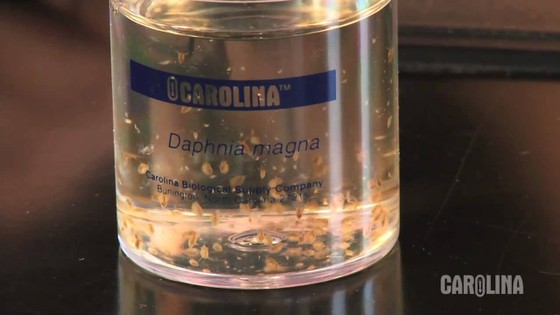
These items can be purchased from Carolina Biological Supply Company, a Science Buddies Approved Supplier:- Daphnia magna cultures (they include watering pipets) (5)
- Magnifying glass 10x
- 100 mL graduated cylinder
- Pond water (2 one-gallon jugs)
- Petri dish; you will only need one for the experiment. Alternatively any small, shallow, transparent plastic or glass container can be used.
- 1 mL pipet; available from Amazon.com
- Plastic cups 20 oz; a 50-pack of cups is available from Amazon.com, but you will only need 15 cups for the experiment
- Natural Path Silver Wings colloidal silver mineral supplement, 500 ppm, 1 fluid ounce (1); available from Amazon.com
- Permanent marker
- Scissors
- Bleach
- Lab notebook
Disclaimer: Science Buddies participates in affiliate programs with Home Science Tools, Amazon.com, Carolina Biological, and Jameco Electronics. Proceeds from the affiliate programs help support Science Buddies, a 501(c)(3) public charity, and keep our resources free for everyone. Our top priority is student learning. If you have any comments (positive or negative) related to purchases you've made for science projects from recommendations on our site, please let us know. Write to us at scibuddy@sciencebuddies.org.
Experimental Procedure
Before starting the experiment:
- Do your background research so that you are knowledgeable about the terms and concepts. Before starting, think about and state a hypothesis that you want to test with this experiment.
- Plan ahead before preparing for your experiment. Once you receive your Daphnia magna cultures you should complete the experiment within 2 days.
- Make sure you have watched the "care and handling of daphnia" video and read the daphnia care instructions from Carolina:
- Work in a room in which the temperature stays between 18–22°C (64–72°F) and keep the cultures out of direct sunlight.
Day 1
- When you receive your Daphnia magna cultures, immediately unscrew the cap of the container and put it loosely on the top to let oxygen in, which the daphnia need to survive. Do not screw the lid back on the jar. Let the open jar rest for 12–24 hours so the daphnia can recover from shipping and handling before starting the experiment.
- Meanwhile, prepare the plastic cups for the experiment: You will prepare three trials for each concentration of colloidal silver. Using a permanent marker, label each cup with the trial number (#1–#3) and nanosilver concentration in micrograms per liter (μg/L) that you will test (0 μg/L, 5 μg/L, 10 μg/L, and 25 μg/L). There will be a total of 12 cups.
Day 2
- Prepare the different concentrations of nanosilver solutions. Notice that the bottle you purchased is labeled 500 ppm. This means, that the concentration of silver nanoparticles in the bottle is approximately 500 parts per million (ppm), which is the equivalent of 500,000 micrograms per liter (μg/L). The concentrations you will be making and testing are 25 μg/L, 10 μg/L, 5 μg/L and 0 μg/L. Each cup will hold 500 mL of the respective nanosilver solution.
- First you will prepare a 1000 μg/L and 500 μg/L nanosilver stock solution. A stock solution is a solution that is at a higher concentration than you use in your tests, and it is used to make further dilutions, the concentrations you want to test. Make sure to only use room-temperature pond water to make these concentrations. Use the 100 mL graduated measuring cylinder to measure out the liquids.
- Using the 1 mL pipet, carefully suck up 1 mL of the colloidal silver solution and transfer it into an empty 20 oz plastic cup labeled with 1000 μg/L. Take the 100 mL graduated cylinder to measure out 499 mL of pond water and add this to the 1 mL nanosilver solution. Mix well with a watering pipet—the solution should be yellow, as shown in Figure 2. The cup will now hold a 1000 μg/L concentration of colloidal silver.
- Make a 1:2 dilution of the 1000 μg/L solution to get a nanosilver concentration of 500 μg/L. Label a fresh cup with the new concentration and fill the cup with 250 mL of pond water. Using the graduated cylinder, add 250 mL of the 1000 μg/L nanosilver solution to the 250 mL pond water. Mix well with a watering pipet—the solution should be slightly less yellow. This cup will now hold a colloidal silver concentration of 500 μg/L. Rinse your graduated cylinder with pond water before the next step.
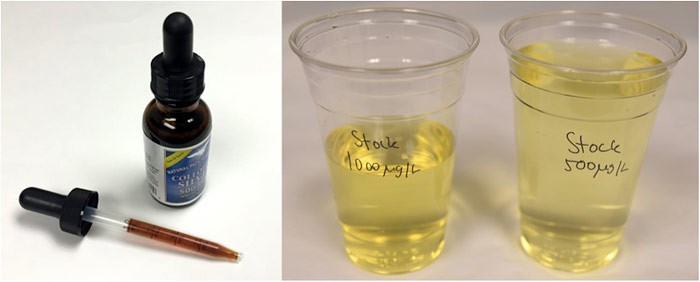 Image Credit: Svenja Lohner, Science Buddies / Science Buddies
Figure 2. Colloidal silver solution (left) and prepared yellow stock solutions (right).
- Prepare the nanosilver test concentrations using the 500 μg/L and 1000 μg/L stock solutions. Use your pre-labeled cups and do not forget to set up three trials (cups) per concentration. Make sure to rinse the measuring cylinder between each dilution with pond water.
- Start out with your control. Remember that it is very important to run a control experiment in which no silver nanoparticles are present so that you do not mistake the naturally occurring death rate of the organisms as the effect of the nanoparticles. Fill three cups labeled "control" or 0 μg/L with 500 mL pond water each and use these as control.
- Make a 1:100 dilution of the 500 μg/L nanosilver solution to get a concentration of 5 μg/L: Fill the three cups labeled with 5 μg/L with 495 mL pond water and then use the measuring cylinder to add 5 mL of the 500 μg/L nanosilver solution to each cup.
- Make a 1:100 dilution of the 1000 μg/L nanosilver solution to get a concentration of 10 μg/L: Fill the three cups labeled with 10 μg/L with 495 mL pond water and then use the measuring cylinder to add 5 mL of the 1000 μg/L solution to each cup.
- Make a 1:20 dilution of the 500 μg/L nanosilver solution to get a concentration of 25 μg/L: Fill the three cups labeled with 25 μg/L with 475 mL pond water and then use the measuring cylinder to add 25 mL of the 500 μg/L solution to each cup.
- You should now have three cups for each colloidal silver concentration and an additional three cups for the control, as shown in Figure 3. Make sure to mix all solutions well with a watering pipet before the next step. Start with mixing the lowest concentrations and then go to higher ones. As the colloidal silver is now very diluted, the solutions only show a slight tint of yellow.
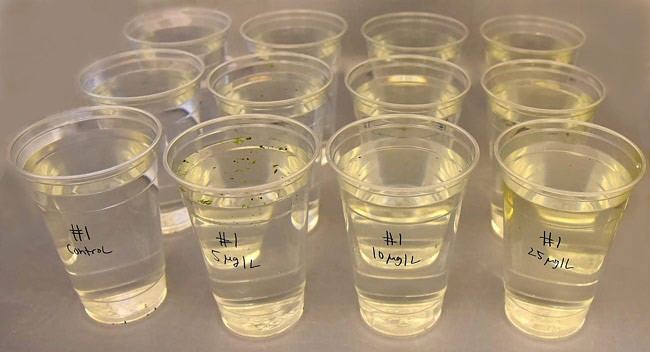 Image Credit: Svenja Lohner, Science Buddies / Science Buddies
Figure 3. Prepared cups with different concentrations of colloidal silver.
- First you will prepare a 1000 μg/L and 500 μg/L nanosilver stock solution. A stock solution is a solution that is at a higher concentration than you use in your tests, and it is used to make further dilutions, the concentrations you want to test. Make sure to only use room-temperature pond water to make these concentrations. Use the 100 mL graduated measuring cylinder to measure out the liquids.
- Before starting the experiment, you will add 10 live daphnia from your cultures to each of your prepared cups. Start adding the daphnia to the control cups, then to 5 μg/L, then to 10 μg/L and last to the 25 μg/L cups. To transfer the daphnia, follow the procedure below:
- Use a fresh watering pipet to slowly suck up one daphnia from the culture using this specific pipet technique:
- Daphnia magna can be larger than the opening of a water pipet. So as to not damage any live daphnia during transfer, take a watering pipet and use the scissors to remove the front end of the pipet in a 45° angle.
- Squeeze the pipet bulb and place it into the culturing water.
- Suck up a little water from the jar into the cut pipet.
- While continuing to squeeze, locate the daphnia that you would like to transfer. Pick a moving daphnia to make sure that you get a living one.
- Slowly decrease squeezing the pipet bulb to suck the daphnia in. If you manage to get several daphnia into the pipet, you can transfer them all at once. Make sure the daphnia remain near the opening of the pipet.
- Remove the pipet from the jar and (while still squeezing the bulb) move the pipet to the plastic cup with the colloidal silver.
- Dip the tip of the pipet into the plastic cup and slowly squirt out the daphnia. Once the daphnia is out, stop releasing any other liquid from the pipet, as you do not want any excess air bubbles to be created and accidentally kill the daphnia.
- Repeat steps ii.–vii. until you have 10 living daphnia in each of the 12 cups. You should not take longer than 1 hour to distribute all the daphnia from the culture into the different cups.
- Use a fresh watering pipet to slowly suck up one daphnia from the culture using this specific pipet technique:
- Once you have placed 10 live daphnia in each of your 12 cups, the experiment will start. Do not forget to write down the start time (0 h) in your lab notebook.
- Wait until 2 hours have passed and then count living and dead daphnia in each cup. Start counting with the cups to which you added the daphnia first (control up to higher nanosilver concentrations). Living daphnia should move around in the cup. If you see a daphnia that does not move, lies on the ground of the cup, or floats on the top, take the magnifying glass and look at the daphnia in the cup to check if their heart is still beating. If you are still unsure, you can take a closer look by following this procedure to tell if the daphnia is dead:
- Carefully transfer a drop of pond water with the nonmoving daphnia from the cup into a petri dish or another transparent container using the specific pipetting technique described in step 2.a.
- Use the 10x magnifying glass to see if the daphnia is moving at all in the petri dish. You can also try to see if the heart is still beating. If there is no movement, then the daphnia is dead. Place all dead daphnia in a separate cup filled with 45 mL pond water.
- If the daphnia is alive, carefully transfer the daphnia back into the same cup you took it from.
- Record the number of living and dead daphnia for each cup (trial # and nanosilver concentration) in a results table, such as Table 1, in your lab notebook.
| Time (hour) | Trial # | Control: 0 μg/L |
Concentration 1: 5 μg/L |
Concentration 2: 10 μg/L |
Concentration 3: 25 μg/L | ||||
|---|---|---|---|---|---|---|---|---|---|
| Alive | Dead | Alive | Dead | Alive | Dead | Alive | Dead | ||
| 0 | 1 | ||||||||
| 2 | |||||||||
| 3 | |||||||||
| Average | |||||||||
| Average in % | |||||||||
| 2 | 1 | ||||||||
| 2 | |||||||||
| 3 | |||||||||
| Average | |||||||||
| Average in % | |||||||||
| 4 | 1 | ||||||||
| 2 | |||||||||
| 3 | |||||||||
| Average | |||||||||
| Average in % | |||||||||
| 6 | 1 | ||||||||
| 2 | |||||||||
| 3 | |||||||||
| Average | |||||||||
| Average in % | |||||||||
- Identify live and dead daphnia again at the 4 h and 6 h time points after starting your experiment. Be sure to count the cups in the same order each time. For each time point, write down the number of dead and live daphnia you observed in each cup. As it is always better to observe longer-term rather than short-term effects, at this point you can choose to extend the duration of your experiment beyond 6 hs. If you have the time and decide to do so, count dead and live daphnia again after 8 hs and 24 hs.
- Once you record all live and dead daphnia for the 6 h (or your last) time point, the experiment is completed. To be responsible with cleanup of your experiment, you will bleach all remaining live and dead daphnia, as you do not want to introduce any foreign organisms into the environment. To do this, fill each cup that still contains live daphnia up to the top line of the cup with concentrated bleach (approximately 0.5 cm or 0.2 inches below the rim). Mix with a watering pipet and let stand for 20 min, then pour the mixture down the sink.
- Before disposing of your colloidal silver solutions (stock solutions, solutions in cups without daphnia and solutions in cups with bleached daphnia), think about a responsible way to do this without harming the environment. Look at your data and find a concentration that did not affect the daphnia. Dilute all your nanosilver solutions with tap water until you reach the selected unharmful concentration and only then pour the diluted colloidal silver solutions into the sink. By discarding the nanosilver this way, you will release a much less hazardous concentration of silver nanoparticles into the environment.
- Add 5 mL of bleach to the cup with the collected dead daphnia. Mix well and after 20 min, pour the mixture down the sink.
- Dispose of the plastic cups and all the other used materials with your regular waste.
- At the end of your experiment, do not forget to wash your hands and wipe the table surface with soap and water.
- Analyze your results.
- Compare and plot the average number of dead and live daphnia recorded for each nanosilver concentration and the control over exposure time.
- Create a dose-response curve (see the following Technical Note) by plotting the dead daphnia in percent (y-axis) vs. the tested concentration of nanosilver (x-axis) for the 2 h, 6 h and your latest time point, and determine the LC50 of the colloidal silver used in this experiment.
- How did the different colloidal silver concentrations affect the daphnia?
- Do all concentrations affect the daphnia the same way? If not, did you see a correlation of daphnia death and nanosilver concentration?
- What happened in the control cups compared to the cups with nanosilver?
- Which concentration killed most of the daphnia? What is your hypothesis as to why?
- Based on your results, what is the lowest nanosilver concentration, or the threshold dose, that showed a toxic effect?
- Were there any concentrations that were too low to show an effect on the daphnia?
- Can you determine the LC50 for the colloidal silver? Compare the LC50 values for the 2 h, 6 h and your latest time point. Are they very different? How do you think the LC50 value would change if you ran this experiment for 2, 3 or 4 days? Bearing in mind the different exposure times, what implications does that have for the real environment?
By testing different nanosilver concentrations, you can now plot a dose-response-curve from your results. The dose-response-relationship is the most fundamental and pervasive concept in toxicology. It quantitatively describes the association between the amount of a toxin (dose) and the toxic reaction (response)—in this case, the death of the daphnia. The graph that illustrates this relationship is called a dose-response curve. The dose is depicted on the x-axis and the response, or toxic reaction, is represented on the y-axis. An example of such a curve is shown in Figure 4.
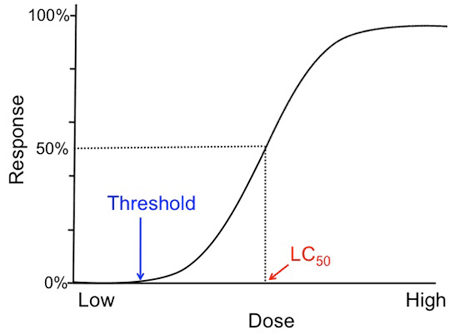 Image Credit: Svenja Lohner, Science Buddies / Science Buddies
An example dose-response-curve is graphed with a steep slope that plateaus near the end of the graph. A line is drawn from the 50% mark of the response axis and where it connects with the graph is the lethal concentration 50% value (where 50% of tested subjects at that dosage level are expected to die). Another important marker is the threshold concentration and it is marked where the graph begins to increase in slope. The threshold concentration is the dosage level where toxic responses can be expected.
Figure 4. Example of a sigmoid dose-response-curve.
Normally when plotting your data, you will get a sigmoid curve and its shape can reveal several important characteristics about the tested toxin. First, you can identify its threshold concentration. This is the dose where you can see a toxic response for the first time, and below which there are no effects of the toxin noticeable. Second, the slope of the curve is an important indicator of the toxicity of a substance. It tells you how much more effective a toxin is when increasing its dose. A steep slope suggests that the effect of increasing the dose of the toxin is very high, whereas it is minimal for a toxin that has a flat slope. Another essential value you can determine from the dose-response-curve is the LC50 value, which stands for Lethal Concentration 50%. The LC50 was created to be able to compare the toxicity of many different substances. It tells you at what concentration of tested toxin 50% of your organisms are expected to die. Note that the dose-response-relationship is dependent on the exposure time. That means if you plot the dose-response-curves for several of your exposure time points, they may look very different. Therefore, it is important to include the exposure time for each LC50 value.
Digging Deeper: Your Project and the Real World
Doing experiments in the laboratory is a great way for researchers to answer specific questions they have, such as finding out if nanosilver particles have any effects on daphnia. However, good researchers always try to think about how their findings relate to the "real world". In this experiment you only had a limited number of variables but think about what might be happening in a real pond with daphnia and nanosilver. What would be the actual nanosilver concentrations that are present in a pond or lake? How long would the pond life be exposed to nanosilver— would it be hours, weeks, months or even years? What about other organisms in the pond— might they respond the same or differently than the daphnia or even change the daphnia's response in some way? These are just some questions that can give you a feel for how complex biological studies can be. Just remember when doing biological experiments that your results will only give you a small snapshot of what is happening in a real-life biological system. For scientists, the results of one experiment often set off ideas for many more experiments. In the Variations section you can explore some ideas about how to look at this project from a different perspective.
Ask an Expert
Global Connections
The United Nations Sustainable Development Goals (UNSDGs) are a blueprint to achieve a better and more sustainable future for all.


Variations
- What about other nanoparticles besides nanosilver? Do they have the same toxic effects on Daphnia magna? A way to test this would be to repeat this experiment, but instead of using colloidal silver, try out colloidal copper or zinc (available from Amazon). Keep in mind that the toxic concentrations of these materials may be very different from the colloidal silver concentrations. It might be necessary to first do a trial with a much higher nanoparticle concentration range to identify the right concentrations to test in your real experiment. Which of the nanoparticles has the most toxic effect on the daphnia? What are the lowest toxic concentrations of nanozinc or nanocopper compared to nanosilver? Where can you find other nanoparticles, such as copper and zinc, and what are they used for?
- You know that nanosilver is present in a lot of consumer products. Instead of using the bought colloidal nanosilver solution, try to isolate colloidal silver from products that you know have nanosilver or colloidal silver in them. You might need to do some research to find the right ones, but often sports clothing, such as socks or shirts, do contain silver nanoparticles or colloidal silver. How much nanosilver does get into the water when washing these socks and is this concentration toxic to Daphnia magna? Try to simulate a washing cycle by soaking and stirring the socks or textile in 500 mL pond water for 1 h and use this water for the daphnia experiment. Be aware that during washing, not only will colloidal silver be released into the water, but all kinds of other chemicals, such as bleach, dyes or microplastics from the textile fibers as well. These could also be toxic to the daphnia. Make sure to also include similar socks without nanosilver (same color and brand) and compare these results to the results of the socks with colloidal silver. Do you see a difference between nanosilver containing socks and socks without colloidal silver? What if you try different brands of socks or textiles? Does the soaking time of the socks or repeated wash cycles have an effect?
- Daphnia are not the only freshwater organisms that we need to worry about when colloidal silver is released into the environment. Are other aquatic organisms susceptible to being killed by nanosilver, too? One way to check this would be to use other freshwater organisms, such as small pond snails or duckweed plants (available from Carolina Biological) for this experiment, instead of Daphnia magna . Remember that you probably need to adjust the concentrations of nanosilver for these organisms, as they might be more resistant or even more susceptible to silver nanoparticles than daphnia. How much nanosilver can these organisms tolerate? Can you think of other living organisms that might be affected by nanoparticles in the water, too?
- Do different life stages of daphnia (baby, juvenile or adult) react the same way to nanosilver? Will you get a different LC50 for each of them? What would that mean for a whole daphnia population in a lake or pond? Find out by repeating this experiment but differentiating between neonate (baby), juvenile and adult daphnia. You can easily distinguish them by size. Neonates are the smallest (smaller than 1 mm), juveniles are between 1 and 2.25 mm and adults are larger than 2.25 mm in size. An easy way to separate them would be to sort them with the help of three circles in your petri dish representing the three daphnia sizes. You can download templates for correctly sized sorting circles. Make sure to verify that your printed circles have the correct size by confirming that the marker line on the sheet is one inch long. Cut out the area with the circles and tape it underneath your petri dish. When picking the daphnia, put them into the circles first and see which one fits best (neonate, juvenile or adult circle). Then sort them according to their size and use the sorted daphnia for your experiment. You might need to buy more Daphnia magna jars for this experiment as you want 10 daphnia of each life stage in each of your cups.
- To find out, how the bacterium Escherichia coli responds to colloidal silver, try Science Buddies' project Tiny Titans: Can Silver Nanoparticles Neutralize E. coli Bacteria?
Careers
If you like this project, you might enjoy exploring these related careers: