Abstract
You know that sugar makes food sweet, but did you know that there are different kinds of sugar? Sucrose is the granulated sugar that you usually use for baking. Another kind of sugar, which is found in honey and in many fruits, is glucose. In this science project, you will measure the concentration of glucose in a variety of foods. You will use special test strips that change color in response to glucose to measure the glucose concentration in different foods.Summary
David Whyte, PhD, Science Buddies
Recommended Project Supplies
Objective
To measure the concentration of glucose in a variety of common fruits and juices.
Introduction
Fresh pineapple, chilled watermelon, and an icy cold soft drink on a hot summer's day. What do these things have in common? They all taste so good because of the sweetness the sugar in them provides. When you think of sugar, you probably picture the white granules you put in cookies, that your parents put in their coffee, or that you put on your cereal. Actually, this is just one kind of sugar, called sucrose, shown in Figure 1 on the right, which is extracted from sugar cane or sugar beets. Technically, sugar is a carbohydrate that occurs naturally in every fruit and vegetable. It is the major product of photosynthesis, the process by which plants transform the Sun's energy into food.
Glucose is another type of sugar and is a very important biochemical. For one thing, glucose is the only fuel used by brain cells. Glucose is also an important source of energy for muscles and other tissues in the body.
The glucose in your blood comes from the food you eat. Complex carbohydrates, found in pasta or cereal, for example, are long chains of sugar molecules that are broken down by enzymes to simple sugars, such as glucose. Sucrose, or table sugar, is also broken down to form glucose. Because carbohydrates and sucrose in food are broken down to form glucose, the level of glucose in your blood goes up after you eat.
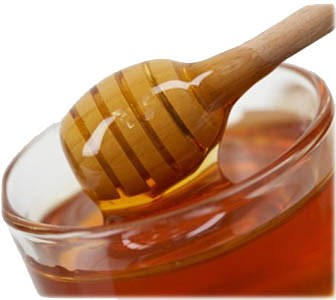 Image Credit: Wikimedia Commons user: Lama Raheem / Creative Commons Attribution-Share Alike 4.0 International
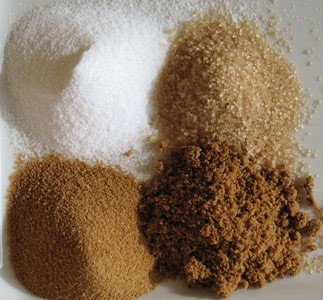 Image Credit: Wikimedia Commons, user: Romainbehar / Wikimedia Commons Public domain
Figure 1. Sugars can come in various forms such as glucose and fructose, which are the main sugars in honey (left), or sucrose, which is the sugar we most commonly use (right).
(Image credit: by Lama Raheem (honey) and by Romain Behar (sucrose), via Wikimedia Commons)
Like most of the chemicals in your blood, the level of glucose must be tightly controlled. The level of glucose in your blood is controlled by insulin, a hormone made in the pancreas. People with diabetes, a serious health problem in the United States, have bodies which are unable to regulate blood sugar levels either because their bodies do not make insulin (type 1 diabetes) or their bodies do not respond to insulin (type 2 diabetes). Too little glucose, and your brain and other organs will not have the energy they need to function. Too much glucose over a long period of time damages blood vessels carrying blood to major organs and can lead to heart disease and strokes along with kidney, nerve, and vision damage. To avoid those problems, diabetics carefully monitor their blood glucose level and make adjustments to insulin or diet, as needed, to maintain a healthy blood glucose level.
In this science fair project, you will investigate the concentration of glucose in common fruits and juices. In order to measure the glucose concentration, you will use glucose test strips. These strips were developed to help people with diabetes maintain a healthy level of blood glucose. When you dip the test strip into a liquid, such as orange juice, it changes color if glucose is present. The degree of color change depends on the concentration of glucose.
Terms and Concepts
- Sucrose
- Carbohydrate
- Glucose
- Biochemical
- Complex carbohydrate
- Enzyme
- Insulin
- Hormone
- Pancreas
- Diabetes
- Control
- Positive control
- Negative control
- Dilution series
Questions
- Put these five food sugars in order, from the sweetest to the least sweet: glucose, fructose, sucrose, lactose, and maltose.
- What is the concentration range of glucose in healthy people? What is the level in diabetics?
- Which foods have a naturally high level of glucose?
- Which fast foods have the highest glucose levels? (Hint: Look at the nutrition data on the restaurants' websites).
- Why do certain foods have high natural sugars? (Hint: Fruits contain seeds, and the plant's chances of spreading are better if the seeds are dispersed).
- How many calories are in 1 gram (g) of glucose?
- How does the glucose test strip work?
Bibliography
- American Diabetes Association. (n.d.). Medication Management: Blood sugar. Retrieved November 5, 2020.
- Nutrition Data. (2008). Foods highest in Glucose. Retrieved September 11, 2008.
- Khan Academy. (n.d.). Blood sugar levels. Retrieved July 6, 2016.
- Novo Nordisk. (2018). Diabetes care. Retrieved May 22, 2018.
Materials and Equipment 
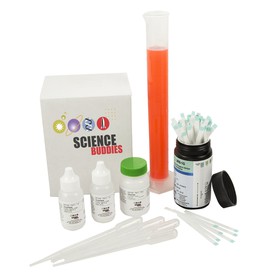
Recommended Project Supplies
These specialty items can be purchased from our partner Home Science Tools:
- Sugar Metabolism Kit (1). You will need the following items from the kit:
- Graduated cylinder, 100 mL (1)
- Glucose powder (30 g) (1)
- Urinalysis test strips that measure glucose (8 plus three for each food or juice you want to test)
- Graduated transfer pipettes, 3 mL (4)
You will also need to gather these items (not included in the kit):
- Disposable cups, at least 8 oz. (8 plus one for each food or juice you want to test)
- Permanent marker
- Optional: Knife and spoon
- Optional: Food coloring (color does not matter)
- Room-temperature tap water
- Scale, must be able to accurately measure 4 g. A digital scale accurate to at least 1 g (the Fast Weigh MS-500-BLK Digital Pocket Scale) is available from Amazon.com.
- Foods and juices to test. Categorize as fresh or processed. Some examples are listed below.
- Fruit juices: orange juice, lemon juice (you will be surprised!)
- Fresh fruit (sliced): apple, pear, pineapple, cucumber, tomato
- Processed foods: soft drinks, diet soft drinks, salad dressing, baby food, vinegar, peanut butter, sauces used on fast food hamburgers, ice cream (melted)
- Miscellaneous: honey, sugar water (sucrose mixed with tap water), molasses
- Graduated cylinder (10 mL volume), available at Amazon.com, or measuring teaspoons
- Stopwatch or clock with a second hand
- Adult helper
- Lab notebook
Disclaimer: Science Buddies participates in affiliate programs with Home Science Tools, Amazon.com, Carolina Biological, and Jameco Electronics. Proceeds from the affiliate programs help support Science Buddies, a 501(c)(3) public charity, and keep our resources free for everyone. Our top priority is student learning. If you have any comments (positive or negative) related to purchases you've made for science projects from recommendations on our site, please let us know. Write to us at scibuddy@sciencebuddies.org.
Experimental Procedure
- To start this science fair project, you should first collect all of the foods and juices that you plan to test.
-
Based on your research, predict which foods will have the highest glucose levels. List the foods in your lab notebook in order from highest to lowest predicted glucose concentration.
- One place to start your research is the Nutrion Data website, which reports glucose levels for some raw ingredients (nuts, fruits, vegetables, etc). To get to that information, search for the ingredient, scroll down to "Nutrition Information" and click the "More details" tab under "Carbohydrates". Remember that for processed food, the labels on most products list total sugar, which is a mixture of several sugars such as sucrose, fructose, lactose, maltose, galactose and glucose. The test strip only measures glucose concentration.
Making the Positive and Negative Controls
Controls are samples with known ingredients that should give clear, expected results. They are used to test the procedure. Using a positive control, there should be a clear "signal," or color change, showing that the glucose strips are working properly. Using a negative control, there should be no "signal," or color change. Tap water is a suitable negative control (because it has no glucose).
- First, make the positive controls using water and the glucose powder. To do this, make a dilution series using sequential twofold dilutions to create the following concentrations: 2%, 1%, 0.5%, 0.25%, 0.125%, and 0.0625%.
- Label six cups: 2%, 1%, 0.5%, 0.25%, 0.125%, and 0.0625%.
- Add 4 grams (g) of glucose to 200 mL of water in the cup labeled 2% and stir until the glucose dissolves.
- Optional: Add 2–5 drops of food coloring to the 2% glucose solution. The color does not matter. Note: The food coloring will allow you to keep track of your dilution levels as the color of each dilution will get less intense. It does not interfere with the glucose measurements.
- Add 100 mL of water to the other five cups.
- Measure 100 mL of the 2% solution and add it to the 100 mL of water in the cup labeled 1% to make 200 mL of 1% solution. Stir well.
- Measure 100 mL of the 1% solution and add it to the 100 mL of water in the cup labeled 0.5% to make 200 mL of 0.5% solution. Stir well.
- Between each dilution, make sure to rinse and shake the excess water from the graduated cylinder or container you are using to transfer the 100 mL volumes. Also, use a clean stirrer.
- Repeat this process for the remaining dilutions.
- When you are done, each cup should have 100 mL of liquid, except for the 0.0625% solution, which should have 200 mL.
- Fill an extra cup with 100 mL water. Do not add any of the glucose solutions to it. Label it 0%. This will be your negative control.
- If you used food coloring for your dilution series, you should now have seven cups that look similar to the ones in Figure 2.
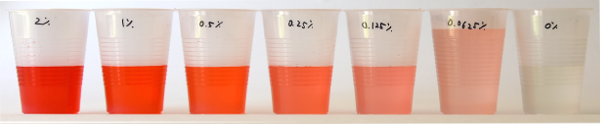 Image Credit: Svenja Lohner, Science Buddies / Science Buddies
Figure 2. If you used food coloring (in this picture, red food coloring was used), the glucose dilution series should look like the ones in this picture (arranged by most concentrated to least, from left to right). (Each cup should have 100 mL of liquid, except for the 0.0625% solution, which should have 200 mL.) A seventh cup, serving as the negative control, should only contain water (on the far right in this picture).
- Dip a test strip into the solution in the cup labeled 2%. After 1–2 seconds, remove the test strips from the solution. Tap the test strip on the rim of the cup to remove excess solution and watch it for 30 seconds (which should be the time recommended in the test strip instructions). Then match the color of the glucose marker on the test strip to the color on the bottle shown in Figure 3. Does the color match what you would expect? Write down your observations in your lab notebook. Note: For high glucose concentrations, it might take up to 60 seconds until the color matches the actual concentration.
- See the Technical Note: Reading Glucose Test Strips for guidance on matching the color of the glucose test strips to the color on the bottle.
- If the color changes to the maximum range (2%) before 30 seconds, list it as greater than 2% (">2%").
- Repeat step 4 for each of the six other cups.
- If you do not have a clear color change for any of the positive control solutions with a concentration greater than 0.0625%, repeat the procedure. If the second time it is still problematic, re-read the instructions for steps 3 and 4 to make sure you have made the dilutions properly and are handling the strips according to the instructions.
- It is ok to have a slightly lower reading for the pure glucose solutions. Remember, these test strips were designed for measuring low concentrations of glucose in a urine sample so the results might be slightly different for pure glucose solutions. If the test strips for the glucose solutions at 30 seconds are more than one color off from what it is expected to be (for example, if the 1% solution reads less than 0.5% or the 0.25% solution reads greater than 0.5%), you could adjust the readout time accordingly (for example to 60 seconds). However, you have to make sure, that throughout the experiment, you keep the same readout time for all of your samples.
When matching the color of a glucose test strip to a color on the bottle, keep in mind these helpful tips:
- The colors on the bottle will not exactly correspond to the percent glucose solutions you made. There will probably be colors for 0% ("Negative"), 0.1%, 0.25%, 0.5%, 1% and 2% glucose solutions, as shown in Figure 3.
- Some test strip colors may fall between two of the colors on the bottle, for example between 0.5% and 1%. If this happens, write down the two numbers in your lab notebook and calculate their average.
- If the color changes to the maximum range (2%) before 30 seconds, list it as greater than 2% (">2%"). If this happens in the Experimental Procedure, you may need to then perform a dilution and re-test the sample. You will get more accurate results if you start diluting your samples once the glucose concentration is getting close to 1%.
When testing solutions, you might need to dilute your sample to get a more accurate reading.
Use a 1:10 dilution when you expect the sample to have a very high glucose concentration (e.g. non-diet soft drinks) or are viscous (e.g., peanut butter, honey, or molasses).
- There are two ways in which you may perform a 1:10 dilution, and the preferred way will be specified in the text:
- Use a transfer pipette to add 9 drops of water and 1 drop of the test solution on a bottle cap. Rinse the transfer pipette in between each sample.
- Mix 1/2 teaspoon (tsp.) (2.5 mL) of the sample with 22.5 mL water to make a 1:10 dilution.
Use a 1:4 dilution when glucose readings are close to 2% to get a more accurate glucose concentration reading.
- You may perform a 1:4 dilution by adding 30 mL of water to 10 mL of your solution. Stir well. Label the cup 1:4 dilution of the sample.
Occasionally, you might have to dilute a 1:10 dilution further to obtain an accurate measurement. When diluting a 1:10 dilution twofold, you obtain a 1:20 dilution. You can do this by adding 10 mL of water to 10 mL of 1:10 diluted solution. Multiply the measurement of the 1:20 diluted sample by 20 to obtain the glucose concentration level of the undiluted sample.
Diluting the sample tenfold to create a sample with a glucose concentration that can be measured with the glucose test strips allows you to measure higher concentrations. Unfortunately, these measurements will be less accurate. Because the measured concentration from the diluted sample gets multiplied by 10 to obtain the concentration of the original sample, any inaccuracy in the measurement will also be multiplied by 10. Because of these inaccuracies, high glucose concentrations measured using a tenfold dilution will give you an idea of the glucose concentration but not an accurate measurement.
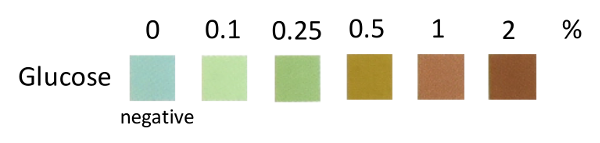 Image Credit: Svenja Lohner, Science Buddies / Science Buddies
Figure 3. This is the color chart for glucose on the test strip bottle. After a glucose test strip is dipped in a glucose solution and removed, its color should change and match a color on its bottle (or be between two colors). The color on the bottle will indicate the percentage of glucose in the solution tested.
Testing the Foods for Glucose Concentration
- Pour a small amount of liquid that you plan to test into a cup.
- Get ready to start the stopwatch.
-
Dip the test strip into the liquid.
- For the fresh fruits and vegetables, press the test strip against a freshly cut slice until the test strip is thoroughly wet.
- For very high-glucose liquids, such as honey or soft drinks (not diet), or viscous substances, such as peanut butter, molasses, or baby food, dilute the samples in water prior to testing as described in the Technical Note: Dilutions. For example, mixing 2.5 mL (0.5 teaspoon [tsp]) of honey with 22.5 mL (4.5 tsp.) water makes a 1-to-10 dilution. Remember to multiply the concentration of glucose in the diluted solution by 10 to obtain the concentration of glucose in the original sample.
- After 1–2 seconds, remove the test strip from the liquid or food, tap it on the rim of the cup to remove excess liquid, and immediately start the stopwatch.
- Wait for the amount of time specified on the test strip directions, usually 30 seconds, or the reaction time you established while testing the positive controls.
-
Compare the color on the test strip with the color on the side of the container to determine the glucose concentration.
- If the color changes to the maximum range (2%) before 30 seconds, list it as greater than 2% (">2%").
- To determine the actual percent of glucose in samples with over 2 percent, dilute the sample as described in the Technical Note: Dilutions to bring the glucose level down within the range of the test strips. You will get more accurate results if you start diluting your samples once the glucose concentration is getting close to 1%.
- Test the diluted sample. Remember to adjust the measured glucose concentration to obtain the glucose concentration of the undiluted sample.
- Repeat steps 1–6, of this section, for all of your foods and juices.
- Make a data table of your results in your lab notebook. Table 1 is an example, with a "predicted" column for what you expected to find, and an "experimental" column for your actual results.
- Use < 0.5% for "low," 1%–2% for "medium," and >2% for "high."
- Repeat the glucose measurements for at least three trials (three samples of each type of food). Calculate the average glucose concentration for this type of food by averaging the measurements of all trials for this type of food.
- Graph your results. Put the type of food on the x-axis and the average glucose concentration on the y-axis.
- Did your results match your predictions? Were some foods surprising in the amount of glucose they contained?
| Type of Food | Glucose Level: Predicted | Glucose Level: Experimental | Notes |
|---|---|---|---|
| Mixed fruit drink | High | 10% (1% in diluted sample) | Diluted 1:10 (example) |
| Orange juice | Low | 1% | Tropicana |
Ask an Expert
Global Connections
The United Nations Sustainable Development Goals (UNSDGs) are a blueprint to achieve a better and more sustainable future for all.

Variations
- People with diabetes might occasionally experience low blood sugar. When this occurs, they need to eat or drink something with glucose in it right away, typically aiming for a fast intake of 15 g. Calculate how much of each food you tested would need to be consumed to provide 15 g of glucose.
- Do different honeys have different glucose levels? You can investigate this by repeating this experiment and focusing on comparing different honeys.
- Test the glucose levels in fresh vs. frozen foods. Is there a difference in the amount of glucose a food has depending on whether it is fresh or frozen?
- For a more advanced project on glucose in foods, see: Sucrose & Glucose & Fructose, Oh My! Uncovering Hidden Sugar in Your Food.
Careers
If you like this project, you might enjoy exploring these related careers:


Contact Us
If you have purchased a kit for this project from Science Buddies, we are pleased to answer your questions.In your email, please follow these instructions:
- What is your Science Buddies kit order number?
- Please describe how you need help as thoroughly as possible:
Examples
Good Question I'm trying to do Experimental Procedure step #5, "Scrape the insulation from the wire. . ." How do I know when I've scraped enough?
Good Question I'm at Experimental Procedure step #7, "Move the magnet back and forth . . ." and the LED is not lighting up.
Bad Question I don't understand the instructions. Help!
Good Question I am purchasing my materials. Can I substitute a 1N34 diode for the 1N25 diode called for in the material list?
Bad Question Can I use a different part?
Contact Us
Related Links
- Science Fair Project Guide
- Other Ideas Like This
- Cooking & Food Science Project Ideas
- Diabetes Project Ideas
- My Favorites