Abstract
When an earthquake happens, how are scientists able to determine the original location of the quake? In this project, you'll use archived data from a global network of seismometers to find out for yourself. You will make your own seismograms using the Global Earthquake Explorer program, and then use the seismograms to determine the location of earthquake epicenters.Summary
Andrew Olson, Ph.D., Science Buddies
/-/https/www.sciencebuddies.org/cdn/Files/3014/5/Geo_img033.jpg)
Objective
The goal of this project is to locate the epicenters of worldwide earthquakes using archived seismometer data from a global network.
Introduction
A fundamental principle of geology is that the features of the Earth are not fixed. Instead, they change over time. The time scale of most geologic changes is creepingly slow in terms of a human lifetime. Uplift of mountain ranges may occur at 1-10 mm/year, not even a hill in a human lifetime, but when continued over millions of years it results in some spectacular peaks!
An earthquake is an example of a major geologic event that occurs suddenly. If you look at a map of historic earthquakes (USGS, 2007), you'll notice that most quakes occur near the boundaries between tectonic plates. At boundaries where the plates oppose one another, tremendous strains can build up between between the plates. The strains are suddenly released when one plate slips against the other. The energy from this sudden movement travels through the earth as shock waves.
Figure 1 is from a US Geological Survey publication, "The Interior of the Earth" (Robertson, date unknown). It shows the layers of the Earth, through which the shock waves travel.
/-/https/www.sciencebuddies.org/cdn/Files/3010/3/Geo_img029.gif)
Figure 1. The layers of the Earth (Robertson, date unknown).
Table 1, from the same publication, gives a brief description of each of the earth's layers (Robertson, date unknown).
| Table 1. Data on the Earth's Interior | ||||
|---|---|---|---|---|
| Layer |
Thickness (km) |
Density (g/cm3) | Types of Rock Found | |
| Top | Bottom | |||
| Crust | 30 | 2.2 | 2.9 | Silicic rocks. Andesite, basalt at base. |
| Upper mantle | 720 | 3.4 | 4.4 | Peridotite, eclogite, olivine, spinel, garnet, pyroxene. Perovskite, oxides at bottom. |
| Lower mantle | 2,171 | 4.4 | 5.6 | Magnesium and silicon oxides. |
| Outer core | 2,259 | 9.9 | 12.2 | Iron+oxygen, sulfur, nickel alloy. |
| Inner core | 1,221 | 12.8 | 13.1 | Iron+oxygen, sulfur, nickel alloy. |
The shock waves spreading out from an earthquake are called seismic waves (from the Greek word for earthquake). There are two general types of seismic waves: body waves and surface waves.
- Body waves travel through the Earth's interior.
- Surface waves, which are analogous to water waves, travel just beneath the Earth's surface.
There are two types of body waves, P waves and S waves. P waves (also called primary waves) are compression waves. Like sound waves, they consist of compressions and rarefactions of the material through which they travel. The compressions and rarefactions are in the same direction that the wave is traveling. S waves (also called secondary waves) are transverse (or shear) waves, meaning that the ground moves perpendicularly to the direction of travel. S waves have much higher amplitude than P waves, but travel more slowly. They carry more destructive force than P waves. Another difference between P waves and S waves is that S waves cannot travel through the Earth's liquid core, while P waves can. S waves can therefore be detected by seismometers near the epicenter of an earthquake, but not by more distant seismometers. P waves can be detected by both local and distant seismometers.
Figure 2 (Robertson, date unknown) is a cross-section of the Earth, showing how P waves and S waves travel through the various layers. Because of the varying density of the layers, the waves are refracted as they pass through the different layers. This is analogous to the refraction of light waves when they pass from air to water, for example.
/-/https/www.sciencebuddies.org/cdn/Files/3011/3/Geo_img030.gif)
A diagram of a cross-section of the Earth shows how earthquake waves travel in curved lines through the inner layers of the Earth. Waves are able to travel through the crust, upper mantle, lower mantle, and outer core but are unable to travel through the inner core.
Figure 2. "Cross section of the whole Earth, showing the complexity of paths of earthquake waves. The paths curve because the different rock types found at different depths change the speed at which the waves travel. Solid lines marked P are compressional waves; dashed lines marked S are shear waves. S waves do not travel through the core but may be converted to compressional waves (marked K) on entering the core (PKP, SKS). Waves may be reflected at the surface (PP, PPP, SS)." (Robertson, date unknown).
Figure 3 is a seismometer trace that shows P waves and S waves from an example earthquake. Since P waves travel faster than S waves, they always arrive first. The S wave is marked by an abrupt increase in the amplitude of the disturbance on the trace. In this project you will use a webpage interface to make similar seismograms in order to locate earthquake epicenters.
/-/https/www.sciencebuddies.org/cdn/Files/3012/5/Geo_img038.jpg)
An example seismogram from the Solomon Islands shows P-waves are the first signs that an earthquake is occuring. S-waves generated by an earthquake follow the P-waves. When compared, the P-waves have a smaller amplitude and higher frequency than the S-waves.
Figure 3. Example seismogram created with the Global Earthquake Explorer program (GEE, 2006).
The difference in travel time between the first P wave and the first S wave can be used to measure the distance from the seismometer recording station to the epicenter of a local earthquake. In this project you will use this method to determine the location of earthquakes using archived data accessed and displayed with the Global Earthquake Explorer program.
Terms and Concepts
To do this project, you should do research that enables you to understand the following terms and concepts:
- Plate tectonics
- Earthquake
- Temblor
- Epicenter
- Seismometer
- Coordinated Universal Time (UTC)
- Seismic waves:
- Body waves, including P-waves and S-waves (also called P and S phases)
- Surface waves
- Earth layers:
- Crust
- Upper mantle
- Lower mantle
- Outer core
- Inner core
- Travel time
Questions
- Can you explain the differences between P-waves and S-waves?
- What causes earthquakes?
- Where do earthquakes occur most frequently?
Bibliography
To help you get started on your background research, here are some useful websites on the passage of seismic waves through Earth's interior and a good general introduction to waves:
- Robertson, E.C. (2011, January 14). The Interior of the Earth. United States Geological Survey (USGS). General Interest Report. Retrieved Mardh 8, 2013.
- Louie, J. (1996, Oct. 10). Earth's Interior. The Nevada Seismological Laboratory, University of Nevada. Retrieved March 8, 2013.
- Henderson, T. (n.d.). Waves. The Physics Classroom. Retrieved March 8, 2013.
This science project uses Global Earthquake Explorer (GEE) software, a Java-based program with versions for all three major flavors of personal computer (Windows, Mac, Linux). You can find download the program and user manual from:
- Global Earthquake Explorer (GEE). (n.d.). The Global Earthquake Explorer. Department of Geological Sciences, University of South Carolina, and the IRIS Consortium. Retrieved March 8, 2013.
Travel-time data for P-waves and S-waves is from this USGS webpage:
- United States Geological Survey (USGS). (2004, July 27). Table of P and S−P Versus Distance. Earthquake Hazards Program. U.S. Department of the Interior. Retrieved March 8, 2013.
Here is one source of outline maps that you could print and use for this science project:
- Houghton Mifflin Harcourt Publishing Company. (n.d.). Outline Maps. Classroom Resources. Retrieved March 8, 2013.
To find earthquake information (date, time, location, magnitude) to do this science project, see this webpage:
- USGS. (n.d.). Search Earthquake Catalog. U.S. Department of the Interior. Retrieved April 9, 2018.
Materials and Equipment
To do this experiment you will need the following materials and equipment:
- Computer with high-speed Internet access and printer
- Pencil
- Compass
- Printed maps with latitude and longitude for determining quake epicenter location
Experimental Procedure
Downloading and Installing the Software
-
This project uses Global Earthquake Explorer (GEE) software, a Java-based program with versions for all three major flavors of personal computer (Windows, Mac, Linux). You can find download the program and user manual from:
GEE, 2006. "The Global Earthquake Explorer", Department of Geological Sciences, University of South Carolina and the IRIS Consortium. Retrieved May 16, 2007.- Click the appropriate link for your type of computer, and follow the instructions to download the program and install it on your computer.
- Note that the program requires high-speed Internet access in order to work properly.
- The program requires Java, but the installer should automatically take care of this for you if the Java Runtime Environment is not already installed on your computer.
- If you have problems with the installation, you can find complete documentation for the program (in pdf format, requires Adobe Acrobat).
- Before running the program, take some time to read through the user's manual that comes with it so that you are familiar with how the program works.
Getting Earthquake Data
- Start the Global Earthquake Explorer program on your computer.
-
On the startup screen, click on the option, "Explore Recent Earthquakes."

Screenshot of the opening screen of the Global Earthquake Explorer Program includes seven menu options. The option to "Explore Recent Earthquakes" is highlighted at the top of the list directly under the Global Earthquake Explorer header. The other menu options are: explore a regional hotspot, seismograph day viewer, real time viewer, intro into GEE module, detecting the layered earth module, and longitudinal and transverse waves module.
Global Earthquake Explorer startup screen (GEE, 2006).
-
You will see a world map displaying earthquake activity from the past 7 days.
- Noteworthy earthquakes are displayed as circles.
- The map is automatically centered on the largest earthquake in the time period.
- The size of the circles is related to the magnitude of each quake.
- The color of the circles is related to the depth of each quake.
- When you 'mouse over' the circle for each earthquake, the status line at the bottom of the map displays information about the quake.
- The blue triangles show seismic stations with available data. (Be patient, it takes awhile for the program to check on what data is available.)

Screenshot of a world map generated in the Global Earthquake Explorers program with circles and symbols overlaying the map. Circles represent earthquakes and blue triangles represent data collecting stations. There are between 3-20 blue triangles spread throughout any given continent, with the exceptions of Antarctica which has 2 and North America which has a very large number of blue triangles completely covering the east and west coast of the United States. In this particular map there are 2 major earthquakes represented by large circles over Papua New Guinea and the other off the cost of Senegal. 6 smaller earthquakes are also circled over Indonesia, Japan, the Aleutian Islands, the western coast of Canada, the eastern coast of Mexico and the northern part of Chile.
Global Earthquake Explorer World Map tab screen shot (GEE, 2006).
-
The controls at the top of the map are fairly self-explanatory.

A cropped screenshot from the Global Earthquake Explorers program shows a toolbar with 8 selectable options. From left to right the tool icons allow you to: Select earthquakes and seismometer stations, zoom in, zoom out, move the map, restore the map to normal size, de-select all seismometer stations, get help and load seismometer data.
The controls allow you to:- Select earthquakes and seismometer stations
- Zoom in and out on the map
- Pan (i.e., click-and-drag) the map
- Restore the map to normal size
- De-select all seismometer stations
- Get help
- Load seismometer data
-
By default, the World Map shows noteworthy earthquakes from the previous week. You can select data from previous time periods by choosing Edit/Earthquakes/Noteworthy Earthquakes from the program menu.
-
You'll see a dialog box like the one shown which you can use for selecting archived earthquake data.
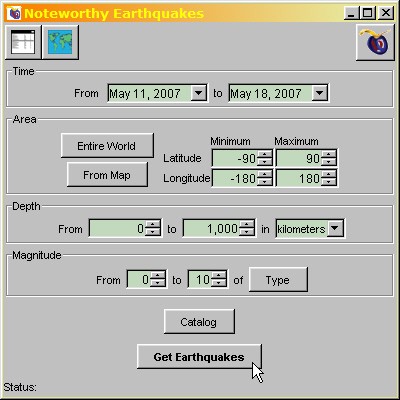
Screenshot of the noteworthy earthquakes dialog box in the Global Earthquake Explorers program. The dialog box allows a user to input parameters to search for a specific earthquake. Earthquakes can be searched based on time, area, depth and magnitude.
- You can use the USGS Search Earthquake Catalog page to find the dates, times and locations of earthquakes of interest.
-
You'll see a dialog box like the one shown which you can use for selecting archived earthquake data.
-
Here are the steps to get seismometer data from a particular earthquake:
- Select an earthquake of interest by clicking on its colored circle. The map will re-center (east-west) on the selected earthquake, and the program will check to see which seismometer stations have data available for the selected quake. (Be patient, it takes awhile for the program to check on what data is available.)
-
Click to select at least three blue seismometer stations close to the earthquake. Selected stations are outlined in white as in the illustration.
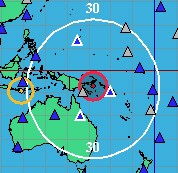
Screenshot of a map with an earthquake marker over Papua New Guinea in the Global Earthquake Explorers program. Three blue triangles closest to the earthquakes epicenter are selected, each blue triangle represents a seismometer station.
-
Click on the "Load Selected Stations" control button to load seismometer data from the selected stations. The program will retrieve the data and switch to the Seismogram Display tab, as shown in the illustration below.

Three seismograms from different stations are displayed in the Global Earthquake Explorers program. The seismograms are on a single graph and are aligned with respect to time. The three graphs come from stations in Australia, Mariana Islands and Solomon Islands. Signs of an earthquake appear on each seismogram at different times based on how close the seisometer station was to the epicenter of the earthquake. The seismogram from the Australian station shows activity first, the Solomon Islands seismograms shows second, and the Mariana Islands seismogram shows signs of an earthquake last.
/-/https/www.sciencebuddies.org/cdn/Files/3013/5/Geo_img032.jpg)
/-/https/www.sciencebuddies.org/cdn/Files/3014/5/Geo_img033.jpg)
/-/https/www.sciencebuddies.org/cdn/Files/3015/5/Geo_img034.jpg)
/-/https/www.sciencebuddies.org/cdn/Files/3018/5/Geo_img037.jpg)
/-/https/www.sciencebuddies.org/cdn/Files/3016/5/Geo_img035.jpg)
/-/https/www.sciencebuddies.org/cdn/Files/3017/5/Geo_img036.jpg)
Analyzing the Seismogram Data
-
Analyze the seismogram.
-
Identify the arrival of the P-wave. The P-wave always arrives first. Use the cursor in the seismogram display tab to measure the arrival time of the P-wave. Adjust the cursor until it is on top of the P-wave, then read the arrival time from the display at the lower right (highlighted in illustration).
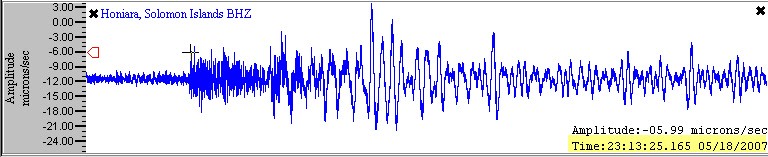
A marker is placed at the beginning of the P-wave on a seismogram generated from a seismometer station in the Solomon Islands. Information for the marker is displayed at the bottom-right of the seismogram and shows an amplitude of -5.09 microns/second and an arrival time of 23:13:25.165 05/18/2007.
-
Identify the arrival of the S-wave. Again, use the cursor in the seismogram display tab to measure the arrival time of the S-wave. Adjust the cursor until it is on top of the S-wave, then read the arrival time from the display at the lower right (highlighted in illustration). Remember that the S-wave may be difficult to identify, because the trace is already disturbed by the P-wave and other waves associated with it.
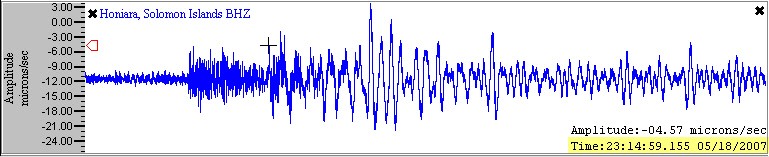
A marker is placed at the beginning of the S-wave on a seismogram generated from a seismometer station in the Solomon Islands. Information for the marker is displayed at the bottom-right of the seismogram and shows an amplitude of -4.07 microns/second and an arrival time of 23:14:59.155 05/18/2007.
-
Figure out the time of arrival of each wave and enter it in a data table in your lab notebook like:
Swipe left to see moreStation P-wave arrival time
(Tp, hh:mm:ss)S-wave arrival time
(Ts, hh:mm:ss)Ts − Tp
(s)Distance
(deg)Honiara, Solomon Islands P 23:13:25.165 (S) 23:14:59.155 93.99 7.5 etc. - If you are uncertain about your identification of the S-wave, put parentheses around it when you enter it in the table, like this: (S) 23:14:59.155. That way, if you have to repeat some measurements later, you'll be able to identify which ones to re-examine.
- Calculate the difference in arrival times of the first S-wave and the first P-wave. (If you have not identified an S-wave arrival, do not calculate this time.) Remember that there are 60 seconds in one minute and 60 minutes in one hour. Enter the information in the data table.
-
Identify the arrival of the P-wave. The P-wave always arrives first. Use the cursor in the seismogram display tab to measure the arrival time of the P-wave. Adjust the cursor until it is on top of the P-wave, then read the arrival time from the display at the lower right (highlighted in illustration).
-
Use the Travel Time Graph to find the distance from the station to the event.
- For a printable Travel Time Graph (requires Adobe Acrobat Reader).
- Find the S−P travel time on the y-axis.
- Read straight across until you intersect the travel time curve.
- Read the straight down to the x-axis.
- Calculate the distance (in degrees) from the x-axis.
- Enter the distance in your data table.
-
The figure illustrates the whole process for determining the distance to station Honiara, Solomon Islands for the sample earthquake.
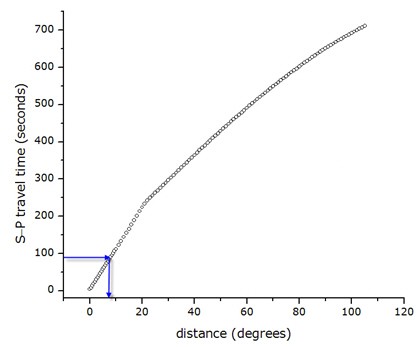
An example Travel Time graph uses the difference in the time between S-waves and P-waves of an earthquake to calculate the distance of a station to an epicenter. The difference in time between the S-wave and P-wave of an earthquake is graphed on the y-axis and the distance in degrees is graphed on the x-axis. An increasing positive line is present on the graph. The corresponding x value for any value of y, with respect to a point on the graphed line, is the distance a seisometer station is from the epicenter of an earthquake.
-
Draw a circle on the station map to indicate the possible locations for the earthquake epicenter.
- Use the map scale to set your compass to the correct distance in degrees (as determined from the travel time graph).
- With your compass set correctly, place the point of the compass on the station, and draw a circle around it. You can obtain the latitude and longitude of each station by selecting Tools/Event and Station Info from the program menu. The origin of the earthquake should lie on (or near) this circle.
-
Add more stations to pinpoint the epicenter location. Repeat steps 1-3 for additional stations until you are confident about the location of the epicenter.
- When making additional seismograms, examine the data you have already plotted on the station map and think carefully about which station will provide the most valuable additional information.
- Remember that you may have to go back and reassess your determination of the S-wave arrival time on some seismograms.
- When you are confident of your results, mark your predicted epicenter location on the map.
- Repeat the process for several different earthquakes. When you are finished, compare the plotted epicenter location to the actual location of the epicenter (which can be obtained by selecting Tools/Event and Station Info from the program menu).
/-/https/www.sciencebuddies.org/cdn/Files/3019/3/Geo_img039.jpg)
/-/https/www.sciencebuddies.org/cdn/Files/3020/3/Geo_img040.jpg)
/-/https/www.sciencebuddies.org/cdn/Files/3021/3/Geo_img041.jpg)
Ask an Expert
Global Goals
The United Nations Sustainable Development Goals (UNSDGs) are a blueprint to achieve a better and more sustainable future for all.
/-/https/www.sciencebuddies.org/cdn/Files/19754/5/E-WEB-Goal-11.png)
Variations
- For a more basic version of this project using seismometer data from a web interface (no program to download!) see the Science Buddies project Locating the Epicenter of an Earthquake.
Careers
If you like this project, you might enjoy exploring these related careers:
/-/https/careerdiscovery.sciencebuddies.org/cdn/Files/1346/17/iStock-579770584.jpg)
/-/https/careerdiscovery.sciencebuddies.org/cdn/Files/1359/18/VNIIOarctic.jpg)
/-/https/careerdiscovery.sciencebuddies.org/cdn/Files/1713/17/pexels-photo-3769021.jpg)
/-/https/careerdiscovery.sciencebuddies.org/cdn/Files/1086/18/iStock-476084261.jpg)

/-/https/img.youtube.com/vi/-auIuAA9vFk/0.jpg)
/-/https/img.youtube.com/vi/U7XYzPfutBs/0.jpg)
/-/https/img.youtube.com/vi/4aKOM6Scxhk/0.jpg)