Measuring the Diameter of the Earth's Core with Seismic Waves Around the Globe
Abstract
When an earthquake occurs, seismic shock waves travel out through the earth from the source of the event. The shock waves travel through the earth or along the Earth's surface, and can be recorded at remote monitoring stations. Some of the waves that travel through the earth are blocked or refracted by the Earth's liquid core, which means that monitoring stations located certain distances from the earthquake do not detect these waves. This creates a "seismic shadow" that you can use to estimate the diameter of the Earth's core. This geology science project shows you how.Summary
Andrew Olson, Ph.D., Science Buddies
Teisha Rowland, Ph.D., Science Buddies
Deana Nickerson, U.S. Air Force
/-/https/www.sciencebuddies.org/cdn/Files/3033/5/Geo_img032.jpg)
Objective
Estimate the diameter of the Earth's core by measuring seismic waves around the globe.
Introduction
The shock waves spreading out from an earthquake are called seismic waves (from the Greek word for earthquake). There are two general types of seismic waves: body waves and surface waves.
- Body waves travel through the Earth's interior.
- Surface waves, which are analogous to water waves, travel just beneath the Earth's surface.
There are two types of body waves, P-waves and S-waves. P-waves (also called primary waves) are compression waves. Like sound waves, they consist of compressions and rarefactions of the material through which they travel. The compressions and rarefactions are in the same direction that the wave is traveling. S-waves (also called secondary waves) are transverse (or shear) waves, meaning that the ground moves perpendicularly to the direction of travel. S-waves have much higher amplitude than P-waves, but travel more slowly. S-waves carry more destructive force than P-waves.
Another difference between P- and S-waves is that S-waves cannot travel through the Earth's core, while P-waves can. S-waves can therefore be detected by seismometers near the epicenter of an earthquake, but not by more distant seismometers. P-waves can be detected by both local and some distant seismometers. Figure 1 below is a cross-section of the Earth, showing how P-waves and S-waves travel through the various layers. Because of the varying density of the layers, the waves are refracted as they pass through the different layers. This is analogous to the refraction of light waves when they pass from air to water, for example.
/-/https/www.sciencebuddies.org/cdn/Files/3029/3/Geo_img030.gif)
A diagram of a cross-section of the Earth shows how earthquake waves travel in curved lines through the inner layers of the Earth. Waves are able to travel through the crust, upper mantle, lower mantle, and outer core but are unable to travel through the inner core.
Figure 1. "Cross section of the whole Earth, showing the complexity of paths of earthquake waves. The paths curve because the different rock types found at different depths change the speed at which the waves travel. Solid lines marked P are compressional waves; dashed lines marked S are shear waves. S waves do not travel through the core but may be converted to compressional waves (marked K) on entering the core (PKP, SKS). Waves may be reflected at the surface (PP, PPP, SS)." (Robertson, date unknown).
Looking at how P- and S-waves travel through the Earth has helped seismologists determine the composition of Earth's core. To understand this, look at Figure 2 below, which is another cross-section of the Earth, this time showing how Earth's core causes a seismic shadow, which is an area where seismic waves from a given earthquake cannot be detected. Seismologists found that if an earthquake is detected more than a certain distance away from its epicenter, the seismic waves detected are radically different. Specifically, after a certain distance, the primary P- and S-waves disappear almost completely. This is because the primary S-waves cannot travel through the Earth's core, and the primary P-waves that go through the core are refracted, as shown in Figure 2 below. However, surface waves are still present (as the surface waves travel just below Earth's surface, not through the core). Even further away from the epicenter, some P waves are detected, as these are the P-waves that traveled through the Earth's core and were refracted (shown as path "K" in Figure 2). However, there are still no primary S-waves. Seismologists determined that Earth must have a molten, fluid outer core to explain these observations—this explains the different seismic shadows observed for the P- and S-waves.
/-/https/www.sciencebuddies.org/cdn/Files/3031/3/Geo_img047.gif)
A diagram of a cross-section of the Earth shows how earthquake waves travel in curved lines through the inner layers of the Earth. Waves are able to travel through the crust, upper mantle, lower mantle, and outer core but are unable to travel through the inner core. P shadows and S shadows are areas of the Earth where P-waves and S-waves cannot be detected due to their inability to pass through the inner core. If the cross-section of the Earth was a clock face with the epicenter of an earthquake at the 12 o'clock position, the P shadow would be between 3-4:30 and the S shadow would be between 4:30-6.
Figure 2. The Earth's liquid outer core creates a seismic shadow distant from the location of a quake. See text above for details. (Louie, 1996b)
The location of the seismic shadow can actually be used to estimate the diameter of the Earth's core. To understand how this works, take a look at Figure 3 below. If you know that the Earth's radius is about 6370 kilometers (km), assume that the S- and P-waves travel in a straight line through the Earth (when the P-waves do not go through the core), and know the angle between the earthquake's epicenter and the beginning of the seismic shadow (as measured at the center of the Earth), you can use some trigonometry to calculate the radius of Earth's core! (You can see in Figure 2 above that the S- and P-waves do not travel in a straight line, but here we are using a straight line to give an approximation.) In Figure 3, you can see that 105° is assumed to be the angle where the seismic shadow begins to take effect, but you will be determining the actual angle where this happens. In this geology science project, you will use global seismometer data from earthquakes to measure the actual angle between earthquakes and their seismic shadows, and use the angle you find to calculate the diameter of the Earth's core.
/-/https/www.sciencebuddies.org/cdn/Files/3032/8/Geo_p022_Fig3.jpg)
A diagram of a cross-section of the Earth shows how the epicenter of an earthquake, the earthquakes S-shadow and the center of the inner core can be used to estimate the radius of the Earth's core. A triangle is drawn from the three points so the radius of the Earth is equal to the length of two sides of the triangle. The radius of the Earth's core is calculated using an assumed angle between the earthquake's epicenter and its seismic shadow of 105 degrees.
Figure 3. Using the angle between a given earthquake and its seismic shadow to estimate the diameter of the Earth's core. In the diagram, the question mark labels the radius of the Earth's core, which is what you will be solving for. The angle between the earthquake and its seismic shadow is assumed to be 105°, but you will be determining the actual angle in this science project. "S" is the maximum distance that P- or S-waves travel before reaching the seismic shadow. (These waves do not travel in a straight line, as shown in Figure 2 above, but we are using a straight line here to give an approximation.) Once you determine the maximum angle between earthquakes and their seismic shadows, you can use this information along with a little trigonometry and the fact that the Earth's radius is about 6370 km to figure out the radius of the Earth's core. (You do not need to know "S.") (Louie, 1996b)
Take a look at Figure 4 below to see how you can use global seismometer data to determine where the seismic shadow is for a given earthquake. In Figure 4, seismic wave data are shown from three different seismometer stations that are progressively more distant from the earthquake. The distance of each seismometer station from the earthquake source is shown on the y-axis, and elapsed time since the earthquake is plotted on the x-axis. By connecting the seismogram components (e.g., P-wave, S-wave, surface wave [also called the L-wave]) in each seismogram, you can construct a travel-time curve, showing the speed of each component as it travels through the Earth. You will be using this type of diagram in this science project to see when the S- and P-waves disappear from their expected position because of the core's seismic shadow.
/-/https/www.sciencebuddies.org/cdn/Files/3030/3/Geo_img046.gif)
An example Travel Time graph uses the difference in the time between S-waves and P-waves of an earthquake to calculate the distance of a station to an epicenter. The difference in time between the S-wave and P-wave of an earthquake is graphed on the y-axis and the distance in degrees is graphed on the x-axis. Three decreasing lines are present on the graph, each corresponding to a different seismogram. The corresponding x value for any value of y, with respect to a point on a graphed line, is the distance a seisometer station is from the epicenter of an earthquake.
Figure 4. Travel time curves for P-waves, S-waves and surface waves. The y-axis shows the distance from the earthquake event, and the x-axis shows the elapsed time since the event. (USGS, 2006)
In this geology science project, you will use the Global Earthquake Explorer program to examine worldwide earthquake data. You will use this data to estimate the starting point for the "seismic shadow" of the primary S- and P-waves. Finally, you will use the seismic shadow measurements and some trigonometry to estimate the diameter of the Earth's core.
Terms and Concepts
- Earthquake
- Seismic waves
- Body waves, including P-waves and S-waves (also called P and S phases)
- Surface waves, also called L-waves
- Earth's core
- Seismometers
- Epicenter of an earthquake
- Seismic shadow
- Seismogram or seismographs
- Travel-time curve
Questions
- Can you explain the differences between P-waves and S-waves?
- How do P-waves and S-waves look different on a seismogram, such as shown in Figure 4 above?
- What do you expect to see on a seismogram taken in the seismic shadow of a given earthquake?
- What causes earthquakes?
Bibliography
This science project uses Global Earthquake Explorer (GEE) software, a Java-based program with versions for all three major flavors of personal computer (Windows, Mac, Linux). You can find download the program and user manual from:
- The Global Earthquake Explorer (GEE). (2006). About GEE. Department of Geological Sciences, University of South Carolina and the IRIS Consortium. Retrieved January 8, 2013.
To help you get started on your background research, here are some useful articles on the passage of seismic waves through Earth's interior, seismograms, and historic earthquake information:
- Robertson, E.C. (2011, January 14). The Interior of the Earth. United States Geological Survey, (USGS) General Interest Report. Retrieved January 8, 2013.
- Louie, J. (1996, Oct. 10). Earth's Interior. The Nevada Seismological Laboratory, University of Nevada, Reno. Retrieved January 8, 2013.
- United States Geological Survey (USGS). (2012, July 14). Seismographs - Keeping Track of Earthquakes. U.S. Department of the Interior. Earthquake Hazards Program. Retrieved January 8, 2013.
- United States Geological Survey (USGS). (n.d.). Search Earthquake Catalog. U.S. Department of the Interior. Earthquake Hazards Program. Retrieved April 9, 2018.
Materials and Equipment
- Computer with high-speed Internet access and printer
- Pencil or pen
- Lab notebook
Experimental Procedure
Downloading and Installing the Software
-
This project uses Global Earthquake Explorer (GEE) software, a Java-based program with versions for all three major flavors of personal computer (Windows, Mac, Linux). You can find download the program and user manual from:
Global Earthquake Explorer (GEE). (2006). About GEE. Department of Geological Sciences, University of South Carolina and the IRIS Consortium. Retrieved January 8, 2013, from http://www.seis.sc.edu/gee/about.html- Click the appropriate link for your type of computer, and follow the instructions to download the program and install it on your computer.
- Note that the program requires high-speed Internet access in order to work properly.
- The program requires Java, but the installer should automatically take care of this for you if the Java Runtime Environment is not already installed on your computer.
- If you have problems with the installation, you can find complete documentation for the program (in pdf format, requires Adobe Acrobat) at: http://www.seis.sc.edu/gee/docu.html.
- Before running the program, take some time to read through the user's manual that comes with it so that you are familiar with how the program works.
Obtaining and Analyzing Earthquake Data
- Start the Global Earthquake Explorer program on your computer.
- On the startup screen, click on the option, "Explore Recent Earthquakes," as shown in Figure 5 below.
/-/https/www.sciencebuddies.org/cdn/Files/3033/5/Geo_img032.jpg)
Screenshot of the opening screen of the Global Earthquake Explorer Program includes seven menu options. The option to "Explore Recent Earthquakes" is highlighted at the top of the list directly under the Global Earthquake Explorer header. The other menu options are: explore a regional hotspot, seismograph day viewer, real time viewer, intro into GEE module, detecting the layered earth module, and longitudinal and transverse waves module.
Figure 5. Global Earthquake Explorer startup screen (GEE, 2006).
-
You will see a world map (similar to the one shown in Figure 6 below) displaying earthquake activity from the past 7 days.
- Noteworthy earthquakes are displayed as circles.
- The map is automatically centered on the largest earthquake in the time period.
- The size of the circles is related to the magnitude of each quake.
- The color of the circles is related to the depth of each quake.
- When you 'mouse over' the circle for each earthquake, the status line at the bottom of the map displays information about the quake.
- The blue triangles show seismic stations with available data. (Be patient, it takes awhile for the program to check on what data is available.)
/-/https/www.sciencebuddies.org/cdn/Files/3034/5/Geo_img033.jpg)
Screenshot of a world map generated in the Global Earthquake Explorers program with circles and symbols overlaying the map. Circles represent earthquakes and blue triangles represent data collecting stations. There are between 3-20 blue triangles spread throughout any given continent, with the exceptions of Antarctica which has 2 and North America which has a veyr large number of blue triangles completely covering the east and west coast of the United States. In this particular map there are 2 major earthquakes represented by large circles over Papua New Guinea and the other off the cost of Senegal. 6 smaller earthquakes are also circled over Indonesia, Japan, the Aleutian Islands, the western coast of Canada, the eastern coast of Mexico and the northern part of Chile.
Figure 6. Global Earthquake Explorer World Map tab screen shot (GEE, 2006).
- The controls at the top of the map, as shown in Figure 7 below, are fairly self-explanatory.
/-/https/www.sciencebuddies.org/cdn/Files/3035/5/Geo_img034.jpg)
A cropped screenshot from the Global Earthquake Explorers program shows a toolbar with 8 selectable options. From left to right the tool icons allow you to: Select earthquakes and seismometer stations, zoom in, zoom out, move the map, restore the map to normal size, de-select all seismometer stations, get help and load seismometer data.
Figure 7. The controls at the top of the Global Earthquake Explorer World Map.
-
From left to right in Figure 7, the controls allow you to:
- Select earthquakes and seismometer stations
- Zoom in and out on the map
- Pan (i.e., click-and-drag) the map
- Restore the map to normal size
- De-select all seismometer stations
- Get help
- Load seismometer data
For more details, see the Help menu in the program.
-
By default, the World Map shows noteworthy earthquakes from the previous week. So you have more earthquakes to investigate, select data from previous time periods by choosing Edit/Earthquakes/Noteworthy Earthquakes from the program menu.
- You will see a dialog box like the one shown in Figure 8 below which you can use for selecting archived earthquake data.
- Select earthquakes of magnitude 7 or greater for the previous year.
- You can also use the USGS Historic Worldwide Earthquakes webpage (USGS, 2012), which is listed in the Background tab in the Bibliography section, to find the dates, times, and locations of specific earthquakes of interest.
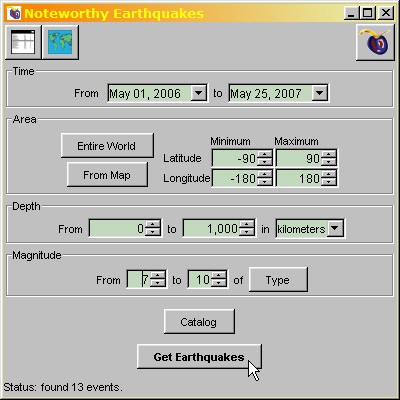
Screenshot of the noteworthy earthquakes dialog box in the Global Earthquake Explorers program. The dialog box allows a user to input parameters to search for a specific earthquake. Earthquakes can be searched based on time, area, depth and magnitude.
Figure 8. Noteworthy Earthquakes dialog box screenshot, showing how to select earthquakes of magnitude 7 or greater over a year.
-
Get seismometer data from a particular earthquake by doing the following:
-
Select an earthquake of interest by clicking on its colored circle, as shown in Figure 9 below. The map will re-center (east-west) on the selected earthquake, and the program will check to see which seismometer stations have data available for the selected quake. (Be patient, it takes awhile for the program to check on what data is available.)
- In your lab notebook, record the location, date, and magnitude of the earthquake you selected.
-
Click to select several (about seven to ten) blue seismometer stations at increasing distances from the earthquake. Include stations at a progression of distances that are less than 105° from the epicenter as well as stations that are more than 105° from the epicenter.
- Tip: When the mouse hovers over a seismometer station, the status line at the bottom displays how far away from the event the station is (in degrees).
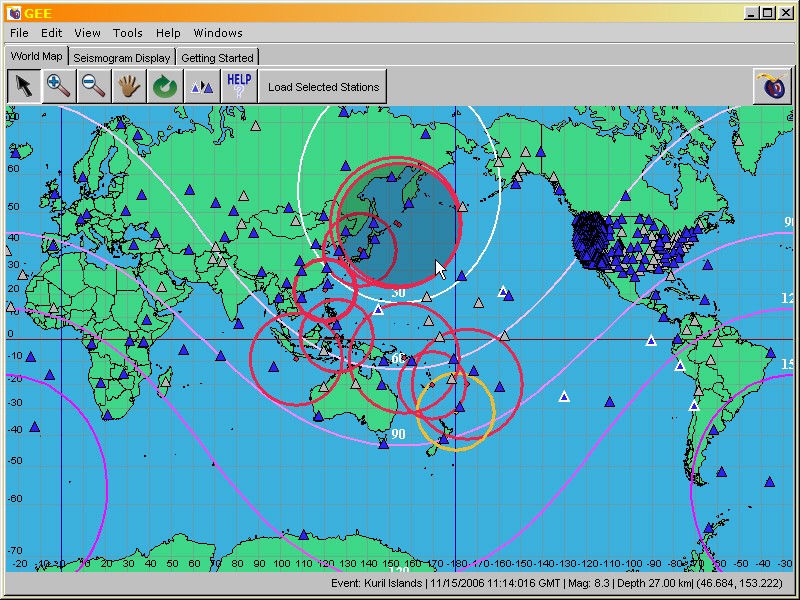
Screenshot of a world map generated in the Global Earthquake Explorers program with circles and symbols overlaying the map. Circles represent earthquakes and blue triangles represent data collecting stations. There are between 3-20 blue triangles spread throughout any given continent, with the exceptions of Antarctica which has 2 and North America which has an uncountable number of blue triangles completely covering the east and west coast of the United States. In this particular map there are 10 earthquakes represented by circles 3 are over Japan, 1 over Taiwan, 1 over Sumatra, 1 over Indonesia, 1 over Papua New guinea, 1 over New Zealand and 2 near Samoa.
Figure 9. Select an earthquake of interest by clicking on its circle.
-
Click on the "Load Selected Stations" button on the top to load seismometer data from the selected stations. The program will retrieve the data and switch to the Seismogram Display tab, as shown in Figure 10 below.
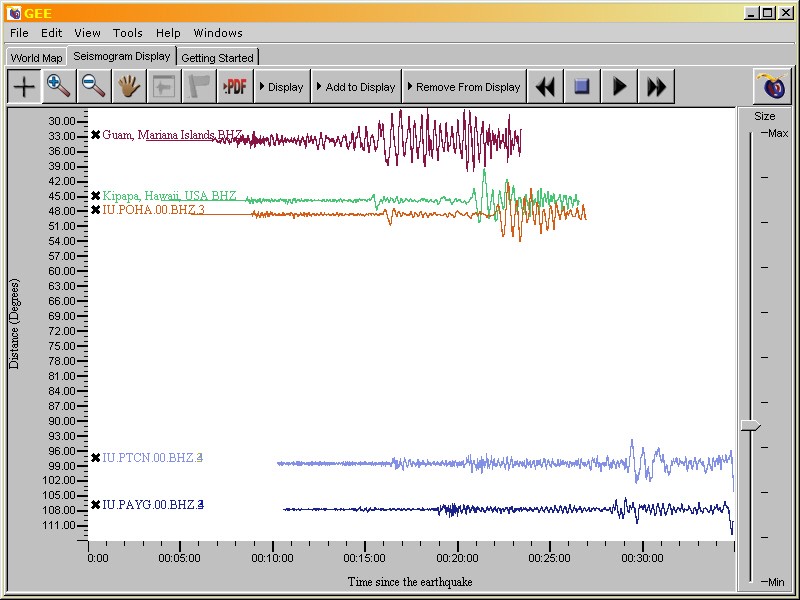
Figure 10. Clicking on "Load Selected Stations" will load seismometer data from the selected stations, as shown here.
- Each station record is shown in Figure 10 above. The distances along the y-axis reflect the distance of the station from the earthquake source, in degrees.
-
Change the display by clicking on the "Display" button and selecting the following settings, as shown in Figure 11 below:
- Plot as Record Section
- Maximize Amplitude
- Align on Event Origin Time
-
Select an earthquake of interest by clicking on its colored circle, as shown in Figure 9 below. The map will re-center (east-west) on the selected earthquake, and the program will check to see which seismometer stations have data available for the selected quake. (Be patient, it takes awhile for the program to check on what data is available.)
/-/https/www.sciencebuddies.org/cdn/Files/3038/3/Geo_img044.jpg)
/-/https/www.sciencebuddies.org/cdn/Files/3036/3/Geo_img042.jpg)
/-/https/www.sciencebuddies.org/cdn/Files/3037/3/Geo_img043.jpg)
/-/https/www.sciencebuddies.org/cdn/Files/3039/3/Geo_img045.jpg)
Three settings are selected in the Display drop-down menu in the Global Eearthquake Explorers program. The selected options are labeled: Plot as Record Section, Maximize Amplitude and Align on Event Origin Time.
Figure 11. In the "Display" control, select the three settings shown here.
-
Spend some time looking at the seismometer data from each station. How do the seismograms change as the distance from the earthquake increases?
-
The tools at the top of the Seismogram Display tab are as follows:
- The "+" button allows you to delete a station's seismogram (by hovering over and clicking on the station's name on the left),
- The "+" and "-" magnifying glass icons allow you to zoom in and out of the data, respectively.
- The hand icon allows you to pan (i.e., click-and-drag) through the data.
- The "PDF" icon allows you to save the seismograms (requires Adobe Acrobat Reader).
-
For each seismogram from each station, try to locate the primary P-wave, S-wave, and L-wave, as shown in Figure 4 in the Background tab.
- Tip: The S-wave comes after the P-wave (the S-wave travels slower) and the S-wave should have a larger amplitude than the P-wave (the S-wave carries more destructive force). The L-wave should arrive after the P- and S-waves and the L-wave should have a larger amplitude than the S-wave.
- It can be challenging to identify the different waves in a seismogram. If you are unfamiliar with analyzing seismograms, you may want to look for additional images that have the P-wave, S-wave, and L-wave labeled.
- Keep in mind that waves are refracted as they pass through Earth's different layers, as shown in Figure 1 in the Background tab. For this science project, you only want to analyze the primary P- and S-waves, not the refracted waves.
- Note: Not every seismogram will have a primary P-wave, S-wave, and L-wave. If you are unsure why this is, reread the Introduction in the Background tab.
-
Save the seismometer data by clicking the "PDF" icon and print them out. Label the different waves in each seismogram that you identified in step 8b. Connect travel-time curves for P-wave, S-wave, and surface wave components, as shown in Figure 4 in the Background tab.
- If you had trouble locating the expected primary P- and S-waves in step 8b, focus on identifying overall changes in the seismograms as the distance from the earthquake increases. At what distance (in degrees) does it look like there are waves missing from the beginning of the seismograms?
-
At what distance from the earthquake (in degrees) do the primary S- and P-waves no longer appear?
- In your lab notebook, record the maximum distance of the seismogram (in degrees) where you still see primary P- and S-waves and record the distance of the next seismogram (in degrees), the one in which you first no longer see P- and S-waves.
- Does it look like the P-waves return at a later distance?
-
The tools at the top of the Seismogram Display tab are as follows:
- Repeat steps 7 to 8 for at least a total of ten different large earthquakes.
-
From the ten or more earthquakes you analyzed, what is the maximum distance (in degrees) at which the S- and P-waves disappear? (Why do you think it is important to use the maximum distance?) Record this angle in your lab notebook and use it to estimate the diameter of the Earth's core by following the method shown in Figure 12 below.
- The triangle at the top of Figure 12 is an isosceles triangle because two sides are equal (both are the radius of the earth).
-
Since it is an isosceles triangle, the angle can be cut in half and we can work with one of these right triangle halves, as shown in the bottom panel.
- "Your angle" is the maximum distance (in degrees) at which the S- and P-waves disappear.
-
Use the law of cosines to solve for the radius of the core (the line in red, next to the red question mark).
- Using the law of cosines in a right triangle, we know that the cosine of the angle equals the adjacent length of the triangle (the radius of the Earth's core) divided by the hypotenuse of the triangle (6370 km).
- We can use a derivation of this formula to solve for the radius of the Earth's core, as shown at the bottom of Figure 12. Specifically, the radius of the Earth's core equals 6370 km multiplied by the cosine of your angle divided by two.
- This process should give you the approximate radius of the Earth's core. Do not forget to multiply by two to get the diameter of the Earth's core.
/-/https/www.sciencebuddies.org/cdn/Files/4480/6/Geo_p022_Fig12.jpg)
A drawn cross-section of the Earth shows how the epicenter of an earthquake, the earthquakes S-shadow and the center of the inner core can be used to estimate the radius of the Earth's core. A triangle is drawn from the three points so the radius of the Earth is equal to the length of two sides of the triangle. The radius of the Earth's core is calculated using an assumed angle between the earthquake's epicenter and its seismic shadow of 105 degrees.
Figure 12. This diagram shows you how you can calculate the radius of the Earth's core (in red, next to the question mark). For "Your angle," use the maximum distance (in degrees) at which the S- and P-waves disappear. Solve for the radius of the Earth's core using the bottom triangle, where you should use your angle divided by two.
Ask an Expert
Global Goals
The United Nations Sustainable Development Goals (UNSDGs) are a blueprint to achieve a better and more sustainable future for all.
/-/https/www.sciencebuddies.org/cdn/Files/19754/5/E-WEB-Goal-11.png)
Variations
- In this geology science project, you assumed the S- and P-waves were straight lines to more easily solve for the radius of the earth's core. However, you know that these waves are not actually straight lines, as shown in the Background tab in Figures 1 and 2. Devise a mathematical way to more accurately determine the diameter of the earth's core by accounting for the fact that the waves are curved and not straight.
- For a more basic project on the speed of seismic waves, see the Science Buddies Project Idea How Fast Do Seismic Waves Travel?
Careers
If you like this project, you might enjoy exploring these related careers:
/-/https/careerdiscovery.sciencebuddies.org/cdn/Files/1359/18/VNIIOarctic.jpg)
/-/https/careerdiscovery.sciencebuddies.org/cdn/Files/1713/17/pexels-photo-3769021.jpg)
/-/https/careerdiscovery.sciencebuddies.org/cdn/Files/1402/17/unsplash-anvQH3z5vBY.jpg)

/-/https/img.youtube.com/vi/SjNR8mQKDqo/0.jpg)
/-/https/img.youtube.com/vi/ETtdNMbRwL4/0.jpg)
/-/https/img.youtube.com/vi/TtAENPSThI4/0.jpg)