Abstract
Have you ever wanted to take a short cut? How about when doing your math homework? In this experiment you can learn how estimation can save you time doing math calculations. But beware, some estimations are better than others! Can you match this sample size with the best population? How accurate are your estimation skills?
Summary
None
Readily available
No hazards
Sara Agee, Ph.D., Science Buddies
/-/https/www.sciencebuddies.org/cdn/Files/2215/6/Math_img029.gif)
Objective
In this experiment you will estimate the number of beans in small, medium, and large populations to test if estimates are more accurate for small or large populations.
Introduction
Sometimes, everyone wants to take a short cut to get the job done. Sometimes a shortcut can be a bad thing, but sometimes it can save you a lot of time and come pretty close to doing a good job. One time-saving shortcut when dealing with numbers is estimation. Estimation allows you to do a complex calculation more quickly, and can be useful when a quick answer is more important than an accurate answer.
Accuracy is how close a measurement or calculation is to the actual value. When making an estimate, it is good to have an answer that is as accurate as possible. What if you are doing an estimate of how much money you will need to bring to the store? An accurate estimation will leave you with enough money to buy what you need, but an inaccurate estimation might leave you at the cash register without enough money!
How can you make an accurate estimation? One way is to match the size of the sample with the size of the population. A sample is a small portion of what you are calculating that you use to make your estimation. A sample is supposed to represent a model of the entire population, or group. To get an accurate estimate, it is important that the size of the sample fit the size of the entire group. It can't be too small or too large, but just right.
In this experiment, we will try to get a good estimate of the number of beans in a jar. We will use three different population sizes, small, medium, and large. Will our sample size be a good fit for one of these groups? Which group will our sample give the best estimate for?
Terms and Concepts
To do this type of experiment you should know what the following terms mean. Have an adult help you search the Internet, or take you to your local library to find out more!
- estimate
- multiplication
- division
- subtraction
- sample
- calculation
- error
- accuracy
Bibliography
- Regan, S. (2025, May 1). 8.9 Using Sample Data to Make Estimates about Populations. CK-12. Retrieved May 13, 2025
Materials and Equipment
- measuring spoons
- measuring cups
- glass jars
- dried beans
Experimental Procedure
- Fill three glass jars with three different measures of dried beans: small (1/2 cup), medium (one cup), and large (two cups). These will be your three different populations that you will make an estimate for.
- To estimate the number of beans in each jar, you will need to take a sample of beans to use for your estimates.
- Measure 1 Tablespoon of beans. Count the number of beans in 1 Tablespoon:

An orange square represents a blank space where students can write how many beans are in a tablespoon.
- Now you need to calculate the number of Tablespoons of beans in each of your jars. If there are 8 Tablespoons in 1 cup, how many Tablespoons are in half of a cup? Divide 8 by 2 to get your answer. How many Tablespoons in 2 cups? Multiply 8 by 2 to get your answer:
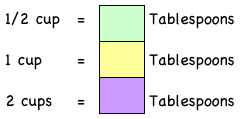
Three squares are used as blank spaces for students to write how many tablespoons are in a cup. Green squares represent half a cup, yellow squares are a single cup and purple squares are two cups.
- Now you are ready to make your estimates by multiplying the number of beans you counted in 1 Tablespoon by the number of Tablespoons in 1/2 cup, 1 cup, or 2 cups:
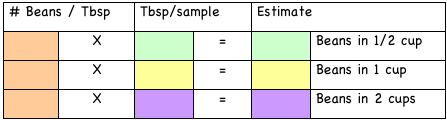
A chart to help students estimate the number of beans in each jar based on the number of beans that can fit in a tablespoon. Three jars are filled with half a cup, a cup and two cups of beans. The first column is the number of beans in a tablespoon. The second column is how many tablespoons are in a half a cup, a cup and two cups. The final column multiplies the number of beans per tablespoon and the tablespoons per jar to get an estimate on how many beans are in each jar.
- Now comes the hard part! You need to open the jars and actually count the beans so that we can calculate how accurate our estimates were. Open each jar, count the number of beans inside and put the data in this data table below.
- Last, we need to calculate which estimate had the largest error, the small population (1/2 cup), the medium population (1 cup), or the large population (2 cups). We are going to do this in a very simplified way, we will calculate the difference in number between the estimate and the actual counted number of beans by subtracting:
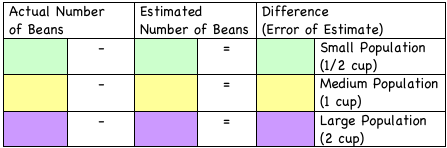
This chart compares the actual number of beans contained in three jars to their estimates. The first column requires students to open each jar and count the number of beans. The second column is the estimated number of beans for each jar. The third column is the difference between the actual number of beans and the estimated number of beans for each jar.
- Compare the error of the small, medium and large populations. Which group had the estimate with the least error? Which group had the estimate with the largest error? Can you think of a way to minimize the error, or make a better estimate?
/-/https/www.sciencebuddies.org/cdn/Files/2212/6/Math_img026.gif)
/-/https/www.sciencebuddies.org/cdn/Files/2213/6/Math_img027.gif)
/-/https/www.sciencebuddies.org/cdn/Files/2214/6/Math_img028.gif)
/-/https/www.sciencebuddies.org/cdn/Files/2215/6/Math_img029.gif)
Ask an Expert
Variations
- Another way to change this variable is to have one population of beans that you wish to estimate (2 cups), and to take multiple sample sizes (1T, 2T, 3T). The calculations for this method are slightly different from the experiment above, can you figure them out? How does the accuracy of these estimates compare?
Careers
If you like this project, you might enjoy exploring these related careers:
/-/https/careerdiscovery.sciencebuddies.org/cdn/Files/827/18/pexels-photo-3874622.jpg)
/-/https/careerdiscovery.sciencebuddies.org/cdn/Files/1442/17/unsplash-TXxiFuQLBKQ.jpg)

/-/https/img.youtube.com/vi/WsDQWPpTzZM/0.jpg)
/-/https/img.youtube.com/vi/yBgMJssXqHY/0.jpg)
/-/https/img.youtube.com/vi/SpP5A1OxZnQ/0.jpg)