Abstract
Do you love to make music, but do not have access to all the instruments you would love to play? Check out this fun science fair project about the physics of musical sound production. You will make musical instruments with drinking straws, one for each note on a one-octave major scale. Can you figure out the right lengths for a series of straw "oboes" in order to play a musical scale?
Summary
You must have an understanding of waves or a willingness to learn about them in order to do this science fair project. Familiarity with a musical instrument and playing a reed instrument is helpful, but not required.
Readily available
No issues
Andrew Olson, PhD, Science Buddies
/-/https/www.sciencebuddies.org/cdn/Files/5694/8/music_frequencies_straws_img.jpg)
Objective
To make a series of musical instruments using drinking straws that correspond to the eight notes of a one-octave major scale.
Introduction
In this science fair project, you will be making simple "oboes" using drinking straws. You will find that the pitch of the note that your straw "oboe" can play depends on the length of the straw. By learning about sound waves and how they are produced in the straw, you should be able to figure out what lengths to use in order to create a series of eight straws that play a musical scale (do-re-mi-fa-so-la-ti-do).
You will also explore the science of musical sounds and find out how sound is produced and how sound is perceived. This will help you understand what makes a sound musical.
Once you understand the basics of musical sounds, this is a fairly simple science fair project that explores the science of musical sounds. What exactly do we mean by musical sounds? It will help if you think about it step by step. First you need to understand the basics of sound: how it is produced and how it is perceived. Then you can consider what makes a sound musical.
You will also need to understand some basic properties of waves to get the most out of this project. You can read a quick introduction here, but for a more complete understanding, we recommend some background research on your own. The Bibliography section, below, has some good starting points for research before you begin this science fair project.
How is sound made? Sound is produced by vibrations of objects. The vibrations push and pull on air molecules, changing the air pressure. The pushes cause a local compression of the air (increase in air pressure), and the pulls cause a local rarefaction of the air (decrease in air pressure). The compressions and rarefactions are rapidly transmitted through the air (from the original source) as an expanding wave, making sound. Sound itself is a wave, a pattern—simple or complex, depending on the sound—of changing air pressures. For example, when you throw a stone into a still pond, you see a pattern of waves rippling out in circles on the surface of the water, centered at about the place where the stone went in. Sound waves travel through the air in a similar manner, but in all three dimensions. If you could see them, the pattern of sound waves from the stone hitting the water would resemble an expanding hemisphere. The sound waves from the stone also travel much faster than the rippling water waves from the stone (you hear the sound long before the ripples reach you). The exact speed depends on the number of air molecules and how they are moving, which are reflected in the air pressure and temperature. At sea level (one atmosphere of pressure) and room temperature (20° Celsius), the speed of sound is about 344 meters/second (m/s).
How do we perceive sound? When the sound waves reach a thin, flexible membrane in our ears (called the tympanic membrane, or eardrum), the change in pressure causes the membrane to vibrate. The vibrations are amplified by, and transmitted through, the inner ear, where they are turned into nerve impulses by cells called hair cells. The nerve impulses are conducted to the brain, where they are further processed, leading ultimately to the perception of sound.
You have seen that one way to describe a wave is by its speed. In addition to wave speed, you will also find it useful to describe waves by their frequency, period, and wavelength. Let us start with frequency. The top part of Figure 1, below, represents the compressions (darker areas, increases in pressure) and rarefactions (lighter areas, decreases in pressure) of a pure-tone (i.e., single-frequency) sound wave traveling in air. If you measured the changes in pressure and graphed the results, you could see how the pressure changes over time, as shown in the bottom part of Figure 1. The peaks in the graph correspond to the compressions and the troughs correspond to the rarefactions.
/-/https/www.sciencebuddies.org/cdn/Files/3494/14/sound-wave-air-pressure-graph.png)
Sound waves move in a pattern of high density and low density air molecules as they approach a detector. The detector measures high pressure and low pressure air and sends the data to a monitor that graphs the sound waves as pressure over time. The graph has high peaks when the air molecules are moving closely together and dips in low troughs when the air molecules are spaced further apart.
Figure 1. Illustration of a sound wave as compression and rarefaction of air, and as a graph of pressure vs. time (Henderson, 2004).
Notice how the pressure rises and falls in a regular cycle. The frequency (f) of a wave describes how many cycles of the wave occur per unit time. Frequency is measured in hertz (Hz), which is the number of cycles per second. Figure 2, below, shows examples of sound waves of two different frequencies.
/-/https/www.sciencebuddies.org/cdn/Files/3495/15/frequency-waves-high-low.gif)
Graph of high frequency waves has a wavelength that has 6 peaks and 6 troughs. The low frequency wave graph on the bottom has only 3 peaks and 3 troughs in the same amount of time.
Figure 2. Graphs of high (top) and low (bottom) frequency waves (Henderson, 2004).
Figure 2 also shows the period (T) of the wave, which is the time that it takes for a single cycle of the wave to pass. The period is simply the reciprocal of the frequency (T = 1/f). For a sound wave, the frequency corresponds to the perceived pitch of the sound. The higher the frequency, the higher the perceived pitch. On average, the frequency range for human hearing is from 20 Hz at the low end to 20,000 Hz at the high end.
The wavelength is the distance (in space) between corresponding points on a single cycle of a wave (e.g., the distance from one compression maximum (crest) to the next). The wavelength (λ), frequency (f), and speed (v) of a wave are related by a simple equation: v = fλ. So if you know any two of these variables (wavelength, frequency, or speed), you can calculate the third.
So far, the sound waves you have looked at graphically have been pure tones (i.e., single-frequency sound waves). What happens when you start combining tones of different frequencies? The sound waves interfere, which basically means that they add together. When waves add together, they add algebraically. A "trough" (or rarefaction, in the case of a sound wave) will cancel out a "crest" (or compression, in the case of a sound wave) of the same magnitude. Figure 3, below, shows the sound pressure wave (green) that results when two pure tones are played with one tone (red) at twice the frequency of the other (blue). This 2:1 ratio of tone frequencies corresponds to notes that are one octave apart.
/-/https/www.sciencebuddies.org/cdn/Files/3496/8/Phys_img017.gif)
Example graph shows two sound waves of different frequencies combining to create a third wave. Two individual sounds are played with one (red) having twice the frequency of the other (blue). When played at the same time another sound (green) is created from the combination or interference of the two individual sounds.
Figure 3. Interference pattern (green) for two tones one octave apart. The frequency of the wave in red is twice the frequency of the wave in blue. (Henderson, 2004).
Our perception of whether the interference sounds pleasant (the musical term is consonant) or jarring (dissonant) depends on the ratio of the frequencies of the tones. Specifically, within an octave, the ratio can be determined by dividing the frequency of a note within the octave by the frequency of the first note of the octave. For example, the frequency of middle C is 262 Hz, and the frequency of G in the same octave is 392 Hz. The ratio for this G note is 392 Hz divided by 262 Hz, which equals 3/2, or 1.5. Figure 4, below, shows an octave of piano keys (starting at C and continuing to C'), and Table 1 gives the perfect whole-number ratios for the frequencies of the notes. You can see that, within an octave, the intervals that are generally considered to be consonant end up having frequency ratios with the numerator and denominator being small whole numbers. (For details on the subtleties of how pianos are actually tuned, see the Einevoldsen reference in the Bibliography.)
/-/https/www.sciencebuddies.org/cdn/Files/3497/8/Phys_img018.gif)
Figure 4. An octave on the piano, from one C to the next (C to C'). (Einevoldsen, n.d.).
| Ratio | Name of Interval | Example from C to: | Perception |
|---|---|---|---|
| 135/128 | Major Chroma | C-sharp | Dissonant |
| 9/8 | Major Second | D | Dissonant |
| 6/5 | Minor Third | E-flat; | Consonant |
| 5/4 | Major Third | E | Consonant |
| 4/3 | Perfect Fourth | F | Consonant |
| 45/32 | Diatonic Tritone | F-sharp | Dissonant |
| 3/2 | Perfect Fifth | G | Consonant |
| 8/5 | Minor Sixth | A-flat | Consonant |
| 5/3 | Major Sixth | A | Consonant |
| 9/5 | Minor Seventh | B-flat | Dissonant |
| 15/8 | Major Seventh | B | Dissonant |
| 2/1 | Octave | C' | Consonant |
Table 1. Whole-number ratios ("just temperament") for note frequencies for an octave.
In the last part of this brief introduction to sound waves, you will learn how sound is produced by musical instruments. First consider a stringed instrument, like a guitar or a piano. The strings in these instruments are attached at each end. One end wraps around a tuning peg, which can be twisted to change the tension on the string. The other end is attached to a fixed point. In between the two attachment points, the string passes over a bridge, which is attached to the soundboard. When the string is plucked (guitar) or struck (piano), it vibrates. The vibrations are transmitted by the bridge to the soundboard of the instrument, which amplifies the sound (in the case of the guitar, the entire body is the soundboard).
The string vibrates between two fixed points: where it touches the bridge and where it touches the tuning peg. In the case of the guitar, if your finger is pressing down on a string, that point becomes the new fixed point, effectively shortening the string. The vibration results in a standing wave on the string. The fixed points of the string do not move (these are nodes), while other points on the string oscillate back and forth maximally (these are antinodes). Figure 5, below, shows some of the standing wave patterns that can occur on a vibrating string.
/-/https/www.sciencebuddies.org/cdn/Files/3498/8/Phys_img020.gif)
Figure 5. Standing waves on a vibrating string, showing the following vibrational modes, from top to bottom: fundamental (or first harmonic), second harmonic, third harmonic, etc., until the sixth harmonic, at the bottom (Nave, 2006a)
The string can vibrate at several different natural modes (harmonics). Each of these vibrational modes has nodes at the fixed ends of the string. The fundamental mode (Figure 5, top) produces the fundamental frequency, which is usually the pitch of the note we perceive. The fundamental mode has a single antinode halfway along the string, and thus its wavelength is twice the length (L) of the string. The second harmonic produces a pitch that sounds one octave higher than the fundamental frequency, and has a node halfway along the string. Thus, the wavelength of the second harmonic is equal to the length of the string.
In an open-ended column of air, the situation is similar to the vibrating string, but the standing wave in the air column has antinodes at the each end rather than nodes, as shown in Figure 6, below. This is because at the open ends, the air is free to move maximally.
/-/https/www.sciencebuddies.org/cdn/Files/3499/8/Phys_img021.gif)
/-/https/www.sciencebuddies.org/cdn/Files/3500/6/Phys_img022.gif)
/-/https/www.sciencebuddies.org/cdn/Files/3501/8/Phys_img023.gif)
Figure 6. Standing waves in an open-ended column of air. Shown are the fundamental (left), second harmonic (middle) and third harmonic (right). (Henderson, 2004)
There is a reference in the Bibliography (Nave, 2006b) that has a calculator for determining the frequencies (fundamental and second through fifth harmonics) produced by a column of a given length. You might find this calculator useful as you work out the correct lengths for your straw "oboes." Now let us get started on cutting those straws!
Terms and Concepts
- Sound wave
- Wave
- Sound
- Wave speed
- Frequency
- Period
- Pitch
- Wavelength
- Interference
- Octave
- Standing wave
- Harmonics
- Musical scale
Questions
- How are wavelength and frequency of a wave related?
- What is the wavelength of a 1000-Hz sound (at sea level, 20° C)?
- For a wind or woodwind instrument, what determines the pitch of the note played?
- Two notes, C1 and C2, are an octave apart. C1 is the lower note. What is the ratio of their frequencies, f2/f1? What is the ratio of their wavelengths, λ2/λ1?
Bibliography
Waves: the first reference is a good general introduction, and those that follow cover the specific topics indicated by their titles:
- Henderson, T. (n.d.). Sound Waves and Music. The Physics Classroom. Retrieved February 20, 2014.
- (a) Nave, C.R. (2006). Standing Waves on a String. Retrieved March 27, 2006.
- (b) Nave, C.R. (2006). Resonances of Open Air Columns. Retrieved March 27, 2006.
This resource shows what the frequencies of different musical notes are:
- Byrd, D. (2007, August). A Table of Musical Pitches. Retrieved June 12, 2024.
Why does the musical scale have 12 notes (counting both the black and white keys on the piano)? Here is a good explanation:
- Enevoldsen, K. (n.d.). Twelve-Tone Musical Scale. Retrieved March 27, 2006.
Materials and Equipment
- Box of plastic or paper drinking straws. Paper straws work best and can be purchased from online suppliers such as Amazon.com.
- Scissors
- Tape measure, metric
- Piano, electronic keyboard, or other musical instrument that can produce a scale of notes for comparison
- Lab notebook
Experimental Procedure
- Do your background research and make sure that you understand the terms, concepts and questions in the Background section.
- To make and play a single straw "oboe," follow these steps:
- Flatten about 2 centimeters (cm) at one end of a drinking straw. You can use your teeth or pinch it between your fingers or fingernails to flatten it.
- Use scissors to make two, small, angular cuts on each side of the flattened end, as shown in Figure 7, below.
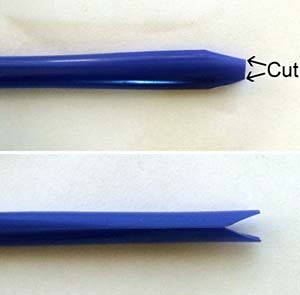
Figure 7. The "reed" end of a straw oboe, shown from two different angles.
- Insert the reed end of the straw into your mouth. Position the reed flaps just inside your lips, curve your lips down and inward a little, and apply light pressure with your lips.
- Blow through the straw. The reed flaps should vibrate and produce a tone. You may need to move the straw around slightly to locate the best position for creating your musical note.
- Note: If you are not used to playing a reed instrument, it may take some practice and repeated tries to produce a constant, single note.
- You can cut portions off the non-flattened end of the straw to create tones of different pitches. How does making the straw shorter change the pitch? Can you explain why this happens?
- Next, make a series of eight straw "oboes" to play the eight notes of a scale by varying their lengths. For a scale starting with C, these eight notes correspond to the white keys on the piano: C, D, E, F, G, A, B, C. Refer to Figure 4 in the Introduction for an illustration and to Table 1, also in the Introduction, for the correct ratios between the frequencies of these notes.
- Start with the lowest and highest notes, which are one octave apart. From your background research, you should know how to make two straw "oboes" that will produce notes one octave apart.
- It will help if you match your lowest note to a note on the piano. That way you can check your "oboe" scale with the piano when you are finished.
- There is a reference in the Bibliography ((b) Nave, 2006) that has a calculator for determining the frequencies (fundamental, and second through fifth harmonics) produced by a column of a given length. You may find this helpful for determining what possible range of notes your straw can make so you can be sure to pick frequencies and notes within this range.
- Keep in mind that the fundamental frequency is usually the pitch of the note we perceive, and that the second harmonic produces a pitch that sounds one octave higher than the fundamental frequency.
- To figure out the exact frequencies of different notes, you can use the Michigan Technological University resource in the Bibliography.
- Calculate the straw lengths needed to build six more "oboes" to fill in the rest of the notes in the scale.
- You may want to continue using the (b) Nave, 2006 reference in the Bibliography and its calculator for determining the frequencies produced by a column of a given length. You may find this calculator useful as you work out the correct lengths for your straw "oboes."
- Again, to figure out the exact frequencies of different notes, you can use the Michigan Technology University resource in the Bibliography.
- In your lab notebook, make a data table that keeps track of the lengths of the different straws and the expected fundamental frequencies.
- Once you have made the straw "oboes," practice playing them. Try to play them each in the same way (such as by placing your lips in the same place relative to the end of the reeds, and applying the same amount of pressure from your lips). This will help you have consistent results so you can best compare the sounds from the different straw "oboes" to each other.
- Record any observations you make when playing the straw "oboes" in your lab notebook. You could include your observations in the data table you made in step 3.c.
- Start with the lowest and highest notes, which are one octave apart. From your background research, you should know how to make two straw "oboes" that will produce notes one octave apart.
- Compare the scale you made with the scale on the piano. Do all your notes sound right?
- You can record any observations you make in the data table in your lab notebook.
/-/https/www.sciencebuddies.org/cdn/Files/5694/8/music_frequencies_straws_img.jpg)
Ask an Expert
Variations
- Build a holder for your eight straws so that you can hold them all and play them in succession. You could even play a simple melody by playing them in the correct sequence.
- Other instruments you can construct a scale with include:
- Soda bottles filled with different amounts of water, blow across the top
- Goblets filled with different amounts of water, with a clean, slightly wet finger, stroke around the rim of the glass to excite vibrational modes. It makes an eerie sound.
- Both of these instruments are columns of air with a single open end. The twist with this type of instrument is that only odd harmonics of the fundamental are produced. There is a reference in the Bibliography ((b) Nave, 2006) that has a calculator for determining the frequencies (fundamental, third, and fifth harmonics) produced by a column of a given length with one end closed. You may find this calculator useful as you work out the correct amounts of water for filling your soda bottles or goblets.
Careers
If you like this project, you might enjoy exploring these related careers:
/-/https/careerdiscovery.sciencebuddies.org/cdn/Files/1640/26/Fyysikot_tyossaan.jpg)
/-/https/careerdiscovery.sciencebuddies.org/cdn/Files/1147/17/unsplash-fJebhGIP0P4.jpg)
/-/https/careerdiscovery.sciencebuddies.org/cdn/Files/1801/18/pexels-photo-4988130.jpg)

/-/https/img.youtube.com/vi/YdVwjqPa7M8/0.jpg)
/-/https/img.youtube.com/vi/41RzGwZINOk/0.jpg)
/-/https/img.youtube.com/vi/WSRv89CiM-0/0.jpg)