Abstract
Have you ever wondered what life is like for different animals, and where it is that they roam? For example, how large is the area they live in, and why do they go to different locations? While we can set up cameras to watch animals that live on land, it can more challenging to see the lives of animals that live underwater, especially in the vast oceans. In this ocean science project, you will use satellite tracking data to learn about the activity patterns of harbor porpoises. How far do they travel? Can you find patterns in the routes individual animals take? Can you correlate their route with environmental factors such as currents or ocean temperatures? You can do this science project to answer these questions and find out more about the lives of these fascinating marine mammals.Summary
By Beth Jewell, Einstein Distinguished Fellow, Office of Education, NOAA
Edited by Andrew Olson, Ph.D., and Teisha Rowland, Ph.D., Science Buddies

Objective
Determine whether there is a pattern to the movement of harbor porpoises and, if so, find out if the pattern correlates with certain currents, ocean temperatures, or other environmental factors.
Introduction
Whales, dolphins, and porpoises are all cetaceans (which are marine mammals that belong to the order Cetacea). Many members of this group have been classified as endangered or threatened because of human activities. Harbor porpoises (Phocoena phocoena), like the one shown in Figure 1, below, are listed as threatened due to gillnet fishing methods in eastern Canada. It is estimated that nearly 1,000 harbor porpoises are killed each year due to the fishing methods used in the Gulf of Maine and Bay of Fundy (NOAA, November 2010). To better understand the harbor porpoises, and develop better conservation methods to help restore harbor porpoise populations, satellite telemetry is used to study the movements of harbor porpoises.
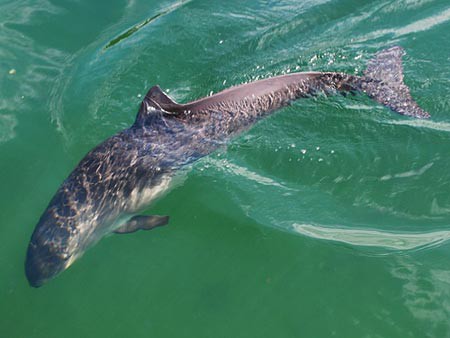
Figure 1. This is a picture of a harbor porpoise (Phocoeana phocoena). (Image credits: Erik Christensen, 2009)
The movements of harbor porpoises are studied by attaching small satellite transmitters to animals. Movement data emitted by the transmitters are downloaded from the National Oceanic and Atmospheric Administration (NOAA) weather satellites to the ARGOS Global Processing Centre in Landover, Maryland. The data can then be accessed online. Researchers are able to collect more or less continuous information on the distribution and movement of the tagged porpoises.
In this ocean science project, you will use these online data to determine whether there is a pattern to the movement of harbor porpoises and, if so, find out if the pattern correlates with certain environmental factors. What triggers the movements of the harbor porpoises? Are they following food sources? Does the bottom topography or the motion of the currents guide them? Does temperature play a role? Or are they out there simply exploring the ocean? Get ready to check out some data to find out!
Terms and Concepts
- Cetaceans and the order Cetacea
- Harbor porpoises (Phocoena phocoena)
- Satellite telemetry
- Satellite transmitters
- National Oceanic and Atmospheric Administration (NOAA)
- ARGOS
- Bathymetric maps
Bibliography
The WhaleNet website has data from archived satellite tagging projects, tracking maps, and information on how to interpret tagging data:
- Williamson, J.M. (n.d.). WhaleNet Archive of STOP Data, Maps, and Information. WhaleNet. Retrieved January 8, 2020.
The National Buoy Center has oceanographic data in real time:
- National Oceanic and Atmospheric Administration (NOAA). (December 11, 2013). National Data Buoy Center. Retrieved June 6, 2014.
Here is a resource on satellite tracking:
- Service Argos. (2001). Basic Description of the Argos System. Retrieved June 6, 2014.
This webpage has links to information on marine mammals:
- NOAA. (n.d.). NOAA Fisheries Feature. Retrieved June 6, 2014.
To do this science project, you will need to download bathymetric maps from the following webpage:
- NOAA. (n.d.). National Ocean Service Bathymetric & Fishing Maps: Download Maps as Scanned Images. National Geophysical Data Center. Retrieved June 6, 2014.
This publication includes statistics for how many harbor porpoises are seriously injured or killed due to fisheries:
- NOAA. (November 2010). Harbor Porpoise (Phocoena phocoena phocoena): Gulf of Maine/Bay of Fundy Stock. Retrieved June 6, 2014.
Materials and Equipment
- Computer to download data from the internet
- Lab notebook
Experimental Procedure
The examples below take you through the process of making various tracking measurements for a single harbor porpoise. In order to test a hypothesis about porpoise movements, you will need to repeat the measurements for as many porpoises as possible.
Calculating Distances between Satellite Fixes
- From the WhaleNet Archive of STOP Data, Maps, and Information, scroll down to the "Archived Satellite Tagging Projects" section and click on one of the animals in the "Harbor Porpoise" section. "Gus" has been chosen for this example.
- Track Map: you will need to print this map out to use later. It shows the locations of "Gus" where satellite fixes were made.
- Data Sheet - Satellite Fixes: this is a data table with the latitude and longitude of each satellite fix on "Gus". You will need to use this information with the Distance Generator.
- Open the Distance Generator by clicking on the link at the bottom of the "Gus" page. The Distance Generator page has a form where you can enter latitude and longitude data. The form will calculate the distance between the two points.
- From the Satellite Data Sheet, copy and paste the latitude and longitude from the first sighting of "Gus" into the "From" box on the Distance Generator form. (You will need to remove "Lon1 :" from this entry.)
- Repeat your steps for the "To" location.
- To calculate how far "Gus" has traveled during this study, copy the latitude and longitude from the last entry (23.03.04) and paste this information in the To box. (Again, you will need to remove "Lon1 :" from this entry.)
- Click on the "Look it up!" button. You should come up with 632 miles. The problem with this calculation is that it is as the crow flies and any side trips "Gus" takes aren't taken into account. To be more accurate you will need to do the calculations between each sighting and add your results.
Productivity and the Movement of "Gus"
- From the WhaleNet Archive of STOP Data, Maps, and Information, click on a harbor porpoise. "Gus" has been chosen for this example.
- On this page you will need to obtain data about "Gus" in two places: "Gus" Track Map and Productivity Map. Print both of these maps. Note that the redder colors on the Productivity Map indicate areas of higher concentrations of chlorophyll.
- Compare the two maps. Do you see any correlations between chlorophyll productivity and the location of "Gus"?
Bathymetry and the Movement of "Gus"
- From the WhaleNet Archive of STOP Data, Maps, and Information, click on a harbor porpoise. "Gus" has been chosen for this example.
- On this page you will need to obtain data about "Gus" from the Track Map. Print this map.
- Download and print bathymetric maps from the National Ocean Service Bathymetric & Fishing Maps webpage for the same areas that the harbor porpoise moves in.
- When comparing the movement of "Gus" with bathymetry (the depth of the ocean floor), do you see any correlations?
- What do your results tell you about how environmental factors might influence the movement of harbor porpoises?
Ask an Expert
Global Connections
The United Nations Sustainable Development Goals (UNSDGs) are a blueprint to achieve a better and more sustainable future for all.

Variations
- Use the map scale to estimate the total distance the harbor porpoise has traveled. What is the average daily distance it has traveled? What has its average daily speed (mph) been?
- Do you see points on your tracking map which seem suspicious? Which ones, and how do you explain them?
- Why is the harbor porpoise traveling along its current path? What environmental factors might influence the track? To answer this, you will need additional data. For example, you can look at buoy data for wind direction, speed, gust, significant wave height, swell and wind-wave heights and periods, air temperature, water temperature, and sea level pressure. Some buoys also report wave directions. You may also want to look at bathymetric maps to get an idea of the topography looks like below the surface.
- Describe the movements of the harbor porpoise. By looking at its movements, can you tell if it is migrating, nesting, or feeding?
Careers
If you like this project, you might enjoy exploring these related careers:


Related Links
- Science Fair Project Guide
- Other Ideas Like This
- Ocean Sciences Project Ideas
- Big Data Project Ideas
- Space Exploration Project Ideas
- My Favorites