Abstract
If you've ever so much as watched a news clip about a hurricane, you probably know that hurricanes draw their power from warm ocean waters. If that is true, does it mean that hurricanes actually cool the ocean down when they pass through? Can the amount of cooling be measured? Is it proportional to the strength of the hurricane? Find out using data that you can collect yourself using online archives. This project shows you how.Summary
Sources
- Background references on hurricane formation selected from the an NSDL/NSTA web seminar on hurricanes:
Van Gundy, S. and R. Payo, 2006. NSDL/NSTA Web Seminars: Hurricanes, National Science Digital Library/National Science Teacher's Association. Retrieved May 17, 2006.
/-/https/www.sciencebuddies.org/cdn/Files/2522/5/OceanSci_img017.png)
Objective
If hurricanes get their power from warm ocean waters, does this mean that after a hurricane passes the ocean surface will be cooler? If so, is the amount of cooling proportional to the strength of the hurricane? The goal of this project is to test both hypotheses using historical hurricane and sea surface temperature data.
Introduction
The dramatic image is from a computer model of Hurricane Katrina, developed at NOAA's Geophysical Fluid Dynamics Laboratory (GFDL, 2005). The sea surface temperature in the Gulf of Mexico is color-coded (see legend at bottom left). The model's track for the hurricane (white line) and the actual observed positions of the hurricane (magenta dots) are shown. The model predicts a strong cooling effect associated with the hurricane's path. (For a higher-resolution version of this image, and an animation of the model, see the Bibliography (GFDL, 2005)).
/-/https/www.sciencebuddies.org/cdn/Files/2522/5/OceanSci_img017.png)
A 3-D model shows hurricane Katrina traveling over water in the Gulf of Mexico. Water from the gulf is color coded based on temperature. All water in the surrounding area is colored red. A small trail of water behind the hurricane is colored blue, this indicates that the hurricane cools the surface of the water as it travels over it.
GFDL model of Hurricane Katrina showing a cooling wake trailing the path of the hurricane.
In this project you will use your web browser to collect data on hurricane strength and sea surface temperature. The goal is to see if there is a consistent cooling effect after a hurricane passes. If you find such an effect, is the amount of cooling proportional to the strength of the hurricane? Each hurricane will be one data point on your graph, so you will need to collect data from many, many hurricanes to make a reliable graph.
In this project you will be analyzing two kinds of archived data:
- hurricane track data, and
- meteorological data from monitoring buoys.
The Experimental Procedure section has instructions on how to access the archived data. The hurricane track data will show you the location of the storm (best-track analysis, with positions given every six hours), and two measures of the hurricane strength: central pressure and wind speed. The meteorological data will be using for this project is the sea surface temperature, recorded hourly from monitoring buoys. Note that the monitoring buoys also collect other interesting information (wind speed and direction, barometric pressure, and wave height information) which you may also wish to analyze (see the Variations section for some ideas to get you started).
A hurricane lasts for many days, it constantly moves, and its strength usually fluctuates during its lifetime. We have to start somewhere, though, so the method we will use is to look for the peak intensity of the hurricane, and take all of the measurements relative to that time and location. In the procedure, we have (arbitrarily) picked 3 days before the hurricane and 1 day after as the two endpoints for measuring temperature changes. When you do your background research, you should learn as much as you can about how fast hurricanes travel and how big they are. Is three days earlier enough time, or might the hurricane already have an influence on water temperature at this point? Use the information you gather from your background research to pick your own time window.
Before you start collecting data, you should do background research on how hurricanes form and grow. The next two sections will help you get started with your background research.
Terms and Concepts
To do this project, you should do research that enables you to understand the following terms and concepts:
- Air pressure
- Aair density
- Hadley cells
- Saffir-Simpson scale for hurricane strength
Questions
- How do hurricanes form?
- In what part of the hurricane is the air pressure lowest?
- Why are warm water temperatures important for hurricane formation?
Bibliography
- There are many websites where you can find background information on hurricanes. You'll want to learn about how hurricanes form, which means learning about global wind patterns, and areas of high and low air pressure, among other things. The following web sites are good places to start:
- DAS, 1999. Hurricanes: Online Meteorology Guide, Department of Atmospheric Sciences, University of Illinois at Urbana-Champaign. Retrieved May 17, 2006.
- UCAR, 2001. Pressure: Surface Highs and Lows, University Corporation for Atmospheric Research. Retrieved May 17, 2006.
- NOAA's Geophysical Fluid Dynamics Laboratory has a webpage with computer modeling results for hurricanes:
GFDL, n.d. Hurricane Visualizations, Geophysical Fluid Dynamics Laboratory, NOAA. Retrieved April 11, 2018. - Test your knowledge of hurricane formation with this interactive applet (requires Java). You can drag a hurricane around to areas with different water temperature and see what happens to it!
Whittaker, T. and S. Ackerman, 2005. Hurricane Applet, Weatherwise, University of Wisconsin. Retrieved May 17, 2006. - This is one of many online sources of historical hurricane data. We chose this website because the track maps include index information at selected data points so that you can easily correlate position and date (the one drawback is that the background color of the maps is black):
Unisys, 2004. Atlantic Tropical Storm Tracking by Year, Unisys Weather. Retrieved May 17, 2006. - The National Data Buoy Center has current and historical meteorological data from a network of continuous monitoring buoys:
NDBC, 2006. National Data Buoy Center, NDBC, National Oceanic and Atmospheric Administration. Retrieved May 17, 2006. - For calculating distances on your hurricane track map, try this longitude and latitude distance calculator:
CSGNetwork.com, 2006. Length of a Degree of Latitude and Longitude, CSGNetwork.com. Retrieved May 17, 2006.
Materials and Equipment
To do this experiment you will need the following materials and equipment:
- Computer with Internet access and printer.
Experimental Procedure
- Do your background research so that you are knowledgeable about the terms, concepts, and questions.
- The procedure will show you how to look up information for a single hurricane. You will need to repeat the data collection for many more hurricanes in order to test the hypothesis. You should collect data for no less than 40 hurricanes (even more is better). Not every storm will have a data buoy nearby. To see how close the buoy is, you can use an online calculator to convert degrees of latitude and longitude to other distance scales (CSGNetwork.com, 2004). If reliable sea surface temperature data is not available for a particular storm, don't use it in your data set.
Accessing Archived Hurricane Data
- The National Hurrican Center and Central Pacific Hurricane Center website is a good source for historical hurricane data. Your goal is to use the Hurricane Data page to gather data about various storms. For many of the storms, you can obtain the data in both map and tabular formats. You will then use the data in the next section to look up buoy information for the same storms. Note that the interface for the page may change, but you should be able to find the information described below.
- On the hurricane website, shown in the screenshot below, you can browse through hurricanes in different areas. You can view the Atlantic, Eastern Pacific, and Central Pacific hurricane seasons by clicking on "Atlantic," "Eastern Pacific," or "Central Pacific" shown in the green box in the screeshot. For this project, we recommend focusing on the Atlantic ocean, since there are a lot of data buoys (explained in next section) in the Gulf of Mexico and along the eastern seaboard of the United States.
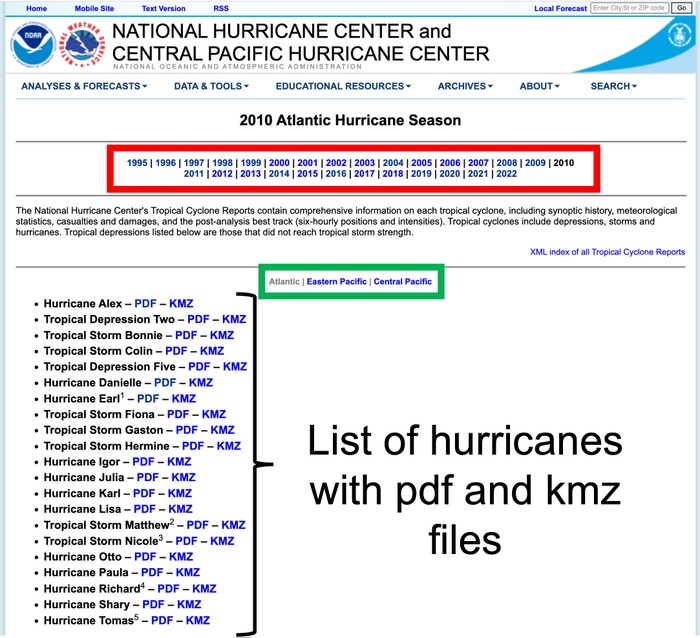
- Once you are on the Atlantic Hurricane Season page, you can browse through hurricane data dating back to 1995 (shown in the red box in the screenshot above). Clicking on a year date brings you to a list of all recorded hurricanes for that year. The list will state the storm category and its name. At the bottom of the page, you will also find a map that shows the tracks of each hurricane listed.
- Next to the hurrican name, click on the pdf link to view detailed storm information. Clicking on the pdf link will bring up a report about that storm. The information provided may include a brief summary of the storm history, meteorogical statistics data, damage statistics, maps of the storm's progress with numbered points that correspond to the dates, graphs of the storm's intensity and pressure over time, and several data tables. The data table that is most relevant for this project is the table of tracking information with the date/time, latitude, longitude, pressure, wind speed, and storm stage. Here is an explanation of the data columns you may see in the table:
- Date/Time: date and time of the measurements, in the format "dd/hhZ". The "Z" stands for "Zulu," which is one of many ways to refer to Coordinated Universal Time or UTC (also known as Greenwich Mean Time, or GMT). The hours are in 24-hour format, so "0000" means midnight, and 1800 means 6 pm. The table caption includes the time frame of the storm. You can find the month information there.
- Latitude: latitude of the hurricane center.
- Longitude: longitude of the hurricane center (negative numbers correspond to degrees west of 0°).
- Wind Speed (kt): wind speed in knots (nautical miles per hour; 1 nautical mile equals 1.15 miles).
- Pressure (mb): air pressure at hurricane center, in millibars (mb).
- Stage: information on the stage of the storm.
- More recent hurricanes also include a kmz file that you can download and open in Google Earth. In Google Earth you can view the track of the storm over time as shown in the screenshot below. Clicking on an individual data point brings up information about location (latitude, longitude), minimum sea level pressure, and maximum storm intensity for this specific time point.
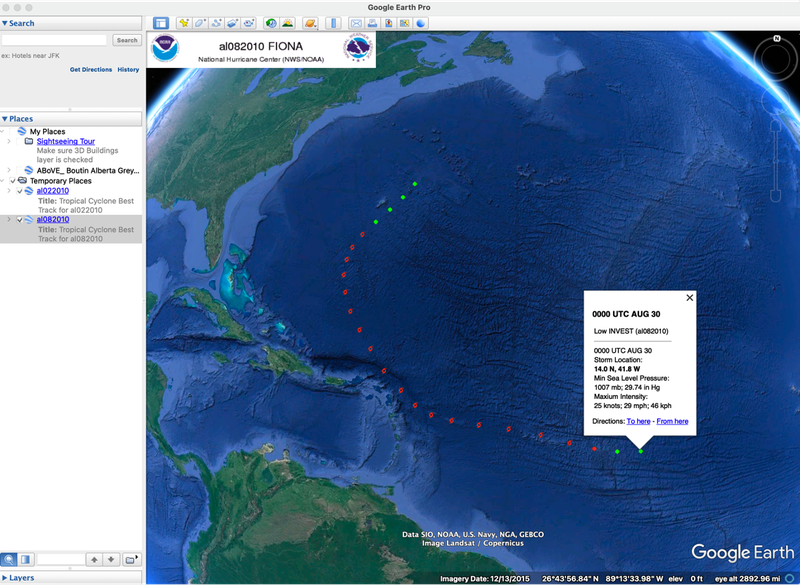
- In the data table or in Google Earth, look through the provided wind and pressure data for each time point to find the entry where the hurricane was at its maximum strength. Look up the latitude/longitude for that data point. Copy the wind speed, pressure, longitude and latitude information for that data point into a spreadsheet program like Microsoft Excel® or Google Sheets®. Add a column at the right for "sea surface temperature." In the spreadsheet, make a separate row for each storm.
- Next you will try to find a data buoy near this location.
/-/https/www.sciencebuddies.org/cdn/Files/19084/6/hurricane-report-page-2010-atlantic.jpg)
/-/https/www.sciencebuddies.org/cdn/Files/19085/6/google-earth-storm-track.png)
Accessing Archived Meteorological Data from Buoys
- The next step is to find the sea surface temperature at the location where the storm reached its peak. The National Oceanic and Atmospheric Administration (NOAA) maintains a network of moored buoys with sensors that continuously monitor ocean conditions. The data records, with hourly readings, are archived and available online at the National Data Buoy Center (NDBC, 2014). For this project, you will be accessing sea surface temperature data from the buoys. The monitoring buoys also collect other interesting information (wind speed and direction, barometric pressure, and wave height information) which you may also wish to analyze (see the Variations section, for some ideas to get you started). The following directions will help you locate buoys near the hurricane track and access their archived data. (Keep in mind that the interface of the website may change or may not match exactly the steps described here.)
- Go to National Data Buoy Center. You'll see a world map with colored markers representing buoys. You can use your mouse and the map controls to pan and zoom around the map or click the name of a region (e.g. "Caribbean Sea") to jump to that area.
- The legend identifies which buoys have recent and historical information. Not all of the buoys will have sea surface temperature information.
- Clicking the symbol for a buoy will bring up a pop-up box, from which you can access additional information about the buoy or historical data. You can also see the latitude and longitude of the buoy. Try to find the buoy closest to the location you found in the previous section (when the hurricane was at its maximum strength).
- If you click "View Details," you will find information about the data buoy, including the owner, the type of buoy, the instrumentation onboard ("payload") and the buoy's latitude and longitude. On this page, you will also find links to additional information you may find useful. "Description of Measurements" tells you what the measurements the data buoy takes and the units that the data are reported in. "Data Inventory" tells you what data is available for past time periods.
- If you click "View History," you will be able to access a list of years with "Standard meteorological data." Note: this data might not be available for all buoys. If you cannot find the year you need, you might need to pick a different buoy.
- Click on the year of interest. This will bring up a "Historical Data Download" page with instructions for two different methods for accessing data. Download the text file under "Method 1," and you can open it in a spreadsheet program. Clicking on the text file name in "Method 2" opens the data file in your browser.
- At last, here it is: a year's worth of hourly records! The screenshot below shows only the first 25 hours of data, to make a few points about what you'll find. The top line is a "header" identifying the data in each column. For detailed information on the data, click the "data descriptions" link next to "Historical data" on the buoy information page. In addition to the date and time information, you'll be using the "WTMP" column, which reports the water temperature in °C. The date information is in the first three columns. The time information is in 24-hour format, and like the hurricane tracking data, is in Coordinated Universal Time (UTC, columns four and five, highlighted in red). Any data field that is "9-filled" (e.g., the right-most columns in this example) is invalid. In this case, it means that the data buoy is not equipped to collect this information. In other cases, it can indicate that a sensor is not functioning properly.
/-/https/www.sciencebuddies.org/cdn/Files/12969/9/hurricane-data-screenshot.png)
Screenshot of a hurricane datasheet including: year, month, day, hours, minutes, wind direction and speed, water and air temperature, dewpoint, barometric pressure, visibility, and tide. The columns for hour and minute are highlighted red, water temperature is highlighted in blue, visibility and tide are highlighted in yellow.
- You don't need to save the entire data file, just the time period around the hurricane of interest. You should decide for yourself (using information from your background research) what time window to use for the sea surface temperature measurements. (Since a little extra data won't hurt, you may want to collect some extra "baseline" data at each end, in case you want to analyze multiple time windows.) You can copy-and-paste the parts you need to make your own data table. Use a plain text editor (e.g., Notepad) for this. Copy-and-paste the data header line. Then scroll down and find the dates of interest and copy-and-paste the data into the same file. You should also add a line or two at the top of the table to identify the data buoy and its location. In our example, we have decided to use a single data point for each day, taken at 18:00, UTC. We did this by first copying the entire date range, and then deleting the lines we didn't need.
/-/https/www.sciencebuddies.org/cdn/Files/2533/5/OceanSci_img015.jpg)
Analyzing and Graphing the Data
- Now it's time to put it all together. Devise a measure of temperature change to apply to the data for each hurricane. For example, you could subtract the temperature at the end of the chosen time window from the temperature at the beginning of the chosen time window. For a more advanced project, you might want to get fancier and try to analyze the rate of temperature change before the hurricane arrived compared to the rate of temperature change as the hurricane passed through.
- Run your temperature calculation for each hurricane, and add the temperature change information to the hurricane's data table.
- Examine the results. Is the temperature change consistent for all (or most) hurricanes?
- Is the temperature change proportional to hurricane strength? Make a graph of temperature change (y-axis) vs. hurricane strength (x-axis, use either minimum pressure or maximum wind speed). What does the graph look like? Does it support the hypothesis? Explain why or why not.
Ask an Expert
Global Goals
The United Nations Sustainable Development Goals (UNSDGs) are a blueprint to achieve a better and more sustainable future for all.
/-/https/www.sciencebuddies.org/cdn/Files/19756/5/E-WEB-Goal-13.png)
Variations
- More advanced students can do further analysis to examine the statistical significance of the correlation using the linear regression technique. For comparison, you might want to also look at the correlation between central pressure and wind speed (should be strongly correlated). See Which Team Batting Statistic Predicts Run Production Best? for an example of statistical correlation analysis using a spreadsheet program.
- It is important to remember that correlation between two variables does not imply causality. In other words, finding a correlation shows that there is a relationship between the variables, but does not show that warmer seas cause stronger hurricanes. Finding a correlation between two variables is often the first step in explaining a causal relationship, but correlation alone is not proof of a causal relationship. Consider the possibility that cloud cover from the hurricane is responsible for any decrease in water temperature, because it blocks sunlight that would otherwise be warming the water. Can you think of a way to distinguish between this hypothesis and the original one?
- In addition to water temperature, the data buoys also collect information on wave height, air pressure, wind direction, and wind speed. Many other projects are possible using this data. For example: how far away from the hurricane center is wave height affected? How does this vary with the strength of the storm (minimum pressure at the center)? How does the wind direction change as the hurricane passes through?
- One problem with the buoy data used in this project is that there are relatively few buoys. This means that the temperature data is often collected at a point distant from the hurricane. You may want to measure the distance. More advanced students can use high-resolution satellite data for sea surface temperature measurement. The data set begins in 2002, and is available from https://oceancolor.gsfc.nasa.gov/. You will have to learn how to access the data from the instructions on the page.
- As the hurricane travels, does it have the same cooling effect throughout its path? Use data from buoys near other locations on the hurricane's track to investigate.
Careers
If you like this project, you might enjoy exploring these related careers:
/-/https/careerdiscovery.sciencebuddies.org/cdn/Files/815/17/unsplash-5hZJVGPG6vo.jpg)
/-/https/careerdiscovery.sciencebuddies.org/cdn/Files/1713/17/pexels-photo-3769021.jpg)
/-/https/careerdiscovery.sciencebuddies.org/cdn/Files/1288/18/Career-Map-Environmental-Scientist.jpg)
/-/https/careerdiscovery.sciencebuddies.org/cdn/Files/1141/17/iStock-1170687091.jpg)

/-/https/img.youtube.com/vi/5FkKL7k6QwA/0.jpg)
/-/https/img.youtube.com/vi/h2eMJwvsr4g/0.jpg)
/-/https/img.youtube.com/vi/vlDaK6GsEEQ/0.jpg)