Polar Puzzle: Will Ice Melting at the North or South Poles Cause Sea Levels to Rise?
Abstract
If you leave an ice cube out on the kitchen counter and come back to check on it in awhile, what do you find? A puddle! The same thing happens to ice in nature—if the temperature gets warm enough, it melts. In this ocean science project, you will find out what happens to sea levels if the ice at the North Pole melts, or if the ice at the South Pole melts. It is an important question for the millions of people who enjoy living along the coasts of the world.Summary
Kristin Strong, Science Buddies

Objective
Determine if melting of the northern polar ice cap or the ice sheet on Antarctica would contribute to a rise in sea levels.
Introduction
Have you ever been to a beach? Did you look for beautiful seashells? Build a sand castle? Or run away from waves as they came rolling onto shore, as the children in Figure 1, below, are doing? You might have noticed that the ocean waves come farther up the beach at certain times of the day than at others—that is due to daily tides, caused mainly by the gravitational pull of the Moon on the ocean and Earth. Tides are a normal daily rise and fall of the ocean surface. Scientists are concerned, though, that there may be a different kind of rise in the ocean surface—one not due to the Moon's pull, but due to global warming.
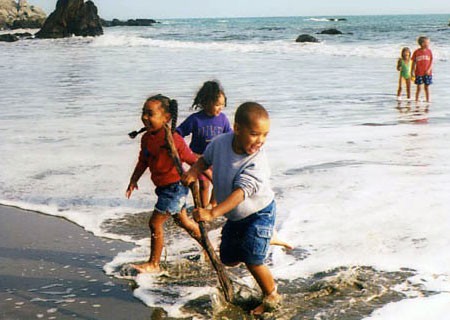 Image Credit: CA State Government / Public domain, government website
Figure 1. This photo shows children running away from waves at a beach. (State of California, 2003.)
Global warming is the increase in the average temperature of Earth's air and oceans. Global warming since the 1950's is thought to have been caused mainly by things that people do, like burn gas to drive cars, burn coal to make electricity, burn oil or natural gas to heat homes, or burn forests to make room for growing crops. The burning of all these things creates gases that trap heat from the Sun, just like the glass windows on the roof of a greenhouse—as shown in Figure 2, below—trap heat so that plants can grow, even in a cold climate. As more gases are created, more heat is trapped in Earth's atmosphere, and the average temperature of Earth's air and oceans increases. Global warming is thought to be just one aspect of climate change, which is the overall, long-term change in Earth's climate (or a region on Earth).
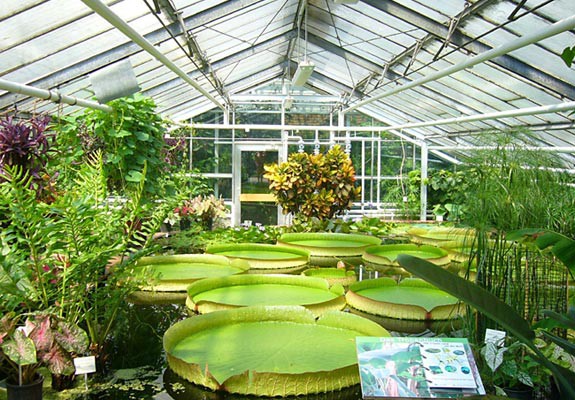 Image Credit: Wikipedia Commons / Public domain
Figure 2. This photo shows the glass roof of a greenhouse, which lets light in and traps heat inside so that plants can grow, even in a cold climate. (Wikimedia Commons, 2006.)
One concern with global warming is that as the average temperature increases, this will cause ice to melt, which could make the sea level rise. Many people around the world enjoy living near coasts, but even a small rise in sea levels will cause flooding of areas that are at a low elevation and close to the sea. In 2007, a study found that about 634 million people (about 1 in 10 people in the world) live in locations that are less than 9 meters (30 feet) above sea level and are, consequently, at risk from rising seas, as shown in Figure 3, below.
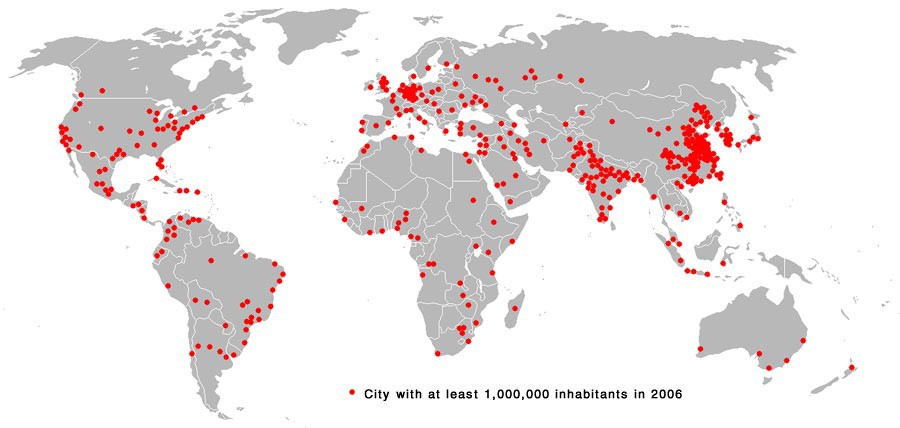 Image Credit: Wikipedia Commons / Public domain
A map of the world is covered in red dots which represent cities that have a population of over 1 million people. The largest cluster of dots are over eastern Asia and south Asia. The majority of the red dots are located near a continent's or country's coasts or large bodies of water.
Figure 3. Each red dot on this map of Earth is a city with over 1 million people. You can see that many of these big cities are close to coasts and at risk of flooding from rising seas. (Wikimedia Commons, 2007.)
In this ocean science project, you will see if ice melting near the North or South Poles will make sea levels rise. The ice in the north is in the form of a floating polar ice cap, while the ice in the south is mainly in the form of an ice sheet on top of the continent of Antarctica. If the floating ice near the North Pole were to melt, would that make the sea levels rise? What about the ice sheet on top of Antarctica at the South Pole? In this science project, you will make a model of the ice at each pole to find out!
Terms and Concepts
- Beach
- Tide
- Gravitational pull
- Global warming
- Average
- Gas
- Climate change
- Elevation
- Polar ice cap
- Ice sheet
- Continent
- Antarctica
- Model
- Trial
- Graph
Questions
- What causes tides?
- What are some of the causes of global warming?
- Why is global warming a concern for some?
- How is the ice near the North Pole and South Pole different?
Bibliography
This source describes the people who will be affected by rising sea levels:
- Greenfieldboyce, N. (2007, March 28). Study: 634 Million People at Risk from Rising Seas. Retrieved February 5, 2010.
This source describes greenhouse gases:
- UCAR. (n.d.). The Greenhouse Effect. University Corporation for Atmospheric Research, Center for Science Education. Retrieved August 10, 2023.
This source provides an introduction to global warming and climate change:
- United Nations. (n.d.). What is Climate Change?. Climate Action. Retrieved August 10, 2023.
For help creating graphs, try this website:
- National Center for Education Statistics. (n.d.). Create a Graph. Retrieved April 12, 2010.
Materials and Equipment
-
Play-Doh®, modeling clay, or homemade clay, which requires these ingredients:
- All-purpose flour (3 ½ cups)
- Salt (½ cup)
- Oil (3 tablespoons)
- Water (2 cups, boiling)
- Measuring tablespoon
- Large mixing bowl
- Fork
- Large spoon
-
Clear plastic containers, approximately 540-mL, or 2 ¼ cups (6)
- Smaller or larger containers can be used, but you will need to scale up or down the amount of dough you add to the containers.
- Note: The containers will be marked with permanent marker.
- Cold tap water
- Ice cubes (12 are needed, but you should have extra on-hand in case some get dropped and break.)
- Permanent marker
- Dry measuring cups
- Butter knife
- Liquid measuring cup, 1-cup
- Ruler, metric
- Optional: Camera
- Lab notebook
- Optional: Graph paper
Experimental Procedure
Instructions for Making Homemade Dough
Note: If using store-bought Play-Doh or modeling clay, then move ahead to the next section, Preparing Your North Pole Ice Models.- Mix 3 ½ cups of flour, ½ cup of salt, and 3 tablespoons (Tbsp.) of cooking oil in a large bowl with a fork.
- With an adult's help, carefully add 2 cups of boiling water and stir the mixture with a fork or large spoon until the mixture forms a dough. Use caution so that you do not get burned!
- Allow the dough to cool for about 10 minutes, or until it can be comfortably handled.
Preparing Your North Pole Ice Models
-
Fill three containers about one-third to half full of cold tap water.
- The water represents the ocean.
- Three containers are being used because you are going to make three trials of your experiment. Running trials helps to make sure your results are accurate and repeatable.
-
Add two ice cubes to each container.
- The ice cubes represent the floating northern polar ice cap.
- Immediately mark the water level on the side of the container with a permanent marker. Try not to get the tip of the marker wet.
- Label each of these three containers "North Pole Ice Model" with the permanent marker and set the containers aside.
Preparing Your South Pole Ice Models
- Pack one cup of dough into a measuring cup, as shown in Figure 4, below.
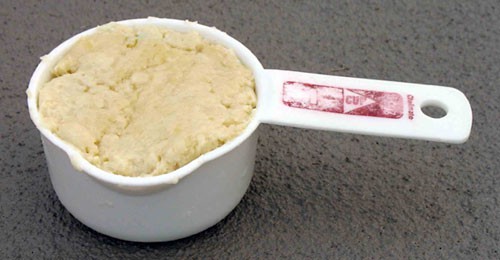 Image Credit: Kristin Strong, Science Buddies / Science Buddies
Figure 4. This photo shows the dough, packed into a 1-cup measuring cup. It will be used to make a model of the continent of Antarctica.
-
Remove the dough from the measuring cup, using a butter knife to scrape around the sides if necessary, and set the mound of dough inside one of the empty plastic containers.
- This mound of dough will represent the continent of Antarctica (the South Pole).
- Leave some space between the sides of the dough and the wall of the container all around, so that you can add water.
- Make the dough fairly flat and level on top.
-
Add approximately ¼ cup of water around the sides of the dough, so that the water level comes up about one-third to half of the way up the dough.
- The water represents the ocean.
-
Place two ice cubes on top of the dough.
- Press the ice cubes down lightly into the dough.
- The ice cubes represent the southern polar ice sheet.
- Immediately mark the water level on the side of the container with a permanent marker. Again, try not to get the tip in the water.
- Label the container "South Pole Ice Model" with the permanent marker and set the container aside.
-
Repeat steps 1–6 for two more empty plastic containers. Use the water level mark on the first cup to help you fill up the other two cups in step 3, so that they all contain approximately the same amount of water.
- You are making three models of the South Pole so that you have three trials of your experiment. Doing more than one trial helps to ensure your results are accurate and repeatable.
- You should now have six containers containing ice models—three for the North Pole and three for the South Pole, as shown in the examples in Figure 5, below:
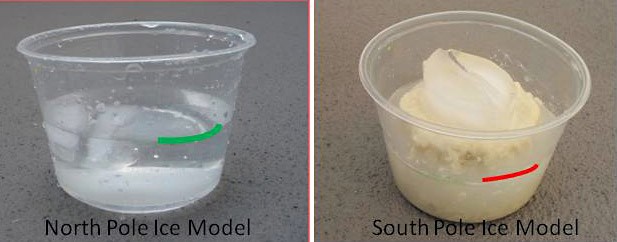 Image Credit: Kristin Strong, Science Buddies / Science Buddies
Figure 5. These photos show examples of the completed ice models. The starting level is marked on each container. You can take photos of your models with a camera for your display board if you wish.
Testing Your Ice Model
- Allow the ice in your models to melt in a place where they will not be disturbed.
- Keep an eye on the ice cubes in the South Pole model to make sure they stay balanced on the clay, and that the water from these melted ice cubes is able to run off of the clay.
- Once the ice has completely melted, get down at eye level with the water and see if the water level has risen in any of the containers. If the water level has risen, measure and record the amount of rise with a ruler, in millimeters (mm), and record it in a data table, like Tables 1 and 2 below, in your lab notebook.
| Amount of Water Rise in the North Pole Ice Models (mm) | |
|---|---|
| Trial 1 | |
| Trial 2 | |
| Trial 3 | |
| Amount of Water Rise in the South Pole Ice Models (mm) | |
|---|---|
| Trial 1 | |
| Trial 2 | |
| Trial 3 | |
- You could take photos of your models after the ice has melted for your display board, if you wish.
Analyzing Your Data Tables
-
Did you know scientists often show their data in a picture form called a graph? With a graph, you can often discover patterns in the data more easily than by looking at the numbers in the data table. Try graphing the data in your data tables. You can make the graph by hand, or use a tool like Create-A-Graph. Steps to get started with Create-A-Graph are below.
- Go to Create-A-Graph and click on Bar since you will be making a bar chart.
- Click on the Data tab to enter your data.
- Do not worry about the graph title and labels just yet. Instead, focus on the data set. Change the data set "items" to 3 and the "groups" to 2, since you have run three trials and have two groups of data, one from the North Pole and one for the South Pole.
- Under Item Label, enter the words Trial 1, Trial 2, and Trial 3.
- For the Group 1 values, enter your data from the Amount of Water Rise in the North Pole Ice Models Data Table.
- For the Group 2 values, enter your data from the Amount of Water Rise in the South Pole Ice Models Data Table.
- Click on the Preview tab to see your graph.
- You can go back and add an x-axis label (Trials), and a y-axis label (Amount of Water Rise, in mm) under the Data tab and click on Preview again to see the graph with labels.
- Once your graph looks the way you like, you can print it out.
- Looking at your graph, or your data table, did you see the water level rise when the ice melted in the North Pole model? What about when the ice melted in the South Pole model? Based on your results, which pole melting do you think is more of a concern for people who live near coasts?
Ask an Expert
Global Connections
The United Nations Sustainable Development Goals (UNSDGs) are a blueprint to achieve a better and more sustainable future for all.
Variations
- Create a different South Pole ice model in which two ice cubes are placed on the dough continent to represent the ice sheet and one ice cube is placed in the water to represent floating ice shelves surrounding and attached to the continent of Antarctica. What does this model tell you?
Careers
If you like this project, you might enjoy exploring these related careers:


