Abstract
Have you ever dreamed about becoming invisible? Or about making something else invisible, like the mess all over your room? Invisibility may sound like the stuff of science fiction (remember Star Trek's "Cloaking Device"?), but in reality, military vehicles, like planes and ships, can be made less observable, or even invisible, to different detection methods—like radar, sonar, or infrared sensors—by using stealth technology. In this engineering science fair project, you'll find out how to take invisibility from science fiction to science fact.Summary
Thank you to employees of TE Connectivity for testing, feedback, and advice on this science project.
/-/https/www.sciencebuddies.org/cdn/Files/3850/5/Phys_img101.jpg)
Objective
To determine which 3-D geometric shapes scatter the least light.
Introduction
Have you ever read any of the Harry Potter fantasy novels, or seen any of the movies? If so, you've been treated to adventures with Harry's "invisibility cloak," a special coat that allows him to creep about and not be seen by others. Invisibility is not just the stuff of fantasies and science fiction though. Scientists and engineers are constantly working on stealth technology to make military aircraft, ships, submarines, and missiles less visible (or even invisible) to other countries' military. Stealth technology is not just one technology, but a variety of methods that decrease the distance at which a vehicle can be detected by radar, infrared, sonar, or other means.
Radar is a detection system that tracks the location, speed, and direction of a vehicle by sending out (transmitting) short bursts of radio waves, and then listening for an "echo" as the waves bounce off the vehicle. By measuring how long it takes for an echo to arrive back, and how much of a frequency shift has occurred in the echo (as compared to the transmitted signal), the distance to the vehicle, its speed, and direction, can be tracked.
One way an aircraft is made more "stealthy" is by reducing its radar cross-section, or the "radar signature" that an aircraft produces. Radar cross-section is a measure of how detectable an aircraft is by radar. In the past, radar cross-section used to be directly related to the size of the aircraft. A smaller plane would have a smaller radar cross-section than a larger plane. For example, there was a small, conventional military plane from the 1940's, called the B-26. It had a wingspan of about 22 meters (m) and its radar cross-section, as shown in the diagram, was about 25 m2. A much larger conventional military plane, like the B-52, though, with a wingspan of about 56 m, has a radar cross-section of 100 m2.
/-/https/www.sciencebuddies.org/cdn/Files/3848/5/Phys_img099.jpg)
A radar cross-section consists of five circles decreasing equally in size. The largest circle is labeled 25, second largest 20, all the way down to the smallest circle labeled 5. A plane is pictured at the center of the smallest circle and is surrounded by a ring of red lines that extend outward from the plane to the edges of the radar. These red lines represent the area that the plane in the center can be seen when using a radar.
Figure 1. This drawing shows an example of a radar cross-section diagram for a military aircraft used during World War II, called the B-26. (Wikimedia Commons, 2007.)
Since the development of stealth technology, though, the radar cross-section is no longer proportional to aircraft size—meaning, you can have a stealth aircraft with a wingspan almost as big as the B-52 (like the B-2, shown in the table), but the radar cross-section can be 1,000 times smaller!
Examples of Radar Cross-Sections
| Aircraft Name and Type | Wing Span (m) | Radar Cross-Section (m2) |
|---|---|---|
| B-26 (smaller, conventional) | 21.7 | 25 |
| B-52 (larger, conventional) | 56.4 | 100 |
| B-2 (larger, stealth) | 52.4 | 0.1 |
There are many ways to reduce the radar cross-section, including:
- Simplifying the propulsion system so that it contains no moving parts.
- Using composite materials, instead of metals, to construct the airframe.
- Using radar-absorbing materials on the skin of the aircraft, like special paints or gold coatings.
- Modifying the aircraft shape, so that it contains flat surfaces and sharp edges, instead of the curved, aerodynamically friendly surfaces of conventional aircraft.
In this science fair project, you'll explore how three-dimensional (3-D) shapes affect scattering of, not radio waves, but a different kind of electromagnetic wave, visible light. Visible light has a higher energy and a shorter wavelength compared to radio waves but it is easier to measure and both scatter in a similar way. You'll create different 3-D shapes and then send out a light signal with a flashlight and measure the amount of light that is returned, with a lux meter, to see which shapes produce the strongest and weakest return.
How Stealth Technology Emerged
Very early in the history of radar, engineers realized that differently shaped aircraft produce very different radar signatures. In the 1960's, for example, the military discovered that a British bomber, called the Avro Vulcan, sometimes completely disappeared from radar, despite its relatively large size. By chance, its designers had happened upon a "stealthy shape." In contrast, the Russian bomber, known as Bear, produced a very large and bright radar signature, due to its four propellers and turbine blades.
/-/https/www.sciencebuddies.org/cdn/Files/3849/5/Phys_img100.jpg)
Figure 2. These photos show two military aircraft with very different radar signatures. The Avro Vulcan aircraft (on the left) has a stealthy shape, and sometimes disappears from radar, while the Bear aircraft (on the right) does not, and produces a large, bright radar signature. (Wikipedia, 1985, 2006.)
In the early 1970's, military planners in the United States were very interested in developing stealth aircraft, because many of their conventional bomber aircraft were shot down by surface-to-air missiles during the Vietnam War. There were limited tools available at the time for developing stealth technology, until a Lockheed computer scientist, named Denys Overholser, and a mathematician, named Bill Schroeder, created a computer simulation that included the equations of a Russian scientist, Petr Ufimtsev. Ufimtsev's model described how electromagnetic radiation (like radar) is scattered from two-dimensional and three-dimensional shapes. Using the computer simulation, it was possible, for the first time, to accurately predict (before building an aircraft) what its radar signature would look like.
In 1975, the engineers at Lockheed Skunk Works came up with a design made out of flat panels, called facets that they predicted, through their computer simulation, would have a very low radar signature, scattering 99 percent of the transmitted radar energy away from the radar receiver. Their design was laughed at, however. In fact, their first model was nicknamed "hopeless diamond," because it looked like a squashed diamond in the desert. Many thought it was "hopeless" and would never fly because the design was aerodynamically unstable.
But fly it did, thanks to the development of better flight computers that allow unstable aircraft to stay airborne. In 1981, the first Lockheed Martin F117-Nighthawk took to the skies.
/-/https/www.sciencebuddies.org/cdn/Files/3850/5/Phys_img101.jpg)
Figure 3. This photograph shows a stealthy aircraft, Lockheed Martin's F117-Nighthawk. It has flat surfaces, called facets, and very sharp edges. (Wikipedia, 2008).
You will notice that the F117 has very flat surfaces and all its edges are sharp. When radio waves hit those surfaces and edges, they scatter away from the radar receiver. You can also see that the aircraft is coated with a special radar-absorbing paint that has a matte finish. The frame is also made out of a special (non-metallic) composite material.
Take a look at a conventional aircraft, though, like the commercial jets that people fly around the country in, and you'll notice that they have shiny paint, a metal frame, and a rounded shape with lots of curves and no sharp edges. This gives commercial jets a very aerodynamic and stable shape. It also means that wherever a radar signal hits the plane, it will return a strong echo, making it highly observable on radar.
Terms and Concepts
- Stealth technology
- Radar
- Radio waves
- Radar cross-section
- Three dimensional (3D)
- Scattering
- Electromagnetic wave
- Visible light
- Illuminance
Questions
- How does radar work?
- In what ways can you reduce an aircraft's radar cross-section?
- Why are computer simulations important to the development of stealth technology?
- Why are flight computers an essential part of modern stealth aircraft?
- What are some of the differences between conventional aircraft and stealth aircraft?
Bibliography
These sources describe what stealth technology is and how it works:
- Wikipedia Contributors. (2009, April 26). Stealth technology. Wikipedia: The Free Encyclopedia. Retrieved May 1, 2009.
- Howstuffworks.com. (2009). How does stealth technology work? Retrieved May 1, 2009.
This source shows the radar cross-sections for four shapes as they are rotated 360 degrees about a vertical axis. By looking at the peaks and valleys of the radar cross-section as the shape is rotated, you will get insight into which aspect of the shape's geometry is more "stealthy":
- Alves, M.A., Martins, I.M., Coelho, A.C., Folgueras, L.C., and Rezende, M.C. (2009, Jan). Measurement and Interpretation of Radar Cross Section Data in an Educational Setting: A Comparison Between Simulations and Experiments. Retrieved January 9, 2020.
This source uses familiar sound waves to describe how the radio waves in radar work:
- Brain, M. (2009). How Radar Works. Retrieved May 1, 2009.
This source discusses radar cross-section and its mathematics:
- Scott, J. (2004, March 21). Radar Cross Section. Retrieved May 1, 2009.
For help creating graphs, try this website:
- National Center for Education Statistics (n.d.). Create a Graph. Retrieved May 1, 2009.
Materials and Equipment
- Cardboard box, approximately 17 x 9½ x 14½ inches (in.); must be tall enough to fit the width of a standard piece of paper (8½ in.).
- Black construction paper, any size is fine but you will need enough to cover the entire inside of the cardboard box
- Double-sided tape
- Scissors
- LED flashlight, with an on-off switch on the end of the handle
- Lux meter, also known as a light meter, such as the Light Meter Digital Illuminance Meter, available at Amazon.com.
- White paper, 8½ x 11 inches (only 5 sheets are needed, but get extra for errors in forming the shapes, or for further experimentation.)
- Pencil
- Protractor or ruler
- Lab notebook
- Graph paper
/-/https/www.sciencebuddies.org/cdn/Files/14236/6/stealth-technology-project-materials.jpg)
Disclaimer: Science Buddies participates in affiliate programs with Home Science Tools®, Amazon.com, Carolina Biological, and Jameco Electronics. Proceeds from the affiliate programs help support Science Buddies, a 501(c)(3) public charity, and keep our resources free for everyone. Our top priority is student learning. If you have any comments (positive or negative) related to purchases you've made for science projects from recommendations on our site, please let us know. Write to us at [email protected].
Experimental Procedure
Note: Before starting your experiment, read the instructions that come with your lux meter so that you know how to use it. Practice taking light measurements around your home from different sources. For example, see what kinds of light measurements you get from a lamp; a TV; beside a window, both with and without its blinds; and outside.
Constructing Your Test Box
- Check that the cardboard box is at least 9.5 inches tall.
- Cover all the inside surfaces of the box with black construction paper.
- Use double-sided tape to stick the construction paper to the inside of the box. Apply tape only to the back of the sheets of paper to avoid visible tape inside the box, which could affect light scatter.
- Use scissors to cut the paper to size, if necessary.
- Overlap sheets of paper to avoid gaps between sheets.
- Cover the corners of the box as good as you can.
- Using the tips of the scissors, cut a hole in the middle of the long side of the box, about 2 inches from the bottom. Make the hole just big enough for the flashlight to fit through.
- Insert the flashlight through the hole so that the light source is inside the box and the on-off switch is outside the box.
- Tape the back of the sensor part of the lux meter (the part that receives light) just above the flashlight, as shown in Figure 4. With this arrangement, the sensor and the light source are stacked one on top of the other.
/-/https/www.sciencebuddies.org/cdn/Files/14237/6/placement-light-meter-in-black-box.jpg)
Figure 4. This photo shows how to set up your flashlight, lux meter sensor, and the cord to the lux meter display on one end of the box.
- Let the display part of the lux meter hang outside one corner of the box as shown in Figure 4.
- Repair the black coverage of the box around the luxmeter, the flashlight and in the corner where the cord to the lux meter display leaves the box.
If you have a camera available, take a picture of the inside of the box and inspect the picture for reflective areas such as tape, shown in Figure 5. Fix all areas that reflect light by adding more black paper where needed and hiding tape.
/-/https/www.sciencebuddies.org/cdn/Files/14238/6/find-imperfections-in-black-box.jpg)
Figure 5. Remove or hide all reflective surfaces like the tape in this picture.
Constructing Your Test Shapes
- Form a cylinder shape out of a piece of white paper by overlapping its short ends slightly and taping them together on the inside, as shown in Figure 6. The cylinder should be able to stand upright inside the box, without having the lid of the box touch it when the box is closed.
- Crumple another piece of white paper into a loose ball, then un-crumple it, and repeat step 1.
- Fold a third piece of paper across its width into fourths, so that it has up-and-down ridges like a "W" when observed from the end. A schematic representation is shown in Figure 6. When placed upright, the shape should be able to fit inside the box, without touching the lid when the box is closed.
- Fold a fourth piece of paper in half, across its width, so that it looks like a "V" when viewed from its end as shown in Figure 6.
/-/https/www.sciencebuddies.org/cdn/Files/3852/5/Phys_img103.jpg)
Figure 6. These drawings show the four test shapes.
Finding a Good Location for Testing Inside the Box
- Place the regular cylinder in the center of the box, so that it is upright and directly in line with the flashlight, as shown in Figure 7.
/-/https/www.sciencebuddies.org/cdn/Files/14239/6/cylinder-in-black-box.jpg)
Figure 7. Top view of the test box with the cylinder placed on its test location.
- Close the box. If the flaps on the lid of the box don't stay down, weigh them down lightly with your lab notebook.
- Turn on the lux meter.
- Turn on the flashlight.
- Read the lux meter display to see how much light is being scattered back from the cylinder. In other words, the flashlight emits light, which is reflected back by the test shape. Only some of this light hits the lux meter, which is what you measure. This reading is the illuminance in lux (lx). One lux is equivalent to one lumen per square meter.
- If the display reads less than 50 lx, then turn off the flashlight, open the box, and move the cylinder closer to the light source. Make sure the cylinder is aligned with the light source. Repeat steps 2–5.
- If the display reads more than 50 lx, then turn off the light source and turn off the lux meter and flashlight.
- Open the box. Using the pencil, make a mark on the bottom of the box that shows where the edge of the cylinder that is closest to the flashlight is located as shown in Figure 8.
- You are ready to move on to the next section and begin testing your shapes.
/-/https/www.sciencebuddies.org/cdn/Files/14240/6/indication-test-shapes-on-box.jpg)
Figure 8. Top view of the test box with a mark to show the location of the test shapes. In this picture a white pencil was used to make the mark clearly visible your mark, made with a regular pencil, should not show that clearly.
Testing Your Shapes
Note: LED flashlights are brightest when they are first turned on. If they are left on for several minutes, they heat up to a steady-state temperature (they come to thermal equilibrium). This reduces their light output, since LED efficiency and light output are lower at higher temperatures. In this science fair project, you are not going to allow your LED flashlight to come to thermal equilibrium. Instead, you are going to take a measurement when the flashlight is first turned on, and then turn it off so it can't heat up. This will provide you with the brightest possible light source for testing. If you prefer, you can allow the flashlight to come to thermal equilibrium before doing testing, but this will take additional time for each trial.
- Make sure the flashlight is turned off, so you don't hurt your eyes.
- Open the box and place the first test shape inside it, so that the leading edge of the shape (the edge closest to the flashlight) is at the spot you found to be a good location for testing inside the box. Be sure the shape is aligned with the flashlight.
- If the test shape is the W-shape or the V-shape, there is variability in how narrow or how wide the shape can be. For instance, with the V-shape, the paper can be opened wide to form a wide V, or nearly closed to form a narrow V. You will need to keep careful track of the shape's width with a ruler or protractor, so that you can make the width the same on repeat trials. Record all measurements in your lab notebook.
- If the test shape is the V-shape, the leading edge is the fold, as shown in Figure 9.
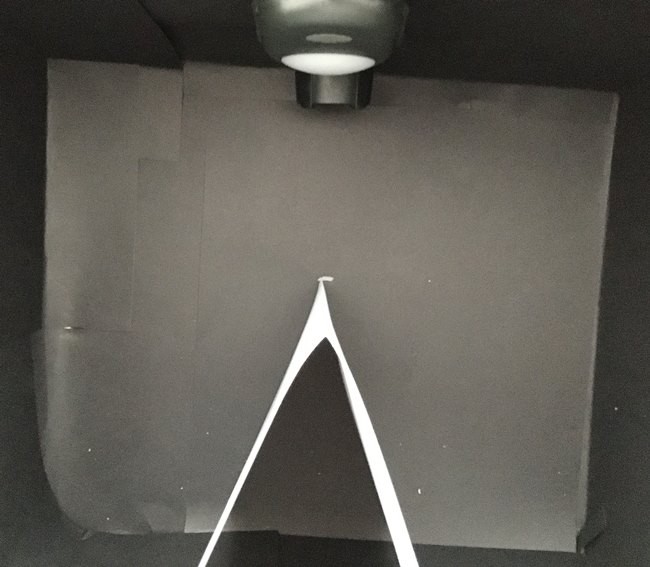
Figure 9. Top view of the test box with the V-shape placed on its test location.
- If the test shape is the W-shape, you have two test options. Both are shown in Figure 10. The leading edge can be the orientation with two folds pointing toward the light source, or just one, whichever you want to test. Or you may choose to test both orientations. Write down which orientation you chose in your lab notebook.
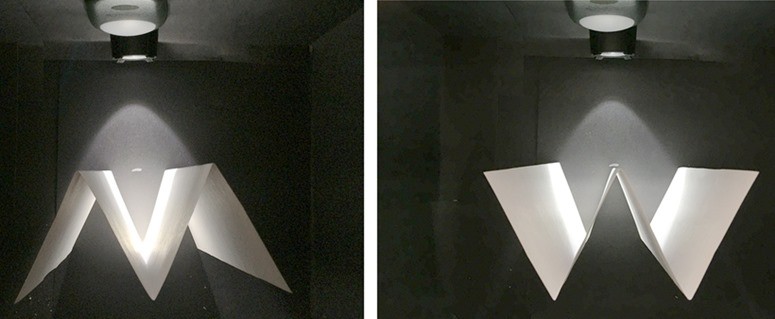
Two top views of the opened-up test box. In both cases, the W shape is centered in front of the flashlight. The central dip is facing away from the light in one configuration and towards the light in the other configuration. In both cases, the peaks of the W line up with the mark on the bottom of the box.
Figure 10. Two top views of an opened up test-box showing the two possible placements of the W-shape in the box.
- If the test shape is one of the cylinders, turn the seam away from the flashlight and the sensor as shown in Figure 7.
- Once the shape is in position, close the box and, if necessary, weigh the flaps down lightly to keep them closed.
- Turn on the lux meter.
- Turn on the flashlight.
- Immediately read the display and record your measurement in a data table, like the one below.
/-/https/www.sciencebuddies.org/cdn/Files/14241/6/v-shape-in-black-box.jpg)
/-/https/www.sciencebuddies.org/cdn/Files/14242/6/w-shape-in-black-box.jpg)
| Shape | Trial 1 | Trial 2 | Trial 3 | Average (lx) |
|---|---|---|---|---|
| Cylinder | ||||
| Crumpled cylinder | ||||
| W-shape | ||||
| V-shape |
- Turn off the flashlight.
- Repeat steps 1–7 for the three other shapes.
- Repeat steps 1–8 two more times, so you have a total of three trials. Make sure to go through trial one for all shapes before moving on to trial two. This reduces systematic errors that can easily creep into the data.
Analyzing Your Data Table
- For each shape, calculate the average illuminance from the three trials, and record your calculations in your data table.
- Make a bar chart, plotting the test shapes on the x-axis and the average illuminance on the y-axis. You can make the bar chart by hand or use a website like Create a Graph to make the graph on the computer and print it.
- Looking at your data, which shape was the least stealthy (produced the greatest average illuminance)? Which shape was the stealthiest (produced the least average illuminance)? Is the crumpled cylinder stealthier than the smooth cylinder?
- Based on your background research, can you explain your observation? How did the W-shape compare to the V-shape? Why do you think it behaved as it did?
- How do your findings translate to the real world? How do these shapes compare to the profiles of conventional and stealthy aircrafts?
- What questions are left unanswered? How would you change your experiment if you had to do it again?
Ask an Expert
Global Goals
The United Nations Sustainable Development Goals (UNSDGs) are a blueprint to achieve a better and more sustainable future for all.
/-/https/www.sciencebuddies.org/cdn/Files/19752/5/E-WEB-Goal-09.png)
Variations
- For the V-shape, try a range of narrow, medium, and wide V-shapes to see how that impacts scatter and stealth. Use a protractor to measure the angle of the "V," plotting the angle of the "V" on the x-axis and illuminance on the y-axis.
- Choose one test shape and try making that same shape out of different types of materials. For example, smooth white paper, crumpled white paper, black shiny paper, black matte paper, smooth aluminum foil, crinkled aluminum foil. Be sure all your test shapes are the same size and shape. Only the material should vary.
- Choose one test shape and make that shape out of different colors of paper.
- Test different model airplanes of the same scale size.
- Test different orientations of the same shape. For example, reverse a shape, or place it on its side, or at an angle. The entry in the Bibliography by M.A. Alves, et al., will give you insight into what parts of a shape are the most "stealthy."
- Change the orientation of the light source (have the light come from the top, middle or bottom of the box), but keep the shape fixed. The entry in the Bibliography by M.A. Alves, et al., describes a similar test with radar cross section in which the shapes rather than source are rotated. It will give you some clues about which parts of a shape are the most "stealthy."
- Choose one shape and place its leading edge at different distances from the light source. Plot how the illuminance falls off with increasing distance from the light source.
Careers
If you like this project, you might enjoy exploring these related careers:
/-/https/careerdiscovery.sciencebuddies.org/cdn/Files/835/18/msfc-202000343.jpg)
/-/https/careerdiscovery.sciencebuddies.org/cdn/Files/1640/26/Fyysikot_tyossaan.jpg)
/-/https/careerdiscovery.sciencebuddies.org/cdn/Files/842/17/unsplash-Bt9HIKC0Nus.jpg)
/-/https/careerdiscovery.sciencebuddies.org/cdn/Files/1450/21/iStock-1227179796.jpg)

/-/https/img.youtube.com/vi/Obyqku2vWc4/0.jpg)
/-/https/img.youtube.com/vi/-vTBn11SE9c/0.jpg)
/-/https/img.youtube.com/vi/ff8EjjW1_2o/0.jpg)