Abstract
On a rainy day, do you ever wonder what the weather is like on the other side of the planet? Different regions around the globe can have very different seasonal weather patterns. In this experiment, you can test if these seasonal variations are related to which hemisphere each region is located in.Summary
Sara Agee, Ph.D., Science Buddies
/-/https/www.sciencebuddies.org/cdn/Files/2654/5/Weather_img026.gif)
Objective
In this experiment you will investigate seasonal weather patterns and climates of different hemispheres by comparing historical weather data for major cities around the globe.
Introduction
What are the seasons of the year where you live? Is it warm and sunny or cold and snowy in January? You might think that it is cold and snowy for everyone, but different parts of the world have different seasons.
The earth is divided up into regions called hemispheres. There are two hemispheres that are divided by the equator: the Northern Hemisphere and the Southern Hemisphere. There are two hemispheres that are divided by the Atlantic and Pacific Oceans: the Western Hemisphere and the Eastern Hemisphere. The country that you live in belongs to two hemispheres. For example, the United States is in the Northern Hemisphere and the Western Hemisphere.
/-/https/www.sciencebuddies.org/cdn/Files/2654/5/Weather_img026.gif)
In this experiment you will investigate the difference between seasons in each hemisphere of the Earth. You will use an online weather database which contains historical weather data for locations around the globe. By tracking changes in temperature from month-to-month and year-to-year, you can test for seasonal weather patterns. Then you will compare the data collected from different hemispheres. Which hemispheres will be the most similar and which will be the most different?
Terms and Concepts
To do this type of experiment you should know what the following terms mean. Have an adult help you search the internet, or take you to your local library to find out more!
- Season
- Weather
- Temperature
- Climate
- Degrees Fahrenheit (°F)
- Degrees Celsius (°C)
- weather station
Bibliography
- You will need to use a World Atlas to look up major cities around the world. Try using this online atlas at WorldAtlas.com:
WorldAtlas.com, 2006. WorldAtlas.com, Graphic Maps, Woolwine-Moen Group. Retrieved October 2, 2006. - In this experiment we will use a free online database to search for historical weather data. You can find almost any type of weather information at this site, including radar and satellite images, astronomical data and star charts, storm warnings, forecasts, and more! Check it out:
Staff. 2005. Weather Underground. The Weather Underground, Inc. Ann Arbor, MI. Retrieved October 2, 2006. - When you hear a storm advisory on your TV or radio, it comes from the National Weather Service. The National Weather Service provides weather data and storm advisories for floods, hurricanes, tornadoes, blizzards, and thunderstorms across the nation. See a real satellite image of weather over the United States or check out their weather page just for kids:
- Staff. 2005. National Weather Service. (NOAA) National Oceanic and Atmospheric Administration. Washington, D.C. Retrieved December 13, 2005.
- Staff. n.d. Owlie Skywarn. (NOAA) National Oceanic and Atmospheric Administration. Washington, D.C. Retrieved April 12, 2018.
- Scholastic Books has a great web site for kids with fun games and tutorials all about weather. Read an interview with a real meteorologist, learn about climates, make your own weather tools, or try your hand at forecasting the weather:
Staff. 2005. Weather Watch. Scholastic Inc. New York, NY. Retrieved December 13, 2005. - These three great books by Gail Gibbons are perfect for an elementary school student learning about weather. Check them out from your library:
- Gibbons, Gail. 1990. Weather Words and What They Mean. New York, NY, Holiday House.
- Gibbons, Gail. 1987. Weather Forecasting. New York, NY: Atheneum.
- Gibbons, Gail. 1995. The Reasons for Seasons. New York, NY: Holiday House.
Materials and Equipment
- Computer with internet connection
- A globe (optional)
- Pencil and paper for recording data
Experimental Procedure
- The first step of this project is to find at least 2 major cities from each hemisphere quadrant. Use a globe or the online World Atlas to search for cities. Remember to use your own city as one of the locations for your study! For each city you find, write down the name of the city and the country it is in. You can make a data table like the one below, and write two major cities in each quadrant:
Swipe left to see moreWestern Hemisphere Eastern Hemisphere Northern Hemisphere (city 1, country 1)
(city 2, country 2)
(city 1, country 1)
(city 2, country 2)
Southern Hemisphere (city 1, country 1)
(city 2, country 2)
(city 1, country 1)
(city 2, country 2)
- Now you are ready to look up weather information for each city. You will be using the internet to look up historical temperature data, so grab a pencil and paper to write down your data. For each city, you will be recording monthly temperature data from the last 3 years. Make a data table like this in your notebook to write down your data for each city:
Swipe left to see moreAverage Monthly Temperatures for:
(city) ________________________________________
(country) _____________________________________
(circle the hemispheres) NW NE SW SE
2005 2004 2003 Average January February March April May June July August September October November December
- Now, get on your computer, connect to the internet, and open up your web browser.
- Type the URL, or web address, for "The Weather Underground" web site into the navigation bar: https://www.wunderground.com
- At the top, left-hand corner of the page there will be a box where you can type in your city and state to find your local weather. Type in your city and state, or your zip code, and then hit "Enter" or click on "Go."
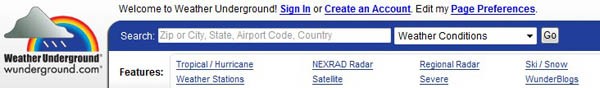
Screenshot of the Weather Underground website header with search option to search weather conditions by location (City or Zip, State, Airport Code, or Country). The header includes featured links to more information about weather related topics such as hurricanes, weather stations, radar, satellites, severe alerts, snow and blogs.
- About halfway down the page, you will see a box that says, "History and Almanac." In this box you will see the "Detailed History & Climate" option with today's date. Click on the "View" button.
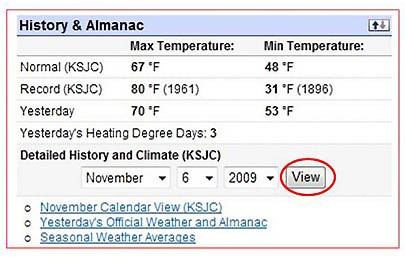
The website wunderground.com has a history and almanac section that displays the current date and temperature information. Historical temperature data is also available by searching for other dates using a drop-down menu.
- A detailed history for your local weather station will appear on your screen, followed by a daily summary table. Just above the "Daily Summary" will be a series of output options: Daily, Weekly, Monthly, etc. Click on Monthly.
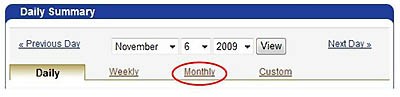
The daily temperature summary has other tabs that allow people to view temperature information on a daily, weekly, monthly and/or custom basis.
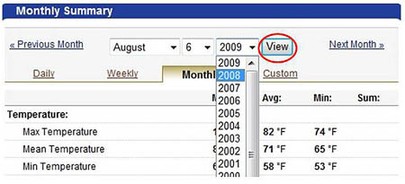
- Now, using the drop down menu, choose the month and year you want to collect data for, then click "View."
- When the new window appears, you will see "Summary," a table full of data for weather during that month in your city. Look for the box that tells you the "Average Mean Temperature." Use this example to help you find it:
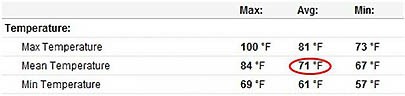
In this screenshot of a daily summary the hottest recorded temperature reached 100 degrees farenheit, the lowest recorded temperature was 57 degrees farenheit and the average temperature was 71 degrees farenheit.
- Write down the data on your data sheet, and continue to collect data for each of the other months and years on your data sheet. You can do this by changing the month or year in the drop down menu above your "Summary" table and clicking on "View." You do not need to change the day of the month.
The monthly temperature summary displays maximum, minimum and average temperatures for a selected date.
- When you are done collecting data for your city from the last 3 years, you will need to average the data from each month. Calculate the average by adding together the three data points from each year, and then dividing the answer by three. Write this number in the data table. Repeat this calculation for each month in your data table.
- After you collect data from each month and year, you are ready to collect the data for the other cities in your study. Just repeat steps 5 - 11 for each city on your list.
- Last, you will need to make graphs and compare your results for each hemisphere. Make a line graph of Average Monthly Temperature vs. Month by making a separate line for each major city. On the left side of the graph (y-axis) make a scale of temperature and on the bottom side of the graph (x-axis) make a series of months. For each city, plot the point of intersection of each month with the matching average temperature and connect the dots. Give each city its own color, and make a color key for your graph to make it easy to interpret.
- Which cities seasonal weather cycles matched on the graph? Are they in the same or different hemisphere? Which hemispheres match up and which ones don't?
/-/https/www.sciencebuddies.org/cdn/Files/2655/5/Astro_img107.jpg)
/-/https/www.sciencebuddies.org/cdn/Files/2656/5/Astro_img109.jpg)
/-/https/www.sciencebuddies.org/cdn/Files/2657/5/Astro_img110.jpg)
/-/https/www.sciencebuddies.org/cdn/Files/2658/5/Astro_img111.jpg)
/-/https/www.sciencebuddies.org/cdn/Files/2659/5/Weather_img047.jpg)
Ask an Expert
Global Goals
The United Nations Sustainable Development Goals (UNSDGs) are a blueprint to achieve a better and more sustainable future for all.
/-/https/www.sciencebuddies.org/cdn/Files/19756/5/E-WEB-Goal-13.png)
Variations
- Try using your data to identify the four seasons. Do the different seasons show different temperature variations in your local area? Which seasons are more stable, and which seasons fluctuate? What historical trends do you see? Are the cycles of the seasons more similar to weather or to climate?
- This experiment relies on the accuracy of your local weather station, and the reliability of data posted on the internet. How do you think that temperature data you collect on your own would compare to your local weather station? Try collecting data for one month using a thermometer posted in your back yard, and compare it to daily weather data you collect from the internet.
- Did this year seem unusually rainy, snowy, or dry? Sometimes, weather can be unusual compared to the average or normal weather history and can set a historical record. Use the internet to research unusual weather history in your area. What year was there a drought, record rainfall with flooding, or a severe blizzard?
Careers
If you like this project, you might enjoy exploring these related careers:
/-/https/careerdiscovery.sciencebuddies.org/cdn/Files/1346/17/iStock-579770584.jpg)
/-/https/careerdiscovery.sciencebuddies.org/cdn/Files/815/17/unsplash-5hZJVGPG6vo.jpg)

/-/https/img.youtube.com/vi/OEkw3F7RZ3w/0.jpg)
/-/https/img.youtube.com/vi/TFGeefF82o8/0.jpg)
/-/https/img.youtube.com/vi/tXWv9JbmnKs/0.jpg)