Abstract
Have you ever wondered why geese fly in a V-formation? In this science fair project, you will build a wind tunnel to test how the formation of birds in flight actually affects their flight efficiency.Summary
Timmy A. Beckmann, Science Buddies Clever Scientist Award winner
This science fair project is based on the 2009 California State Science Fair (CSSF) project, "The Effect of Bird Formation on Flight Efficiency," by Timmy A. Beckman. Timmy received a Science Buddies Clever Scientist Award for this project. The pictures of the project were taken by Science Buddies scientist Sandra Slutz at the CSSF.
Adapted for Science Buddies by David B. Whyte, PhD, Science Buddies
- LEGO is a registered trademark of the LEGO Group.
/-/https/www.sciencebuddies.org/cdn/Files/3911/5/Zoo_img047.jpg)
Objective
The objective of this science fair project is to compare the amount of drag on model birds in V-formation to model birds in solo flight.Introduction
You have probably observed birds flying in formation. The V-formations of geese can be observed across North America, especially during their migratory seasons. Biologists who have studied bird flight have developed two hypotheses about the possible advantages of these formations. The first hypothesis is that flying in formation provides an energetic advantage. In other words, flying in formation requires less energy than does solo flight. The other hypothesis holds that flying in formation allows each bird to observe the position and flight direction of the other birds in the flock. This visual communication among members of the flock reduces the possibility of collisions and of birds becoming separated from the flock. It also might allow the birds to take advantage of the collective memory of all the members of the flock when they are migrating long distances. The actual formation in which the birds fly could be due to a combination of energetic and visual considerations, or to other factors entirely.
Interestingly, research has shown that the leading bird does not simply block the wind for the following birds. The wings of the bird create wing-tip vortices, which are regions where the air behind the bird's wing moves in a twisting motion. Figure 1, below, shows the vortex created by the wing of an airplane. Note that there is a region where the wind in the vortex is moving upward. This upward-moving wind can create a wind upwash, which provides a lift to the following bird. The paper by Cutts and Speakman in the Bibliography provides more details of this phenomenon.
/-/https/www.sciencebuddies.org/cdn/Files/3908/5/Zoo_img044.jpg)
Figure 1. This image of the vortex trailing from the right wingtip of an airplane clearly shows the region of upwash to the right of the middle of the vortex. (Wikipedia, 2009.)
In this science fair project, you will build a model system to test the energetic advantage hypothesis. For the experiments, you will construct a wind tunnel using a large fan and side walls. A pair of geese will be built out of LEGO® blocks at 1/5 scale. The birds will be positioned at several different offsets, relative to each other. You will measure the force on the rear bird with a scale and simple lever mechanism. You will then compare the force on the rear bird for the various positions of the lead bird.
Terms and Concepts
- Energetic advantage hypothesis
- Visual communication hypothesis
- Wing-tip vortex (vortices, plural)
- Upwash
- Wind tunnel
- Scale factor
- Control
- Drag
Questions
- Which bird species fly in V-formation?
- Based on your research, what is the role of upwash in reducing the energy needed for birds to fly in formation?
- What is the energetic advantage hypothesis?
- What is the visual communication hypothesis?
Bibliography
- Scott, J. (2005). Aerospace Web. Why do birds fly in a V-formation?. Retrieved June 1, 2009.
- Batt, B. (2007). Why do migratory birds fly in a V-formation? Scientific American. Retrieved June 1, 2009.
- Cutts, C.J. and Speakman, J.R. (1994). Energy savings in formation flight of pink-footed geese. Journal of Experimental Biology. Vol. 189, Issue 1, 251–261. Retrieved June 1, 2009.
- Badgerow, J.P. (1988). An Analysis of Function in the Formation Flight of Canada Geese. The Auk. Vol 105, 749–755. Retrieved June 1, 2009.
- Wikipedia Contributors. (2009, March 14). Downwash. Wikipedia: The Free Encyclopedia. Retrieved June 11, 2009.
Materials and Equipment
- LEGO set, basic bricks set; available from Amazon.com
- LEGO set, 628 X-large grey base plate; available from Amazon.com
- Lab notebook
- Foam Poster boards, 18" by 24" (2)
- Masking tape
- Large fan
- Electronic scale, accurate to at least 1 gram (g), should be able to be zeroed, such as the digital pocket scale from Amazon.com
- Computer camera (webcam) capable of capturing video
- Computer that can record and replay video captured by the webcam
- Tape
- Tape measure, cloth, metric
- Stopwatch or timer
- Protractor
Disclaimer: Science Buddies participates in affiliate programs with Home Science Tools®, Amazon.com, Carolina Biological, and Jameco Electronics. Proceeds from the affiliate programs help support Science Buddies, a 501(c)(3) public charity, and keep our resources free for everyone. Our top priority is student learning. If you have any comments (positive or negative) related to purchases you've made for science projects from recommendations on our site, please let us know. Write to us at [email protected].
Experimental Procedure
Creating the Bird Models
-
To begin, make two model birds of equal size. To make the models, you will need to know the dimensions of the real bird, and the scale factor. The following measurements are for the pink-footed geese, since there is published data on their flight formations (see the Bibliography).
- Mean wing span: 108 cm
- Mean bill-to-tail length: 66 cm
- Mean wing width: 23 cm
-
Make two 1:5 scaled models of the birds.
- Divide each of the dimensions above by 5, and use the resulting numbers to design your model.
- The final models do not have to look just like the one in Figure 2, but should look like geese and be a 1:5 scaled model.
-
Attach one model to a short stand, as shown in Figure 2.
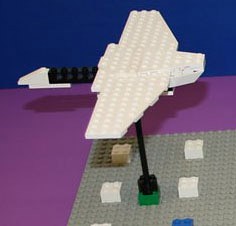
Figure 2. Model of pink-footed goose. This model will be moved to different points on the large gray base plate.
-
Attach the other model to a lever system, as shown in Figure 3.
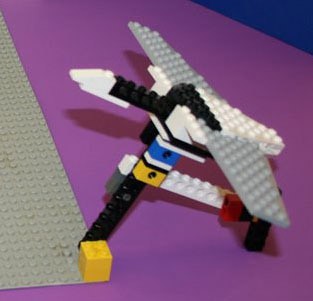
Figure 3. Model of goose, attached to a simple lever system. The amount of drag on the bird, caused by air from the fan, is measured by placing the back portion of the lever on an electronic scale. This model will stay in place during the procedure, as the other model is moved to various points on the base plate.
- During the procedure, the models should be at the same height and at the same angle, relative to the wind.
/-/https/www.sciencebuddies.org/cdn/Files/3909/5/Zoo_img045.jpg)
/-/https/www.sciencebuddies.org/cdn/Files/3910/5/Zoo_img046.jpg)
Setting Up the Testing Area
-
Attach blocks to the base plate in a grid pattern, as follows:
- See Figure 4 for an example of how to set up a grid pattern.
- Number the positions 1–28.
- Make a diagram in your lab notebook showing the position and number of the blocks.
- Make a data table to record the readings for each position.
- Because the readings fluctuate, you will record 20 readings for each data point and average them. The table should have room for 20 readings per position.
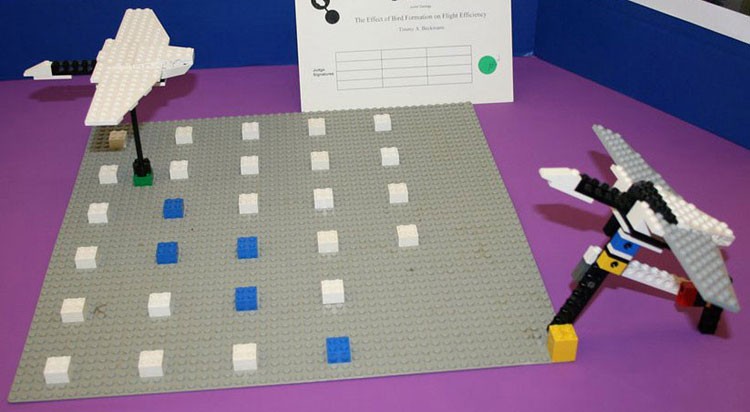
Figure 4. The base plate has blocks for attaching the moveable lead bird in various positions within a grid pattern. The bird on the right, which is attached to a lever system, is fixed at a single position. The bird on the left will be moved to various positions on the grid.
-
See the complete setup in Figure 5, below. Place the fan on a sturdy surface.
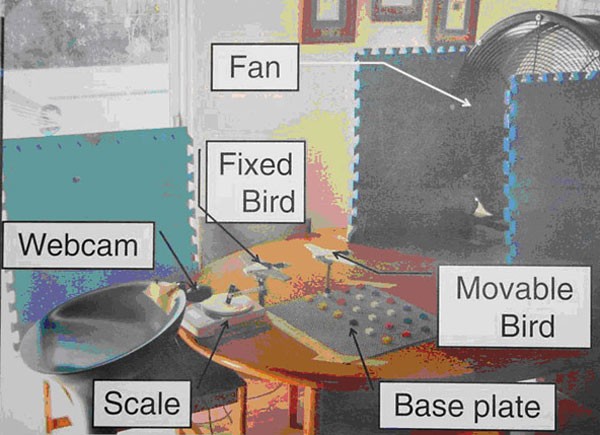
Figure 5. The experimental setup for the bird flying-formation science fair project.
-
Place two of the foam poster boards on either side of the fan.
- You can use other kinds of flat rectangular surfaces. The goal is to channel the wind from the fan into the region of the bird models.
- Use masking tape to hold the foam poster boards in place.
- Place the base plate 60 cm in front of the fan.
- Tape the base plate to the table with masking tape.
- Attach the bird with the lever to its fixed position on the base plate. The fixed bird should be downstream of the middle of the fan.
- Place the electronic scale behind the fixed bird with the lever on the base plate.
- Set up the webcam. The readings on the scale will be recorded with a computer camera, so you can average the readings over a 60-second (s) span of time. Attach the computer camera to a solid support so that it is able to record the readings on the scale. Use a solid support that will allow the wind to flow around it.
- Hook up the camera to a computer that can record and replay the webcam output.
/-/https/www.sciencebuddies.org/cdn/Files/3911/5/Zoo_img047.jpg)
/-/https/www.sciencebuddies.org/cdn/Files/3912/5/Zoo_img048.jpg)
Performing the Experiment
- You are now ready to start taking readings. The first readings will be taken without the moveable lead bird. This will be the control reading.
- Remove the movable lead bird from the base plate.
- Carefully place the lever from the fixed bird on the scale. The fixed bird should be horizontal.
- Zero the scale.
-
Start recording the scale readings with the computer camera.
- Record for about 10 seconds with the fan off.
- The value on the scale should be zero. If not, re-zero the scale.
- Turn the fan on.
- Record the readings on the electronic scale every 3 s for 60 s.
- Turn off the video recording.
-
Replay the video recording.
- Average the 20 values and record it in your lab notebook. This is the control value.
- Place the movable lead bird in position # 1. You can use any position you choose as position #1.
-
Repeat steps 3–9. Obtain the following data for each position:
- The value on the scale with the fan off (should be zero).
- 20 readings from 60 s (one reading every 3 s) of recording with the fan on.
- The average of the 20 readings.
- Repeat steps 3–9 for each of the other positions, 2–28.
Analyzing Your Results
- Make a table showing the average scale readings for the control (no lead bird) and each of the 28 bird positions.
-
Make a new column showing the difference between the control reading and each of the readings for positions 1–28.
- Subtract the readings with a lead bird from the control (no lead bird). For example, "control minus average position 1," etc.
- Divide the values from the step above by the control value and place these numbers in a new column.
- To convert the results to a percentage, multiply the values from the step above by 100 and put these values in a new column. This final number is a measure of the percent decrease in force on the rear bird due the presence of the lead bird.
- Make a figure that shows the grid pattern on the base plate. Put a square at the position of the bird with the lever, and each position for the lead bird. Write the percent decrease in force above each square for the lead bird. Be sure to add an arrow showing the direction of the wind.
- Discuss your findings in terms of the wind drag and visual communication.
- Use a protractor to measure the angle between the two birds that is the best for reduced drag and good visual communication.
-
Presentation suggestions:
- Add figures showing other examples of V-formations (car racing, bicycling, other bird species, etc.).
- Add a figure showing two birds flying in the position that resulted in the greatest reduction in drag.
Ask an Expert
Global Goals
The United Nations Sustainable Development Goals (UNSDGs) are a blueprint to achieve a better and more sustainable future for all.
/-/https/www.sciencebuddies.org/cdn/Files/19758/6/E-WEB-Goal-15.png)
Variations
- Graph the raw data for the scale readings. Graph time on the x-axis and the scale reading on the y-axis. Add a line showing the average value. Can you think of a way to reduce the variability of the readings?
- Based on your research, compare your results with published values for how drag is affected by the relative position of the birds (see the papers in the Bibliography).
- Make a 3-dimensional graph that shows the position of each bird on the x-y plane and the percent force decrease for each position on the z-axis.
- Try using three model birds instead of two for analysis.
Careers
If you like this project, you might enjoy exploring these related careers:
/-/https/careerdiscovery.sciencebuddies.org/cdn/Files/835/18/msfc-202000343.jpg)
/-/https/careerdiscovery.sciencebuddies.org/cdn/Files/1900/17/iStock-1191167137.jpg)

/-/https/img.youtube.com/vi/wLIxwnjRnqA/0.jpg)
/-/https/img.youtube.com/vi/0ZdGgbMZCeM/0.jpg)
/-/https/img.youtube.com/vi/Obyqku2vWc4/0.jpg)