How to Build and Use a Subsonic Wind Tunnel
Guide
Introduction
This how-to guide provides detailed instructions for construction and use of a subsonic wind tunnel. The wind tunnel is best used for science fair projects in grades 9–12.
/-/https/www.sciencebuddies.org/cdn/Files/498/9/wind-tunnel_A.jpg)
Figure A. This is an example of the wind tunnel you can make, based on the design and instructions provided in this how-to guide!
Did you know that every single plane, helicopter, and spaceship used in America today has been tested in a wind tunnel? A wind tunnel is a chamber through which high-speed air is passed. Models of aircraft (or actual aircraft) can be mounted in a wind tunnel so that flight conditions can be simulated and engineers can study how well a design will fly. Wind tunnels have been used for over 100 years. In fact, the Wright brothers used one to help them figure out how to build the world's first successful aircraft, the Wright Flyer.
/-/https/www.sciencebuddies.org/cdn/Files/500/9/wind-tunnel_C.jpg)
Figure B. The Wright Flyer. (Wikipedia, 2009.
Today, wind tunnels are used by NASA, Boeing, Northrop Grumman, and every other organization that makes aircraft and spacecraft. In fact, NASA AMES, in Moffet Field, California, has the most wind tunnels at any one location in the world, and also has the largest wind tunnel on Earth! Wind tunnels are also used for educational purposes. For instance, schools use them to demonstrate how planes fly. They are also used in research projects, as students design aircraft models and test their performance.
/-/https/www.sciencebuddies.org/cdn/Files/501/9/wind-tunnel_D.jpg)
Figure C. NASA AMES. The prominent structure in the foreground is the world's largest wind tunnel. (Pincta-cal, 2008.)
Science Buddies is proud to offer this how-to guide, which provides the design for an educational wind tunnel that you can build yourself. Though it's certainly not big enough or sophisticated enough to study a space shuttle or the new Boeing 787 Dreamliner, it is excellent for classroom use and for science fair projects. The design has been rigorously tested, and while you will learn the precise method for building a working wind tunnel, we thought it also important to share the obstacles we encountered along the way, so you can avoid the same pitfalls. In addition, once you've completed the wind tunnel, Science Buddies has several aerodynamics-related Project Ideas, which require the use of a wind tunnel, so be sure to look those up and try them out when you're ready for testing! Here are a couple of examples: Which Wing Design Creates the Greatest Lift? and Winglets in Wind Tunnels
/-/https/www.sciencebuddies.org/cdn/Files/502/9/wind-tunnel_E.jpg)
Figure D. This is an example of an educational wind tunnel used on a college campus, which is over 60 feet long and 10 feet high. (UC Davis Wind Tunnel Facility, 2009.)
Before you get started, there are a few basics to learn about wind tunnels. First, there are two main types of wind tunnels: closed-circuit and open-circuit. A closed-circuit wind tunnel is a very large and expensive type of wind tunnel. It gives engineers and scientists the greatest control over the flow of air, and produces the most efficient and precise results when models are tested. The wind tunnel you will build is not a closed-circuit wind tunnel because this would be very expensive and difficult to make without sophisticated equipment and materials. Instead, you will be making an open-circuit tunnel, which is more like a tube that is open at both ends (see Figure D). While this design doesn't allow you to have complete control of the airflow, it is less expensive to build and run, it can be made using readily available materials, and it is an effective design for educational purposes.
Second, you need to understand just how an open-circuit wind tunnel works and wht it measures. The wind tunnel in this project has a fan, which will draw air into the tunnel and pass it over a model, and then release the air out of the other end. When the air flows around the model, it simulates flight. The model pulls on sensors, which will tell you how well it pulls up (lift) and how much the air blows it backward (drag). These two measurements are what you are most interested in as an aeronautical engineer—you want to know how well your plane lifts itself (stays in the air) and how well it cuts through the air and resists the force of the air pushing back against the plane (how fast it travels). Lift measurement gives you the force of upward motion of the air on the model, and drag gives you the force of backward motion of the air on the model. Basically, a plane is only able to fly because it can control the way that the air pushes on it. This is why a wind tunnel is important—you want to study how air moves around your model before you actually build the plane and send it into the sky.
Third, it is important to know that the wind tunnel fan is similar to the engines on a plane. The engines push the plane forward, which makes wind pass over the wings. The fan draws air backward, so that it passes over the wings in the same way as if the model were propelling itself forward. The proper way to describe this is that the fan simulates thrust.
Fourth, wind tunnels are not perfect simulations of environmental conditions. The degree to which they are flawed representations of actual flight is measured by a calculation called Reynolds Number. The wind tunnel which you can build using this how-to guide is a student-quality, high school budget tunnel, and so it is important for you to understand that the data and results it yields are for instructional and educational purposes only. It is possible that the data will disagree with established data-in order to find out just how inaccurate the tunnel may be, you should research the concept of Reynolds Number and determine what the RN is for your wind tunnel.
Finally, you should know the five basic parts of the wind tunnel. From front to back, they are: The Settling Chamber, the Contraction Cone, the Test Section, the Diffuser, and the Drive Section. (see Figure E).
/-/https/www.sciencebuddies.org/cdn/Files/503/9/wind-tunnel_F.jpg)
Figure E. Diagram of an open-circuit wind tunnel. Although the diagram has many different numbered items, you only need to be familiar with the few mentioned here.
The Settling Chamber (number 12 in Figure E) is at the very front of the wind tunnel, and is made up of screens and honeycomb-shaped mesh, which straighten out the air and reduce turbulence. The Contraction Cone (numbers 11 and 13 in Figure E) forces a large volume of air through a small opening in order to increase the wind velocity in the tunnel (for more on this, study the continuity equation). The Test Section (number 10) is the place where a model is mounted on sensors. The Diffuser (number 8 in Figure E) is at the end of the Test Section, and keeps the air running smoothly as it goes toward the back. It also increases in volume in order to slow the air down as it exits the tunnel. Finally, the Drive Section (number 7 in Figure E) is at the very back of the wind tunnel, and it is where the fan is housed. At first, it might seem odd that the fan is at the back of the tunnel, facing outward, instead of at the front; but this is actually the best placement, because it will draw air into the wind tunnel by blowing air out of it. Drawing air in is better than blowing air in, because it doesn't produce as much turbulence, and it allows for greater control of the airflow through the tunnel.
This introduction provides only a glimpse into the field of aerodynamic design, so before you begin building the wind tunnel, you may want to do additional research about basic aerodynamic principles. At the end of this guide is a bibliography of the sources consulted when this design was made, so make sure you check out at least a few of them before you get started. We highly recommend taking a look at The Illustrated Guide to Aerodynamics, 2nd Edition by H.C. "Skip" Smith; NASA's Beginner's Guide to Wind Tunnels website; and the Wind Tunnel Design website. If you can find a copy, also check out Low Speed Wind Tunnel Testing, 3rd Edition by Barlow, Pope, and Rae. This book might be difficult to find unless you use a local university library. Since you are building an open-circuit wind tunnel, you don't need to study anything that these resources say about closed-circuit wind tunnels.
Important Notes Before You Begin
- This design is for an open-circuit, closed-test-section wind tunnel that is about 8 ft. long, and can be taken apart for storage and transportation, such as for display in a science fair.
- If you run into any problems or need any extra help beyond the instructions of this guide, visit our SciBud Wind Tunnel Questions, set up just for this Wind Tunnel How-to Guide.
- This wind tunnel has three basic parts:
- Key terms that you should research before you begin:
- Angle of attack
- Assemblies (engineering context)
- Closed-circuit wind tunnel
- Contraction cone
- Diffuser
- Drag
- Drive section
- Lift
- Open-circuit wind tunnel
- Parts (engineering context)
- Test Section
- Thrust
- Settling chamber
- Variable speed drive section
- Voltmeter
Materials
Cost
A key element to consider when building this wind tunnel is the cost. The Science Buddies wind tunnel design cost about $275. This price estimate is the result of shopping around for the least-expensive products available that would still work properly in the wind tunnel. Another cost-cutting idea is using scrap wood, so make sure you collect all of the unused wood you can before you start buying parts for the wind tunnel. The two most-expensive components are the Drive Section fan and the Plexiglas sheet(s) used to build the Test Section.
Materials and Equipment
- Material cost is around $250–$300, but you could ask your school to help pay for it.
- If available, you can use force sensors and equipment found in your physics classroom.
The next thing to think about is the list of materials. Nearly everything you'll need to buy will come from a local hardware store. The materials for the Science Buddies wind tunnel (see Figure A) were almost exclusively bought from Lowe's Home Improvement, The Home Depot, and a locally based hardware store, but they are readily available and can be found at a variety of locations.
First, review the following materials list and see if you have any of the listed parts already (such as scrap wood, screws, etc.). Make sure that you use whatever good materials you and the school already have so that you don't have to spend more money than you need to spend. For instance, you will need to use two force sensors, which your school's physics department most likely already has. Most high school force sensors cost about $100 each, so it is best to use whatever your school already has. If your school doesn't have any sensors, you will have to buy them.
Here is a basic list of the materials needed, with cost approximations:
Primary Materials
| Material | Quantity | Estimated Cost of Total Quantity | Notes |
| Plexiglass sheet, 2' x 4' | 1 | Low ($20-$50) | |
| Plywood board, 4' x 8' | 1 | Low ($20-$50) | For best results, thickness should be greater than 1/4". |
| Plywood board, 17" x 17" | 1 | Low ($20-$50) | This will most likely have to be cut from a larger board; although unusual, the dimensions are based on calculations and must be used; for best results, thickness should be as great as possible. |
| Fan with blade diameter of 14 in. and entire-fan diameter no greater than 17 in. | 1 | Average ($50-$100) | For best results, CFM rating should be between 1600 and 2000, and fan should be designed for gable mounting. |
| Oak boards, 2' x 4' | 4 | Low ($20-$50) | For best results, thickness should be greater than 1/4". |
| Egg crate mesh board | 2 | Low ($20-$50) | Basically an array of deep cells (see Figure A). |
| Wooden lattice, 1.5" x 1/4" x 8' | 1 | Very low (under $20) | |
| Wooden corner guard, 8' | 1 | Very low (under $20) | |
| Roll of aluminum screen | 1 | Very low (under $20) | About 36" x 48" |
| Small handheld personal cooling fan | 1 | Very low (under $20) | |
| Cut of wire sheet, enough to cover a 17" x 17" area | 1 | Very low (under $20) | This will block the exit of the fan so that children do not put their hands into the fan. Make sure that the wire cells are small enough to prevent fingers from getting through. |
| Adhesive rubber gasket stripping, at least 8 ft. | 1 | Very low (under $20) to low ($20-$50) | This will be used at the openings of the three assemblies to ensure that air does not escape. It should be an adhesive gasket stripping. |
| Springs | 8 | Low ($20-$50) | Medium-duty coil springs, 3 ft. or so, with closed loops at each end (you will be latching each end onto hooks). |
| Soldering materials | With permission, borrow from school or someone you know | ||
| Electrical wiring materials | With permission, borrow from school or someone you know | ||
| Small L-brackets with two screw holes | 8 | Very low (under $20) | |
| Small drawer handles | 4 | Low (under $20) | |
| Scrap wood | With permission, obtain from school, home, or someone you know. | This will depend on what you have, or what your school or someone you know has available. If you can't obtain any scrap wood, you can always buy extra pieces of wood. You will use the scrap wood to make stands and bases for your wind tunnel. |
Secondary Materials
| Material | Quantity | Estimated Cost | Notes |
| Saws | With permission, borrow from school, home, or someone you know. | The types of saws you use is up to the carpenter/woodshop teacher who will be helping you. | |
| Drill | 1 | With permission, borrow from school, home, or someone you know. | |
| Wood glue | 1 bottle | Very low (under $20) | |
| Screws, wood screws, nuts, bolts, washers, lock washers, screwdrivers, related materials | With permission, obtain from school, home, or someone you know. | Again, the number and type of these materials you need will be up to your carpenter/woodshop teacher. | |
| Nail/Staple gun | 1 | With permission, borrow from school, home, or someone you know. | |
| Silicone | 1 tube | Low (under $20) | Try to find a special type that is intended for use with clear plastics. |
| Construction sealant | 1 tube | Low (under $20) | |
| Measuring tape | 1 | With permission, borrow from school, home, or someone you know. | |
| Zip ties | At least 20 | Low (under $20) | |
| Safety goggles | 1 pair | With permission, borrow from school, home, or someone you know. | |
| Work gloves | 1 pair | With permission, borrow from school, home, or someone you know. | |
| Ear plugs | 1 pair | Very low (under $20) |
School-Donated Equipment
| Material | Quantity | Notes |
| Multi-force sensors | 2 | Borrow these from your school, if you can. If not, companies such as Vernier Scientific supply these. |
| Computer | 1 | Will connect to force sensors and store/display their collected data. |
| Voltmeter | 1 | |
| Variable AC transformer | 1 | Borrow from your school, if you can. If not, companies such as Variac supply these. |
A note about the large fan: You will most likely want a gable-mounted attic fan. These are powerful, easy to mount, and relatively inexpensive (although it is the single most-expensive part on the entire tunnel). It is best to get a fan with a CFM (cubic feet per minute) rating of between 1600 and 2000, because these are powerful enough to be reliable (sources in the bibliography suggest a fan with 34 cubic feet per second, which is about 2040 CFM). They cost about $100 or so. Make sure you find a fan you can afford that fits in that price range. Also, you may be able to get a discount for the fan, since it is to be used for educational purposes. The fan in the Science Buddies wind tunnel was purchased from a Lowe's hardware store with a 10% discount. Make sure to talk to a customer service associate about a possible discount.
Finally, you will be relying on the help of others, so make sure that you can find teachers, adults, or industry professionals who can help you with the following:
- Cutting wood with high-power saws (woodshop teacher or carpenter recommended);
- Simple building mechanics (woodshop teacher or carpenter recommended);
- Simple wiring (physics teacher or electrician recommended);
- Simple soldering (physics teacher or metal-shop teacher recommended).
Now that we've covered all of the basics, you are ready to build your wind tunnel! The instructions in the Test Section, Diffuser, Contraction Cone, and Assembling sections are meant to guide your progress as you build, but the steps do not necessarily need to be followed to-the-letter. If the people with whom you are working have different ideas from those presented here, such as how to fasten certain parts together, then implement whatever method you both think is best. Remember, building the wind tunnel is a learning experience—follow the directions, but don't be afraid to go beyond them or to try different ideas!
Test Section
This wind tunnel is designed with portability in mind. Although it is about 8 ft. long, it is composed of three different sections, which can easily be detached from each other for storage, transportation, and model mounting. The three assemblies are as follows: Test Section Assembly, Diffuser Assembly, and Contraction Cone Assembly. The following instructions will walk you, step-by-step, through the construction of each of the three sections. Since this is an engineering project, all materials will be referred to as parts, and all built portions (such as each of the three main sections) will be referred to as assemblies.
Building the Test Section Assembly
This assembly is the most delicate part of the tunnel, because it houses the model and includes the lift-and-drag sensory system. It will look like the following:
/-/https/www.sciencebuddies.org/cdn/Files/504/7/wind-tunnel_1A.jpg)
Figure 1A. The full Test Section Assembly.
The Test Section Assembly is composed of the Test Section (Plexiglas) and the Test Section Base (wooden stand and sensor mounts). Make sure you take a look at these two major features in Figure 1A before you move on.
For this assembly, you will need the following parts:
- Plexiglas sheet
- L-brackets
- Screws
- Washers/lock washers, bolts
- Drill
- Silicone
- Scrap wood
Before you begin this section, you need to know what type of sensors you will use to collect force data, and you will need to work with your carpenter/woodshop teacher to design the proper base, which will depend on what kind of scrap wood you have available, or how much more wood you need to buy. This how-to guide, for the Science Buddies wind tunnel, uses two Dual-Range Force Sensors, made by Vernier (see Figure 1A).
Part A: Plexiglas Test Section
- The first step of building this assembly is to cut the large Plexiglas board into four smaller boards. The Plexiglas portion of the Test Section will be 1' x 1' x 2', so you need to cut the 2' x 4' sheet into four 1' x 2' sheets. This can easily be done at your local hardware store where you purchased the Plexiglas—you might even want to have it cut the same day that you buy it, to save time. In the Plexiglas products section of the store, there should be a cutting station, which usually cuts Plexiglas for free. Bring your board to this station and make sure that the cutter understands that you need four boards, each with dimensions 1' x 2'.
- Next, you will connect the four boards together using silicone to make a rectangular prism (the Test Section part of the Test Section Assembly). You should use a special type of silicone that is best for clear plastics, available at your local hardware store. This step can be very tricky, so make sure that you work with a mechanically inclined adult who can help you put it together properly. Hold two of the boards lengthwise so that they are perpendicular and form a corner. Make sure that their touching edges are flush with each other. This is how you want the two boards to look once you have connected them using the silicone. Now, take them apart and with your helper's assistance, carefully run a line of silicone at the edge of a face on one of the boards, not on the edge of one of the boards. This way, you will be able to put the edge of the other board right onto the silicone.
- Now, here comes the tricky part—you have to place the edge of the second board onto the silicone on the first board. You should do this with the boards standing up, not lying down—in other words, set them both on one of their 1-ft. edges, then put them together and hold them as they stand that way. See Figure 1B.
/-/https/www.sciencebuddies.org/cdn/Files/613/7/wind-tunnel_1B.jpg)
Figure 1B. Stick the two boards together so that they stand on one of their 1-ft. edges.
- Gently hold the two boards together. You want them to stay in place, but you don't want to accidentally move them while the silicone is drying. Make absolutely sure that the two boards are flush with each other so that they form a nice, straight, perfect corner, as in Figure 1B.
- After holding the two together for about 5–10 minutes, you can let go of them and let them stand. Make sure that they do not fall down, because it takes several hours for the silicone to fully adhere the two boards together.
- You now have half of your Test Section. To finish the part, you should continue attaching one board at a time, rather than making another corner out of the other two boards and trying to attach the two corners. Attaching one board at a time gives you the greatest control—trying to attach two corners is too risky and the boards could slip, spreading the silicone on the Plexiglas.
- As you attach the boards edge-to-face, you will notice that you do not have an exact 1' x 1' opening in the Test Section. This is because some of the boards need to be flush with the others in order to attach them properly. This could present a problem because you will need to keep track of the way you attach the boards so that you can keep it consistent with the 1' x 1' openings in the other two assemblies. Your carpenter/woodshop teacher should know how to do this and can help you keep track. This is important, because the airflow needs smooth walls inside the wind tunnel in order to flow properly, so the three pieces need to match up when you put them together.
- As before, run lines of silicone and carefully attach the boards together. Wait for the silicone to start to dry; this is a bit tedious, but the Test Section is very important so make sure that you give enough time for the boards to stick together. With your helper, make the Test Section, and leave it standing on one of the two ends in a safe place for 12–24 hours (depending on how long the silicone needs to fully dry; check the label on its container). Once it has fully dried, you can set it on its long sides, as in Figure 1C. The silicone holds the boards together, but is very pliable and is not very strong, so do not flex the boards or pick at the silicone. See Figure 1C for a picture of what your Plexiglas Test Section should look like.
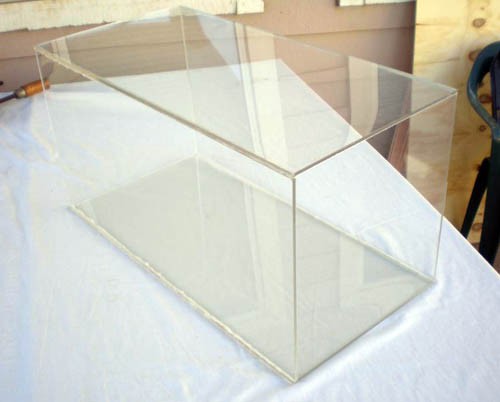
Figure 1C. The Plexiglas Test Section, held together only by silicone.
- Since the silicone is so weak, it is necessary to reinforce the Test Section. To do this, you will screw corner brackets into the Test Section, at its eight end corners, in order to keep it together and to give it greater structural integrity. Note that you will need a drill, eight corner brackets, screws, nuts, and small lock washers. Make sure you let the silicone dry before you reinforce with brackets, as described in step 7a.
- As before, run lines of silicone and carefully attach the boards together. Wait for the silicone to start to dry; this is a bit tedious, but the Test Section is very important so make sure that you give enough time for the boards to stick together. With your helper, make the Test Section, and leave it standing on one of the two ends in a safe place for 12–24 hours (depending on how long the silicone needs to fully dry; check the label on its container). Once it has fully dried, you can set it on its long sides, as in Figure 1C. The silicone holds the boards together, but is very pliable and is not very strong, so do not flex the boards or pick at the silicone. See Figure 1C for a picture of what your Plexiglas Test Section should look like.
- With your mechanically inclined helper's assistance, mark the points on each board of the Test Section where holes will be drilled. The holes should be rather close to the edges of the Test Section, should all have the same measured distances from the edges, and should all be in the proper places so that corner brackets can be screwed onto the Test Section. There will be 16 holes in all—four on each of the boards. Pilot (test) holes should be drilled first, for accuracy, followed by holes large enough that screws can fit in.
- Once all 16 holes have been marked and drilled, it is time to attach the corner brackets. This part could be tricky, because you half of the screws' rounded heads will be inside the Test Section, while the other half will be outside of the Test Section. Specifically, the screws heads on the left and right sides of the Test Section (when it lies on its 2-ft. dimension) will be outside of the Test Section, while the screw heads on the top and bottom will be inside the Test Section. Although this may be confusing, it is actually very simple once you define which boards of the Test Section are the top, the bottom, and the two sides.
- If you are wondering why the screws need to be put into the Test Section two different ways, it has to do with the way that the three assemblies will connect together in the end to make the full wind tunnel assembly. The screws with their heads on the outside of the Test Section need to be on the sides of the Test Section, because they will be attached with springs to the other two assemblies, so that the springs hold the entire wind tunnel together and make it airtight.
- Why not just have all of the screws this way? You need as few screws as possible with their threaded ends going into the Test Section, because they would disturb the airflow. You want to have as little turbulence as possible in the Test Section. So, for the screws on the top and bottom of the Test Section, make sure that the rounded heads are the ends on the inside, so that the air can smoothly pass over the metal.
- Note: You might notice in the following pictures that the screws are not placed as previously described. Instead, they are all oriented with their rounded heads inside the Test Section. This is a result of the engineering design process—the idea of how the three assemblies were going to connect changed after the Test Section was built and the pictures were taken, so the screws were replaced later on so that the heads were outside of the Test Section and not on the inside.
- Attach the corner brackets so that the part on the side of the Test Section has its screw head out of the section, while the part on the top/bottom of the Test Section has its screw head on the inside. Do not mix up the sides—remember which ones you defined as sides and which ones you defined as top/bottom. Perhaps use sticky notes to help you remember. Your helper will know the best way to use the drill, nuts, lock washers, and screws, but make sure you also understand. Figure 1D shows an edge-on perspective of this reinforcement—note the bracket with its screws, and the silicone, which also keeps the Test Section together.
/-/https/www.sciencebuddies.org/cdn/Files/614/7/wind-tunnel_1C.jpg)
/-/https/www.sciencebuddies.org/cdn/Files/615/7/wind-tunnel_1D.jpg)
Figure 1D. Edge-on view of an attached corner bracket.
- Figure 1E shows the fully reinforced Test Section.
/-/https/www.sciencebuddies.org/cdn/Files/616/7/wind-tunnel_1E.jpg)
Figure 1E. Test Section fully reinforced by corner brackets. Edge-on view of an attached corner bracket.
Once you have completely connected the four Plexiglas boards together, you have finished the Test Section part of the Test Section Assembly. Now you must make the Base of the Test Section Assembly.
Part B: Base of the Plexiglas Test Section
- This part of the wind tunnel is dependent upon how much scrap wood you have available to you, and what kind of force sensors you will use. Talk to your mechanically inclined helper about what design you should go with, and figure out the best way to build it. What you absolutely need is a Base that will strongly support the Test Section, and that will be large enough that it cannot easily tip over. Because of this, you will most likely want a board for the Base with dimensions of about 1.5' x 2' so that it is just as long as the Test Section, but slightly wider. You also want to have two legs that connect the Test Section to its Base, and they should be near the front and back ends of the Test Section. Refer back to Figure 1A.
- Before you attach the Test Section to its Base, you need to make a decision. You will be running a rod, or some sort of mounting object, through the bottom board of the Test Section, in order to mount a model. This object will attach to the force sensors underneath it. Decide on what kind of hole you need in the bottom of the Test Section, through which your object will be inserted, and decide if it will be easier to make the hole before or after the Test Section is attached to the Base. For the Science Buddies wind tunnel, we used a threaded rod with a small diameter, so a small circular hole was drilled in the bottom of the Test Section. Whatever you use, make sure that the hole is large enough so that the rod does not touch the sides of the hole, even when the fan is turned on. This will disturb the sensor readings and produce inaccurate results.
- Also, you need to figure out the best way to attach your force sensors. You will need two—one for lift and one for drag. You absolutely must have right angles (as perfect as you can make them) between the drag sensor and your connection rod, so that no component of the lift force affects the drag measurement. See Figure 1A for the example from the Science Buddies wind tunnel. Notice how one sensor is mounted so that the rod comes straight up out of it (lift sensor) and the other is mounted so that its rod is perpendicular to the other force rod (drag sensor).
- As you can see from Figure 1A, the Base was made so that it has two smooth rods onto which the sensors can easily clamp. In the same way, you and your helper must decide on the best way to mount the sensors you have, and make sure that they will be completely perpendicular so that you can get the most accurate readings possible. You must also make sure that the long objects you use to mount the model are very rigid and will not bend or move around in the wind, because this will also alter your readings.
- Finally, you need to figure out a way to mount your model so that it can be given an angle of attack in order to be tested from more than just the fixed mounting position. For the Science Buddies wind tunnel, the rod that attaches to the model is bendable so that its angle can be measured before it is inserted into the Test Section and a model is mounted on it.
Diffuser
Diffuser
Building the Diffuser Assembly
This assembly houses the fan and the wind speed sensor. It is perhaps the easiest of the three assemblies to build. It will look like the following:
/-/https/www.sciencebuddies.org/cdn/Files/601/7/wind-tunnel_2A.jpg)
Figure 2A. The full Diffuser Assembly.
This is the largest assembly, and it is the only one that is made up of electronic components and wiring, so you will need the help of your physics teacher or an electrician, as well as a carpenter or woodshop teacher. It is composed of the Diffuser, the Drive Section (fan), Drive Section Control (fan switch), Wind Speed Sensor, and the Diffuser Base. Make sure that you identify these components in Figure 2A before moving on.
For this assembly, you will need the following parts:
- 4' x 8' plywood board
- 17" x 17" plywood board
- Gable-mounted fan
- Electrical wiring materials (for an on/off switch)
- Small handheld cooling fan
- Wire sheet (17" x 17")
- Rubber gasket, 4'
- Wood glue
- Wood screws, washers, lock washers, bolts
- Drill
- Nail gun
- Scrap wood for the Base
- Drawer handles (2)
As with the Test Section, you will need to work with your carpenter/woodshop teacher to design the proper base for this long assembly. Again, it depends on what kind of scrap wood you have available, or how much more wood you can buy.
Part A: Drive Section
The first part of the Diffuser Assembly's construction is the Drive Section. This is composed of the fan and the 17" x 17" board. The board is 17" on all four sides, based on an aeronautical ratio given in Low Speed Wind Tunnel Testing (Barlow, Pope, and Rae, 1999). The area of the Drive Section (the large end of the Diffuser) should be 2–3 times that of the area of the end of the Test Section (also the area of the small end of the Diffuser), with best results if the ratio is 2:1. The area of 17" x 17" is almost exactly twice that of 12" x 12" (289 square inches: 144 square inches is almost equal to 2:1), which is why the board should be 17" x 17". The board should also be rather thick in order to hold the fan tightly and to keep the Diffuser stable.
- The board will be the back end of the Diffuser Assembly, so the fan needs to be mounted to it. First, you need to cut a circular hole in the board that has a diameter just about that of the fan blades, so that all the air blown by the fan goes through the hole. The hole needs to be centered on the board and should be as circular as possible.
/-/https/www.sciencebuddies.org/cdn/Files/602/7/wind-tunnel_2B.jpg)
Figure 2B. You can see that the hole is large enough so that all blown air will go through the circular hole.
- Next, place the fan face down over the hole to make sure it fits properly, and screw it into place (using washers) so that it is firmly attached to the board. Once you have done this, you have completed the Drive Section assembly of the wind tunnel. The Drive Section will serve as the foundation for the rest of the Diffuser. It is easiest to build up from the Drive Section, so leave it on your work table, face down. The fan will blow out of the wind tunnel, not into it, which is why the Drive Section is at the back end of the wind tunnel and why you will build up from the face-down Drive Section.
Part B: Diffuser Body
- Next, have your 4' x 8' board cut into four pieces. The pieces need to be equal, trapezoidal shapes. One base of the trapezoid should be 17" in length and the other should be 12" in length. Have your carpenter/woodshop teacher help you. Make sure to check back to Figure 2A if you are confused. These boards will form the side walls of the Diffuser.
- Once all four have been cut, set aside all of your scrap wood (you may need it later). You will attach all four trapezoidal boards to the Drive Section in order to make the Diffuser. Before you start, make sure you understand what the Diffuser does and what it looks like (see Figure 2A again). The Diffuser takes a small volume of air (passing out of the Test Section through a 1' x 1' area) and expands it into a larger volume of air (this is why the Diffuser has a large end and a small end). The four boards are cut into trapezoids so that they can all be attached on their longest edges to form the pyramid-like shape you see in Figure 2A.
- To get started, make sure you have wood glue, a drill, and a nail gun handy. Hold one of the boards so that the 17" edge is up against the edge of the Drive Section, and so that both are lying down on the table. You will put wood glue on the trapezoidal board and then stand it up so that it becomes attached to the Drive Section. Run a line of wood glue along the face of the trapezoidal board at the 17" end, and then stand it up so that it becomes glued to the edge of the Drive Section. Hold it for a few minutes to allow the glue to dry, and then drill two or three screws with washers into the boards so that they are held together without your help anymore. This will keep the glue in place while it dries, and allow you to attach the other three boards. See Figure 2C for a visual.
/-/https/www.sciencebuddies.org/cdn/Files/603/7/wind-tunnel_2C.jpg)
Figure 2C. In this figure, two of the trapezoidal boards have been attached to the Diffuser already.
- Before you attach all four boards, make sure that you cut a hole in one of them through which you can run a tube, housing the control wires from the fan. See Figure 2D for a visual. Cut the hole to be as small as possible, and so that the tube fits snugly through it and plugs it to prevent the escape of airflow. If the tube has a control box on the end, remove it, because you will need to run the tube through your hole, and you will attach your own control box to the wires later.
/-/https/www.sciencebuddies.org/cdn/Files/604/7/wind-tunnel_2D.jpg)
Figure 2D. Run the wires from the fan through a hole in one of the Diffuser walls.
You should use silicone to glue it in place and seal any possible openings through which air could escape.
- Attach the rest of the boards. When you have glued and drilled them all into the Drive Section, you will have something that looks like the Diffuser of Figure 2A, but without the four boards attached to each other.
- Wait for the glue to dry before you continue. Your next step is to attach the four boards together so that you have an enclosed and airtight Diffuser body. This will be a little tricky because you will have to bend the boards a little, and hold them together. You will use wood glue and a nail gun, so make sure that your carpenter/woodshop teacher is careful when firing nails into the boards. Your goal is to attach them so that you have a square hole at the top, with the same dimensions as the Test Section's end, 12" x 12".
- Begin by recalling the way that the Plexiglas boards were connected—you used
silicone to attach the edge of one to the face of the other. In the same way, you
will attach the edge of one board to the face of the other. You'll also need to
make sure that you have one dimension of the 12" x 12" opening slightly longer than
the other, just as with the Test Section, so that they fit properly together.
In order to do this properly, you need to clearly define which boards are the sides, and which are the top and bottom of the Diffuser. This should be easy to remember because the board with the hole and wire tube will be a side board, so keep that in mind. Make sure that the square hole will be flush with the Test Section's hole, so that the air will have a smooth transition as it passes from the Test Section to the Diffuser.
- Begin closing the Diffuser by running a line of glue along the edge of one of the top or bottom boards. Then, before all the glue runs down and drips off, hold the two boards together as best as you can so that the edges are closed and form a good corner. Have your helper fire a series of nails into the corner, through the face of the side board, into the edge of the other board, so that the length of the nail goes into wood instead of pointing out the other side of the boards. You won't be able to seal it at the corner of the Drive Section because the boards will be bent, but this will be fixed later so don't worry.
- Attach all four of the boards together in this way, keeping in mind that the top/bottom boards need to be attached by their edges to the inside faces of the side boards. You should now have a pyramid-like object, which looks very similar to that in Figure 2A. Leave it standing on the Drive Section and let it dry for a while.
- Once the glue has dried, you can set the Diffuser on one of its sides. Inspect all of the points of contact of all the various boards, and make sure that they are airtight. Fire more nails into weak connections to reinforce them, and use silicone anywhere that does not seem airtight (except for the four large holes at the corners of the Drive Section). You may want to fire a series of nails into the Drive Section to reinforce the drilled screws and so that the boards are firmly attached to the Drive Section, which is relatively heavy.
- In order to seal the large holes in the four corners, get your construction sealant and have your teacher carefully seal the holes, as shown in Figure 2E.
/-/https/www.sciencebuddies.org/cdn/Files/605/7/wind-tunnel_2E.jpg)
Figure 2E. Fully sealed Diffuser corner.
- Your Diffuser should now be fully sealed. Before you move on, there is one final airflow concern to address. Look down into your Diffuser to see the Drive Section fan. Notice that the fan is circular, but the end is a square, and that the corners of the board are actually walls that will disturb the airflow. This can cause turbulence in the Diffuser and affect the airflow in the rest of the wind tunnel. However, your fan will negate almost all of this turbulence by drawing the corner air to the circle and blowing it out. Look down into the inside corner of the Diffuser, through the Drive Section's fan hole (as in Figure 2F). If your fan is like the one used by Science Buddies, then there is plenty of open space through which the fan will draw the disturbed corner air and blow it out before it affects the air in the rest of the wind tunnel too much. Make sure you understand this so that you can explain it later if need be, and cite it as a source of error when you compose your report for any science fair project you do.
/-/https/www.sciencebuddies.org/cdn/Files/606/7/wind-tunnel_2F.jpg)
Figure 2F. The fan gives plenty of space for air to pass from the corners to the blades.
Turbulence created at the corners of the Drive Section is sucked into the fan and blown out of the Diffuser.
- Before you make your control box for the fan, you need to take care of a potential safety issue. The fan spins very quickly and is very sharp, which could severely injure fingers and hands. To protect against this, take the cut of wire sheet and attach it to the Drive Section. Use screws and large washers, and make sure that the edges of the wire sheet are not sharp or dangerous. Refer to Figure 2A to see how the sheet looks when attached.
Part C: Electrical Control Box
Now that you have made the Drive Section safe, it is time to put your control box together. Basically, you will use a switch like those you use to turn on lights in your house. Note that wind tunnels, like the UC Davis wind tunnel, actually have many speeds for their fans, instead of just on and off. This is known as a variable speed drive section. While it would be ideal to have a variable speed switch for your wind tunnel, it is more practical to have the on/off switch, because it is difficult to find a variable speed switch for the purposes of this project. A dimmer will not work because you need to know the exact speed of your fan and be able to reproduce the exact speed with a quantitative button, instead of with a qualitative dial. Other types of switches are usually too weak to handle the voltage of an attic fan. Since it is so difficult to find a variable speed switch, it is best to use an on-off switch and then plug the fan into a variable AC transformer (see if your physics teacher has a piece of equipment like this). This way, you can quantitatively set the amount of power that your fan will use, and then turn it on, essentially giving you variable speed control. This will be mentioned again later.
- Putting together the on/off switch should be fairly simple for your electrically inclined helper, so allow him or her to determine the best way to make it. All that you need is an on/off switch for the fan, mounted onto the side board of the diffuser. See Figure 2A for reference.
- Once you have fully assembled the fan control, it is finally time to test the fan! Bring the diffuser to an area where there is an outlet, and plug it in and turn it on. To demonstrate that the fan draws air into the wind tunnel, securely hold a light object at the small opening of the Diffuser and see what happens when the fan is turned on. As in Figure 2G, the object should be drawn into the Diffuser with a considerable amount of force. Note: Make sure that you hold on tight so that the object doesn't fly out of your hands and get chopped up by the fan!
/-/https/www.sciencebuddies.org/cdn/Files/607/7/wind-tunnel_2G.jpg)
Figure 2G. The effect of the Drive Section fan is demonstrated here using a glove.
Part D: Base
Next you need to build a Base for the Diffuser. As with the Test Section, check with your carpenter/woodshop teacher to determine the best and safest way to do this with the wood that you already have. You may need to buy more pieces of wood, depending on what kind of scrap you have available. An example of a good Diffuser Base design is given in the following figure:
/-/https/www.sciencebuddies.org/cdn/Files/608/7/wind-tunnel_2H.jpg)
Figure 2H. An example of a Diffuser Base.
Note that the Base may be difficult to build, given the shape of the Diffuser. It needs to stand level on the ground, but the bottom side of the Diffuser slants down from front to back. Make sure that your carpenter/woodshop teacher records the angle of slant and that you build the Base so that it attaches at a slant, in order to keep the Diffuser level with the ground and therefore, aligned with the direction of airflow through the Test Section.
Part E: Gaskets, Spring Hooks, Handles, and the Wind Speed Sensor
- Take another look at Figure A in the Objective section of this how-to guide. Recall that the wind tunnel is composed of three main components, which will be held together by springs and can be easily taken apart. This assumes that the components fit with each other at the 1' x 1' openings. Obviously they will not fit perfectly, so to compensate for this, you need to attach rubber gaskets to the edges of the Diffuser and Contraction Cone, which will come into contact with the Test Section. Cut your rubber gasket into four 1' x 1' strips, one for each of the four edges of the Diffuser's front end. Make sure that they are cut to the proper length. Peel off the paper on the back and attach each gasket to its edge, making sure that they do not stick out too much into the 1' x 1' area. If they do, it will disrupt the airflow as it passes from the Test Section to the Diffuser. Also, make sure that the corners where they meet have as little separation as possible. If they are too separated, air could leak out of them and disrupt the airflow. See the following figures for visual aids.
/-/https/www.sciencebuddies.org/cdn/Files/609/7/wind-tunnel_2I.jpg)
Figure 2I. Rubber gasket stripping on the front edges of the Diffuser.
/-/https/www.sciencebuddies.org/cdn/Files/610/7/wind-tunnel_2J.jpg)
Figure 2J. Example of a well-covered corner.
This is a picture of a corner from the Contraction Cone, which will be built in the next section.
It serves as an example for the gaskets on the Diffuser.
- You are almost finished with the Diffuser Assembly! Now you need to add four spring-connecter screws to the Diffuser, which will be used to connect the three wind tunnel components. Recall from building the Test Section that you the heads of the screws need to be on the outside so that the springs can hook onto them. You will use screws, washers, nuts, and lock washers, as before, and the threaded ends will protrude into the Diffuser. Again, this is a slight disturbance to the airflow, but it is necessary in order to get the springs to hook the Diffuser to the Test Section. Try to make the screws protrude into the Diffuser as little as possible, as in Figure 2I, in which only the nut protrudes into the airflow. Make sure that the screws are in the same positions, relative to the 1' x 1' opening on the Diffuser, as they are on the Test Section. You might want to put the two components side-by-side in order to make sure that the screws are aligned properly. You will attach the two sections together using springs hooked onto these screws, so their alignment is important.
- The next step is to attach the wind speed sensor, which is made using the small, handheld personal fan. You may be wondering how a fan can be a wind speed monitor, since it is used to blow air instead of to measure wind. Actually, it can be used for either purpose. If used as a fan, voltage is an input (batteries), and if used as a monitor, voltage is an output! Basically, you will take the batteries out, and run wires from the motor to a voltage monitor (called a voltmeter—your physics teacher should have one). This way, when the wind from the Drive Section causes the sensor's blade to spin, the motor will produce electricity, which will be measured by the voltmeter. First, you need to take the batteries out of the personal fan, and remove all parts, except for the body, the fan blade, and the motor. Next, you need to solder your wire to the motor in order to transfer voltage to a voltmeter. Your physics teacher/mechanically inclined helper should know how to solder, and can determine the best way to wire the sensor. Visit the Science Buddies How to Solder Electronic Components: Electronics Primer page for helpful instructions.
- Now that you have attached wires to the motor, put the personal fan back together
and attach it to the inside of the front of the Diffuser, as shown in Figure 2K.
The motor will cause some turbulent disturbance, but this is allowable—nearly
every single educational open-circuit tunnel uses a wind speed monitor that blocks
airflow, so the effect on this wind tunnel's accuracy is easily dismissed.
- When viewing Figure 2K, note that the fan is off to the side, but about halfway
from the top and bottom. Make sure that your wind speed monitor is in the same position,
and that there is space all around it for air to flow—do not mount it to the
inside of the Diffuser, because air will not properly flow around it and its readings
will be inaccurate.
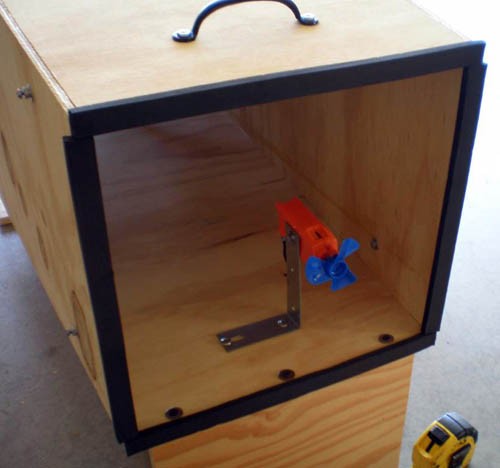
Figure 2K. The wind speed monitor is mounted on the inside of the Diffuser at the front, slightly to the side.
Note: There is a handle on the Diffuser, which will be attached later on. - Make sure that the fan is firmly secured so that it does not tilt—it must point directly into the airflow.
- You also need to drill a very small hole in the Diffuser near the sensor, through which the wires will be run. As with the hole drilled for the control tube of the fan, this hole must also be small enough to not let much air through.
- When viewing Figure 2K, note that the fan is off to the side, but about halfway
from the top and bottom. Make sure that your wind speed monitor is in the same position,
and that there is space all around it for air to flow—do not mount it to the
inside of the Diffuser, because air will not properly flow around it and its readings
will be inaccurate.
- Finally, it is time to attach the handles. Given the fact that the Diffuser Assembly is rather large and is heavy only on one end, it is difficult to move, so you need some handles for personal safety. Two people should always move the Diffuser Assembly together, instead of trying to do it by yourself, because it could hurt your back and it takes less time to move with teamwork. To attach the handles, simply screw two of the drawer handles into the Diffuser at either end, and make sure that their screws do not protrude into the Diffuser. See the following figure for a visual of the handle at the Drive Section end of the Diffuser. Also, refer back to Figure 2K to note the handle at the Test Section end.
/-/https/www.sciencebuddies.org/cdn/Files/611/7/wind-tunnel_2K.jpg)
/-/https/www.sciencebuddies.org/cdn/Files/612/7/wind-tunnel_2L.jpg)
Figure 2L. Drive Section handle
Contraction Cone
Contraction Cone
Building the Contraction Cone Assembly
This assembly will be at the forward end of the tunnel, into which the air will flow as it is drawn in by the fan at the back. This assembly consists of the Contraction Cone and the Settling Chamber.
/-/https/www.sciencebuddies.org/cdn/Files/505/7/wind-tunnel_3A.jpg)
Figure 3A. The full Contraction Cone Assembly.
For this assembly, you will need the following parts:
- 2' x 4' oak boards (all 4)
- Honeycomb mesh
- Aluminum screening
- Rubber gaskets (leftover from the Diffuser assembly)
- Wooden lattice
- Wooden corner guard
- Zip ties
- Staple gun
- Wood glue
- Screws, washers, lock washers, bolts, etc.
- Drawer handles (2)
- Scrap wood
Part A: Contraction Cone
- First, cut your four boards into equal trapezoidal shapes. Like the Diffuser Assembly, the Contraction Cone Assembly has a large end and a small end. Unlike the Diffuser Assembly, however, the Contraction Cone Assembly takes a large volume of air and turns it into a small volume. The area ratio of the front to the back is based on a ratio just like with the Diffuser, except this ratio is 7:1 rather than 2:1. This means that the edges on the large end of the Contraction Cone Assembly need to be 32" long, because 32" x 32":12" x 12" is just about 7:1. You now have the base dimensions for your trapezoidal cuts: 32 in. and 12 in. The height should be 2 ft., so your carpenter should just measure out each base on both of the 4-ft. edges of the boards, and make sure that they are centered with each other. See Figure 3A for a visual of the way the board should be cut.
- Next, connect the four boards in the same way that you did with the Diffuser. This will be trickier, though, because you don't have anything like the Drive Section to connect the boards to. Instead, you will just have to connect them to each other, one by one, using wood glue and a nail gun. Remember, as with both of the other components, you need to make sure that they fit together with minimal airflow interruption as it passes from the Contraction Cone to the Test Section.
- The use of the nail gun is why the boards need to be relatively thick, because if you have thin boards, the nails are likely to not go straight into the wood and will instead poke out into the Contraction Cone, disrupting airflow.
- Once you have connected all four boards, you should let the Contraction Cone dry. It should look like the Contraction Cone in the Figure 3B.
/-/https/www.sciencebuddies.org/cdn/Files/596/7/wind-tunnel_3B.jpg)
Figure 3B. This is the Contraction Cone Assembly.
- Next, you need to reinforce the Contraction Cone. You have probably noticed that it is wobbly and unstable, just like the Test Section was before you reinforced it with brackets. For this, you will need the wooden corner guard. Cut it into four equal pieces and attach each one to the corners of the Contraction Cone, using wood glue and a staple gun. You will probably not have enough corner wood to completely cover the corners of the Contraction Cone, but if you cut it into four equal lengths and connect them to the corners, you will greatly reinforce the Contraction Cone's structural integrity. See the following figures for visuals.
/-/https/www.sciencebuddies.org/cdn/Files/597/7/wind-tunnel_3C.jpg)
Figure 3C. Reinforced Contraction Cone.
/-/https/www.sciencebuddies.org/cdn/Files/598/7/wind-tunnel_3D.jpg)
Figure 3D. Attach the wooden corner guard using wood glue, as well as staples from the nail gun.
Part B: Base, Spring Hooks, and Gaskets
- Now that the Contraction Cone is sturdy, you will need to work with your carpenter/woodshop teacher to make a Base for it, just as with the other parts. Again, this will depend on what scrap wood you have available, and what other wood you can buy. Make sure that your carpenter keeps track of angles, just as with the Diffuser Base, in order to allow the Contraction Cone to stand level. Here are visuals of a Base design example.
/-/https/www.sciencebuddies.org/cdn/Files/599/7/wind-tunnel_3E.jpg)
Figure 3E. Side view of the Contraction Cone Base.
/-/https/www.sciencebuddies.org/cdn/Files/600/7/wind-tunnel_3F.jpg)
Figure 3F. Underside of the Contraction Cone Base.
- As with the Diffuser, the Contraction Cone also needs to have rubber gaskets attached to its front end so that it can form an airtight seal with the Test Section. Refer back to Figures 2I and 2J.
- Also, the Contraction Cone needs to have connection screws just like on the Test Section and the Diffuser. They need to be aligned with those of the Test Section, and should be made from the same parts.
Part C: The Settling Chamber
- Finally, you need to build the Settling Chamber. This is actually a simple component—it is nothing more than the honeycomb mesh and one or two screens in the large end of the Contraction Cone, which cut turbulence to a minimum and improve airflow quality. One screen is acceptable, but it is best to have two. The honeycomb mesh should go at the mouth of the large opening, and the screen(s) should be inside the cone, about an inch behind the mesh. If you use two screens, there should be 1 in. between them, so that there is about 1 in. or so between all three parts of the Settling Chamber. The Science Buddies wind tunnel only has one screen, but if you can use two, that gives you even more control over airflow.
- Work with your carpenter/woodshop teacher to figure out the best way to attach the honeycomb mesh and screen(s) to the front of the Contraction Cone. You don't want them to go too deep into the Contraction Cone. Refer back to Figure 3A and take a close look at the Settling Chamber in the Contraction Cone in the foreground, and note the honeycomb mesh and the screen behind it by looking closely at the figure. The Science Buddies wind tunnel uses zip ties to attach the honeycomb mesh to a series of staples on the outside rim of the Contraction Cone, so the inclusion of zip ties in the materials list is a suggestion. When putting these two components in the Contraction Cone, make sure that you keep airflow in mind, and avoid using any jutting objects or rough surfaces.
- Finally, the Contraction Cone needs handles, just like the Diffuser. Attach the handles at the top of the Contraction Cone for easy transport. Refer back to Figure 3A for a visual.
Assembling
Assembling
Putting It All Together
- Now that you have built the three components of the wind tunnel, it's time to put it together and test it! First, you need to get eight springs, as shown in the following figure:
/-/https/www.sciencebuddies.org/cdn/Files/506/7/wind-tunnel_4A.jpg)
Figure 4A. These springs will hold the three assemblies of the wind tunnel together.
- Next, place the three components end-to-end so that they look like the wind tunnel in Figure A. One by one, connect the components by their connection screws, using the springs, and making sure that the gaskets are airtight, and that the 1' x 1' square areas all fit properly together to ensure smooth airflow. See Figure 4B for a visual of one side of the connected wind tunnel.
/-/https/www.sciencebuddies.org/cdn/Files/591/7/wind-tunnel_4B.jpg)
Figure 4B. The eight springs are used to connect the Diffuser Assembly and the Contraction Cone Assembly to the Test Section Assembly.
- The tunnel should now be connected and look like that the one in Figure A. Now, all you have to do is set it up in whatever space you have for it, attach your equipment, and you're ready to test! If you have not already done so, move the three assemblies to the place where you will keep and use the wind tunnel, and reattach them so that they form the full wind tunnel.
- Recall that in Section 1, Part B, you and your carpenter/physics teacher designed a Base that would hold the force sensors perpendicular so that they would connect to a single rod coming down from inside the Test Section. Now that the wind tunnel has been built, attach those sensors. The following figure is an example of sensors mounted to the base of the Test Section Assembly. Note the rods and the airfoil mounted inside the Test Section, ready to be tested.
/-/https/www.sciencebuddies.org/cdn/Files/592/7/wind-tunnel_4C.jpg)
Figure 4C. Two force sensors mounted to the wind tunnel.
One is for lift, one is for drag, and they are perpendicular.
An airfoil is mounted to the sensor rods.
Again, the figure presents only an example. While it is suggested that threaded rods be used to connect the airfoil to the sensors, it is up to you and your physics teacher to decide the best way to connect the particular sensors you have to any models you may mount. You should also take into account the best way to mount models onto your rods; the Science Buddies wind tunnel uses models carved out of balsa wood, into which threaded casings may be drilled so that they can be easily screwed onto the rods. Finally, don't forget that you can also test models with an angle of attack. For the Science Buddies wind tunnel, the threaded rod can be bent at a predetermined angle and then inserted into the Test Section. Depending on your ideas for testing angle of attack, it may be best to have multiple rods so that they can be replaced when bent, instead of trying to bend them back into their original perfectly straight shape.
- Now it's time to attach monitoring equipment to the wind speed sensor (recall that this is the small handheld fan that is mounted in the Diffuser). Obtain a voltmeter, and attach the sensor's fans to the voltmeter so that when the sensor's fan spins, it will produce a voltage in the wires that will register on the voltmeter. See Figure 4D for an example of a voltmeter.
/-/https/www.sciencebuddies.org/cdn/Files/593/7/wind-tunnel_4D.jpg)
Figure 4D. A voltmeter used to determine the wind speed in the tunnel.
Note that the two wires from the wind speed sensor have been attached to the sensor.
The sensor measures voltage, which is indirectly a measure of wind speed. It does not give a velocity reading, but the voltage reading for each speed in your wind tunnel will be constant, so it is reliable. For instance, if you turn the fan on full speed and get a particular voltage reading, such as 2.8 V, and then turn the fan to that same speed on another day, the voltmeter will read just about 2.8 V again. Due to this consistency, your wind speed determinations will be based on relative voltages for different settings on your wind tunnel fan. You may also be able to determine the relationship of velocity to voltage, and develop a conversion chart so that you can look up the voltage you read and determine the wind speed inside the wind tunnel. Talk to your physics teacher about this. It is not necessary to develop such a chart, but figuring out how to do it would certainly add to your understanding of aerodynamics!
- The last piece of equipment to attach is the variable AC adapter, which allows you to control the amount of energy the fan receives and thus have a variable wind speed tunnel. Obtain an adapter, plug it into a power outlet, and then plug the wind tunnel fan into the adapter. Figure 4E shows an example of an adapter:
/-/https/www.sciencebuddies.org/cdn/Files/594/7/wind-tunnel_4E.jpg)
Figure 4E. This device allows you to control how much electricity the fan gets, control the airflow.
- You have now attached all of the necessary equipment to the wind tunnel. Figure 4F shows the sensors of the wind tunnel: lift force, drag force, and wind speed.
/-/https/www.sciencebuddies.org/cdn/Files/595/7/wind-tunnel_4F.jpg)
Figure 4F. All three sensors of the wind tunnel.
Testing
Testing
Testing the Wind Tunnel
- It is finally time to test the wind tunnel. You need to collect some test data from the force sensors you use, so depending on what type they are, prepare them for this. The sensors used by the Science Buddies wind tunnel are made by Vernier Scientific and are hooked up to a computer with Logger Pro installed (software you can purchase from the Vernier website. This software collects data from the lift and drag sensors.
- Attach a model to the sensor rod inside the Test Section (this will require you to disconnect the springs at the Contraction Cone and move it out of the way so you can access the interior of the Test Section, and then reconnect the Contraction Cone). Before you can collect any data, you need to calibrate the sensors. Calibration is a process by which you use known force values and define them for the sensors, so that they function as accurately as possible. Talk to your physics teacher about calibration. You must calibrate the sensors every time you test a new model, or turn on the equipment; otherwise, your data is meaningless. Check the instructions for your sensors to determine how to perform the calibration.
- To calibrate the lift sensor, simply define the weight of the model on the rods as 0 pounds/Newtons, and then put a known weight on the model (such as a 100-g weight, which exerts a .98-N force on the model) and define the force experienced by the sensor, using the known weight. Since this force pushes downward on the lift sensor, it is wise to define it as a negative number, such as -.98 N. This way, when the model lifts, or pulls up on the sensor, your readings will be positive. See Figure 5A for a visual of using known weight to calibrate the lift sensor.
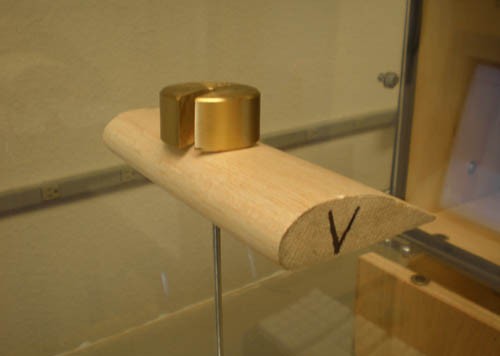
Figure 5A. A known weight is placed on the model.
This is so that the known-weight value will allow the user to verify the sensor readings.
This is known as calibration. - Calibrating the force sensor is done in the same way, although you will need to take the sensor off of its mount on the Test Section Base. Set it upright, so that it is like the lift sensor, and calibrate the sensor by telling it what 0 force is (when nothing is pushing or pulling on it), and then use a known weight to finish the calibration. Unlike the lift sensor, however, this is a drag sensor, which means that the force of drag will be pushing into the sensor, so any weight on it should be defined as positive, not negative. Once you have calibrated this sensor, remount it on the Test Section Base. Having properly calibrated your sensors, you are now ready to perform your test and collect data from the model.
- To test the wind tunnel and start collecting data, make sure that:
- The springs are holding the wind tunnel together.
- There is no place for air to escape.
- The equipment is all plugged in.
- The force sensors are calibrated.
- The model is properly mounted inside the Test Section.
Treat these conditions as something of a checklist before you test a model every time. See Figure 5B for the full setup.
/-/https/www.sciencebuddies.org/cdn/Files/507/7/wind-tunnel_5A.jpg)
/-/https/www.sciencebuddies.org/cdn/Files/553/7/wind-tunnel_5B.jpg)
Figure 5B. The work station in this figure is fully prepared to test.
The sensors are calibrated and ready to collect data.
The model is mounted in the Test Section.
- Now, before you turn on the fan, adjust the variable AC adapter to the desired level (for a test, you probably just want to use the highest setting, so that you are essentially just turning the fan on all the way), and then flip the Drive Section control switch to the "on" position. Let the fan get to its rotation speed, and then begin collecting data. You will collect two series of small data points, taken at regular intervals of time—one series for each force sensor. You want to collect data only for a short time, such as 10 sec. or so, and then stop collecting. Produce graphs of all of the data points so that you can note trends, and use a computer to perform a statistical analysis of all of your data points, such as average force, standard deviation, etc. Figure 5C is an example graph of data points collected from the Science Buddies wind tunnel, and the caption contains all of the pertinent information that you will need to record from your own tests.
/-/https/www.sciencebuddies.org/cdn/Files/554/10/wind-tunnel_5C.jpg)
Example graph measures the drag force over time experienced within a homemade wind tunnel. The drag values slowly increase over time but the graph only shows about 5 seconds of data so that may just be data gathered when the fan is not running at full capacity. The range of drag values are between 0.015 and 0.04 Newtons.
Figure 5C. This is a graph of the data points taken by the drag sensor.
Drive Section fan at 100% speed, wind speed voltmeter reading of 2.8 V.
Average force of +0.028 N, standard deviation of +/- 0.005.
- Make sure that the wind tunnel and the sensors worked properly when you tested it. Make sure that your data makes sense (for instance, do you have a positive average drag? This would make no sense because there is no force pushing the model forward, only a force pushing it back as the air passes over it). If everything appears to be in order, then your wind tunnel is ready to be used in science fair projects and demonstrations!
Remember, if you have any questions, comments, or concerns, visit our SciBud Wind Tunnel Questions thread in the Ask an Expert forum, set up just for this Wind Tunnel How-to Guide.
Bibliography
A number of other texts and people were consulted during the creation of this wind tunnel construction guide. Those texts and people are listed here.
Print resources:
- Barlow, Jewel B., Alan Pope, and William H. Rae, Jr. Low-Speed Wind Tunnel Testing. 3rd ed. New York: John Wiley & Sons, Inc., 1999.
- Collins, Luke, James Flint, Ben Morgan, Clint Witchalls, and Chris Woodford. Cool Stuff and How It Works. 1st ed. New York: DK Publishing, Inc., 2005.
- Mehta, R. D., P. Bradshaw. "Design Rules for Small Low Speed Wind Tunnels." Aeronautical Journal (1979): 443-449.
- Smith, H. C. "Skip." The Illustrated Guide to Aerodynamics. 2nd. New York: TAB Books, 1992.
Web-based resources:
- Baals, D. (n.d.). Wind Tunnels of NASA. Retrieved August 2008.
- Benson, T. (2008, July 14). Beginner's Guide to Wind Tunnels. Retrieved February 26, 20014.
- Bradshaw, P and Mehta, R. (n.d.). Wind Tunnel Design. Retrieved August 2008.
- Bugg, R., Cyron, R., Houser, M., Oberlitner, S., and Saracen, J. (n.d.) Miniature-Portable-Subsonic Wind Tunnel for Aerodynamic and Heat Transfer Measurements Designed for Classroom Demonstration Purposes. Retrieved August 2008.
- Cleghorn, C. (2004, February). NASA's Wind Tunnels Fact Sheet. Retrieved February 26, 2014.
- Clifford, R. C. (2003, June). Home-Made Wind Tunnel. Retrieved July 2008.
- Clifford, R. C. (2003, July). Home-Made Wind Tunnel, Part 2. Retrieved July 2008.
- Erwin, B. (n.d.). The Baals Wind Tunnel. Retrieved August 2008.
- G.U.N.T. Gerätebau GmbH. (2005). Educational Wind Tunnel. Retrieved August 2008.
- Hodanbosi, C. (n.d.). Abstract: The Wandering Wind Tunnel. Retrieved August 2008.
- U.C. Davis College of Engineering. (n.d.). U.C. Davis Aeronautical Wind Tunnel Facility. Retrieved August 2008.
- Wright Brothers Aeroplane Co. (n.d.). 1901 Wind Tunnel. Retrieved August 2008.
- The Wright Experience. (2002). In Depth: The Wind Tunnel.Retrieved February 26, 2014.
Consultants:
- Adkins, Jeff. Astronomy and Physics teacher, Director of the ESPACE Academy. Deer Valley High School, Antioch CA. Design and mechanics consultant, donator of sensory equipment.
- Dumin, Ed. Technology teacher. Deer Valley High School, Antioch CA. General consultant.
- Soraoka, Daniel. Aeronautical/Mechanical Engineering student at Embry-Riddle University, Prescott AZ. Design consultant.
- Spahn, Jordan. Foreman, Industrial Electrician. Cupertino Electric, San Jose CA. Materials and construction consultant.
- Van Dam, C. P. "Case." Professor of Aerodynamics at U. C. Davis, Director of the U. C. Davis Aeronautical Wind Tunnel Facility. Davis CA. Design consultant and conceptual editor.
Credits
Justin Spahn, Science Buddies Intern
Rebecca Steelman, Editor
- Plexiglas® is a registered trademark of Rohm and Haas Co.
/-/https/img.youtube.com/vi/wFXu2gcvCvE/0.jpg)
/-/https/img.youtube.com/vi/0KjnJYoIqPA/0.jpg)
/-/https/img.youtube.com/vi/Rimc2yc6oT0/0.jpg)