Try Google's Science Journal App with Five STEM Activities for the Classroom
With the free Science Journal app, students can start measuring and gathering data right away. We have suggestions for classroom-based icebreaker activities to help you and your students get started using the app!
Note: The Google Science Journal app is no longer available. Projects and Lesson Plans at Science Buddies that used the app have been revised to use other sensor apps for mobile devices that have similar functionality. The information below may still be valuable as a starting point for working with sensor-based apps, but please refer to your app for specific information about accessing and using sensor tools.
Google's free Science Journal app (for iOS or Android) gives students a full set of measuring and note taking tools for their STEM projects and everyday explorations.
If you are curious about Google's Science Journal app but not sure where to get started, we have suggestions! The Science Journal app is designed to be friendly and easy to use. Students can open the app, select a sensor, and immediately start watching data flow across the screen. As they watch how data readings change in response to changes in the environment (or in how they hold or move the phone), they may ask new questions and find new ways to experiment with the app and its sensors. The range of sensors available for use in the Science Journal app opens up a world of possible exploration.
Before you take the Science Journal app into the classroom, you will want to spend some time trying the app. We think you will be surprised by how easy it is to use Science Journal!
Here are suggestions for five things you and your students can do to try the Science Journal app and to start using it right away to explore science and the world around you.
For more information about how to navigate the Science Journal app and how to open a sensor, take snapshot readings, and make recordings, see Get Started with a Sensor App.
Try these Five Exercises
1. How Bright is Your Classroom?
Use the light sensor to compare the intensity of light in different locations. How bright is your classroom compared to locations like the school library, cafeteria, gymnasium, auditorium, hallway, and outside? Have your students make guesses as to how these locations rank in terms of light, and then put it to the test! Open the light sensor and take "snapshot" (single) readings in varying locations. Be sure that students stop and add a "caption" for each snapshot so that it is easier to identify the source of the data later. (You can try this in advance wherever you are. Just walk to different areas, in your house, for example, and take snapshots to compare light intensity.)
Important: Keep in mind that Science Journal on iOS and Android measure "light" differently (EV on iOS and lux on Android). You will only be able to directly compare data from devices that are using the same unit of measurement.
The image below shows some sample snapshots of light readings taken in various locations or at different times of day. These snapshots were taken on an iOS device.
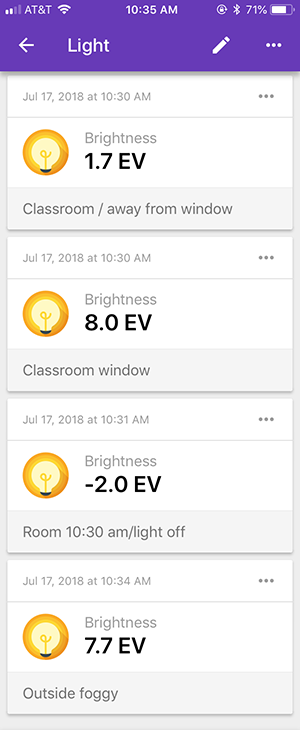
A screenshot of four snapshots from a brightness sensor card in the Google Science Journal app experiment feed. The snapshots show values from four different locations. From top-to-bottom the snapshots are: Classroom/away from window (1.7 EV), Classroom window (8.0 EV), Room 10:30 am/light off (-2.0 EV), and Outside foggy (7.7 EV).
2. How Loud is that Noise?
Use the sound sensor to measure the intensity (or loudness) of sounds. Set the device in a fixed location and open the sound sensor and begin a recording. Try clapping near the device softly and then loudly. Try clapping with different parts of your hand. Can you figure out what kind of clap generates the highest peak on the graph? What happens when you clap faster or more slowly? You can try this same experiment with whistling or snapping, too!
The screenshot below shows a sample graph recording the sound intensity of clapping, as described above.
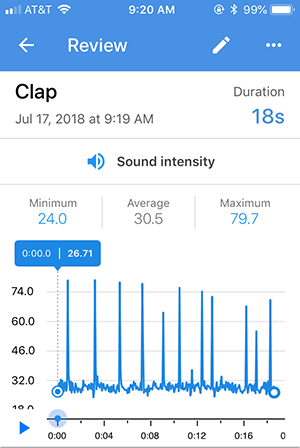
A screenshot of claps recorded on a sound intensity sensor card in the Google Science Journal app. Large spikes in the graph appear when the claps occur and vary in height and distance apart.
3. How Loud is Your Classroom?
Use the sound sensor to compare different sources of noise in your classroom. Set the device in a fixed location, open the sound sensor, and start a recording. Monitor for a few seconds to get a sense of the baseline level of ambient noise in the room. See how this changes when individual students ask questions from their seats. Does it matter where they are in the room in relation to the device? How does the baseline noise level change if each student whispers to the student next to them? How does the noise level change if all students talk softly? What happens if they all talk in a regular voice? If you are feeling adventurous, you can go even louder!
Tip: Keep in mind that sound intensity is measured in decibels (dB), which is a logarithmic scale. (This means that for every increase of 10 dB, the sound intensity doubles.) This is a great time to talk with students about these concepts. Where does your classroom noise fit on the decibel scale?
The screenshot below shows a sample graph of changes in sound intensity in a room with only a few students talking or whispering as described above. You might challenge your students to see how low they can make the graph by being as quiet as possible!
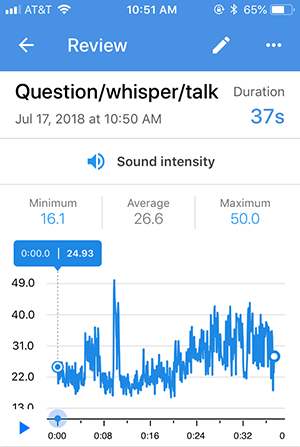
A screenshot of a classroom recorded on a sound intensity sensor card in the Google Science Journal app. The graph fluctuates in height based on the volume of the classroom.
4. How High (or Low) Can Your Voice Go?
Use the pitch sensor to explore the range of your voice or of your students' voices. With the pitch sensor open, you can sing up or down the scale (singing "la, la, la," or "do, re, mi" for example) and watch the pitch change on the graph in the Science Journal app. How high (or low) can you go? Try this, one at a time, with several people. What deductions can your students make about vocal pitch after looking at graphs recorded from different students?
Tip: Make sure students understand that it is important to look at the y-axis values when interpreting the graphs. The Science Journal app registers pitch in hertz (Hz). The graphs below show very different pitch ranges although the graphs themselves look similar. (In the app, the graphs have an auto-zoom feature, so when you view a graph, the Y-axis might not start at zero.)
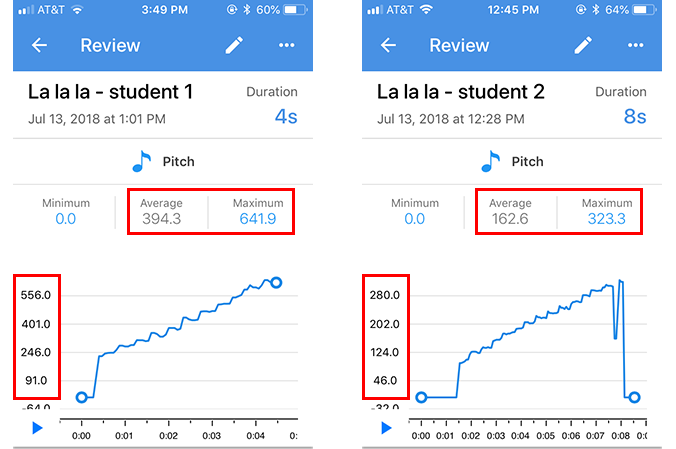
Two screenshots show recordings of students singing on a pitch sensor card in the Google Science Journal app. The graph on the left shows a very high pitch that averages 394.2 Hz and has a maximum of 641.9 Hz. The graph on the right shows a very low pitch that averages 162.6 Hz and has a maximum of 323.3 Hz.
5. What Science Can You See While Erasing the Board?
You may not use the chalkboard as much today as you did in the past, but if you have a chalkboard in your room, you can use the motion of "erasing" to experiment with the accelerometer in the Science Journal app and explore acceleration. You only need to use the chalkboard as a "guide" for this activity (not putting the phone against the surface of the board), or you can put a cloth between the phone and the chalkboard to protect the device. (You can also do this against an empty wall instead of a chalkboard.) Open the Accelerometer X sensor and start a recording. Holding the phone against the chalkboard (or parallel to it if you don't want to touch the board) with the screen facing you, slide the phone in sweeping motions as you would to erase a full sentence or paragraph written on the board. Be careful not to let the phone slip from your hand as you use the phone as a pretend eraser and slide it back and forth. After "erasing" for a bit, stop the recording and examine the graph. What was the maximum acceleration? As students experiment, have them try large arcing movements and smaller back-and-forth or circular movements as well as "erase" at varying speeds. (Bonus: if you use a cloth under the phone, you'll end up with a clean chalkboard at the end of this!)
Note: Eager students might suggest you strap a phone to the back of an eraser for an even more realistic simulation. If you do, just be very careful to secure the phone firmly in all directions so that it doesn't fall out. In all versions of this activity, students need to be careful not to lose hold of the phone, especially if they are trying to "erase" very quickly to see if they can reach higher acceleration levels.
The screenshot below is a sample graph from this kind of "erase the board" movement using the Accelerometer X sensor. What can your students determine just from looking at the graph about how the board was "erased" during this activity?
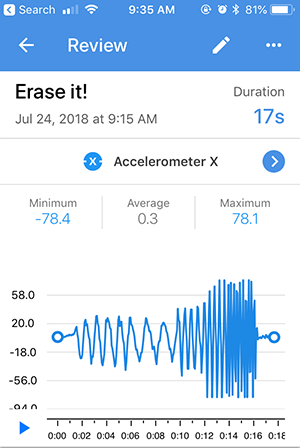
A screenshot of an erasers acceleration recorded on an accelerometer X sensor card in the Google Science Journal app. The graph fluctuates evenly between positive and negative values based on the speed of the erasers movement back and forth.
For added exploration, try this activity with the Linear accelerometer, too. (You can record using both sensors at the same time by simply opening a sensor card for each before you start the recording.) What other kinds of movements can your students think of that may have repeating motions they could record and explore? For more information about using the accelerometers in the Science Journal app, see Exploring Acceleration with a Sensor App.
Use the Science Journal App with Your Students
As you can see, the Science Journal app makes it possible to choose a sensor, start recording, and explore the world around you and see science concepts in action. With the app installed on their devices, you can do activities like the ones described above with students. Science Buddies also has independent project ideas for students that work with the app as well as free Lesson Plans for educators that take advantage of the app as part of in-class exploration.
Our tutorial series for Google's Science Journal app is a series of guided walkthroughs developed specifically for students to help them learn to use the app. We encourage educators to have students bookmark the tutorials page—or use Google Classroom to assign the page. We recommend that all students using the app read posts 1 and 2. Additional posts are available to help students who will be using specific sensors for their projects.
- Get Started with a Sensor App (#1)
- Sensor Savvy with a Mobile Phone App (#2)
- View all posts in the Science Journal app tutorial series
- Science Buddies and Google's Science Journal App (resource for educators)
- Video: Fun Chemistry with Google's Science Journal app
- Video: Fun Physics with Google's Science Journal app
- Science Buddies Project Ideas that use the Science Journal app
Download the App to Get Started!
The Google Science Journal app is no longer available. Download links have been removed.
Note: blackboard image created by Science Buddies uses a background image from FreePik.com.

Try the Science Journal app! Five STEM activities you can do with students in the classroom.
Categories:
You Might Also Enjoy These Related Posts:
- Teachers Develop Exciting New Lessons with Us for Science Journal
- Your Science Project Data Wherever You Are
- Exploring Pitch with a Sensor App
- Try Google's Science Journal App with Six Activities for Chemistry Exploration
- Try Google's Science Journal App with Five Activities for Physics Exploration
- Try Google's Science Journal App with Five STEM Activities for the Classroom
- Exploring Acceleration with a Sensor App
- Learn to Use Google's Science Journal App