Get Started with a Sensor App
Google's free Science Journal app brings a powerful set of science measuring tools to student devices. Get to know the app and start using it today for STEM experiments.
Get Started using Google's Science Journal app for K-12 STEM! www.sciencebuddies.org
Note: The Google Science Journal app is no longer available. Projects and Lesson Plans at Science Buddies that used the app have been revised to use other sensor apps for mobile devices that have similar functionality. The information below may still be valuable as a starting point for working with sensor-based apps, but please refer to your app for specific information about accessing and using sensor tools.
Google's Science Journal App
Google's free Science Journal app gives students access to a robust science toolbox for making observations and collecting sensor-based data as part of their experiments. Using sensors that are standard on many smartphones and mobile devices, students can use the app to collect real-time data as part of their hands-on science exploration. The app is available for both iOS and Android.
Science Buddies is proud to be developing activities, projects, and classroom lesson plans, in partnership with Google, that use the Science Journal app.
In this series of posts, we will walk through how to use the app and how to use the app to experiment with different sensors used in Science Buddies' projects and classroom activities. You can use these how-to articles as a general introduction to the Science Journal app or as a supplemental resource when working on a science experiment using the app.
Teachers: If you will be doing an in-class activity using the Science Journal app, you can assign tutorial posts to students in advance as introductory reading material. Google Classroom teachers can make assignments using the "Create Assignment" button at the top of the page.
In this first post, we want to familiarize users with the layout of the app, the parts of an experiment, and the tools for observation.
Get to Know the Science Journal App
When you open the Science Journal app for the first time, you will see a screen like the one shown below on the left. An experiment (or project) is represented by a block (with a photo or with a default colored icon) on the home screen in the app. When you are ready to start a project, you will create a new experiment in the app. All observations you make for an experiment, including recorded data, notes, and pictures, will be saved as part of the experiment. If you have created experiments before, you will see your prior experiments on the main screen, as shown in the image below on the right. Experiments are displayed in reverse chronological order based on the date of the last edit and organized by month. The experiment edited most recently shows up first.
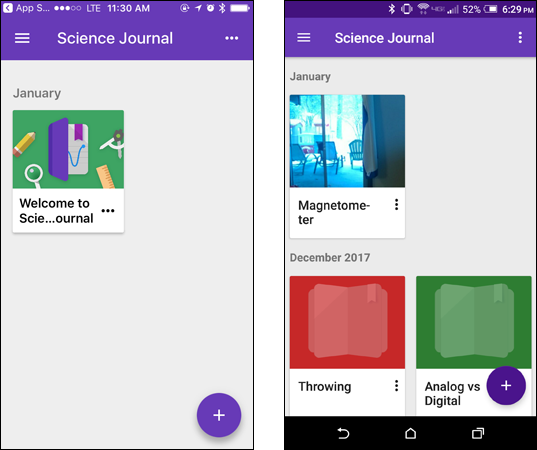
Two screenshots of the Google Science Journal app show the homepage of the app empty on the left, and filled with previous experiments on the right. Experiments are shown as blocks with titles and thumbnails, and are organized by date.
Note regarding iOS and Android: In the image above, the screenshot on the left is from an iOS device; the screenshot on the right is from an Android device. The interface of Google's Science Journal app is similar on each platform, but you will notice small differences like the three-dot menu in the top right corner being horizontal on iOS and vertical on Android. (If your screen looks different than a screen shown in this guide, note that it may be a difference in how the app appears on your device.) In this guide, we show some screenshots from iOS and some from Android and note important differences in the functionality or appearance between iOS and Android. (Updates to the app may also result in changes in appearance.)
Create an Experiment
To begin (or add) an experiment, tap the + icon (purple circle) at the bottom right of the home screen.
A blank experiment will open, as shown below. You can tap the pencil icon at the top to title your experiment. Type in the title and tap the check mark in the top right corner to save it. (Note: If you do not enter a title, you will be prompted to name the experiment the first time you exit the experiment.)
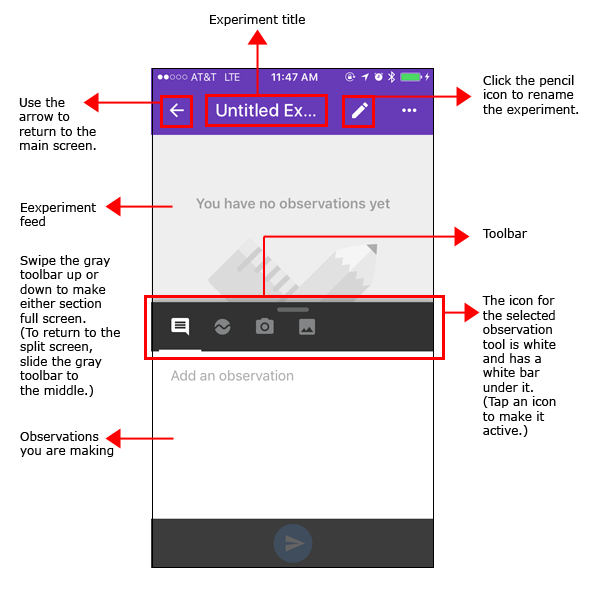
A screenshot shows a new experiment opened in the Google Science Journal app. At the top of the page there is an arrow to return to the main screen, an experiment title and a pencil icon to rename the experiment. A gray toolbar in the middle of the screen separates areas for observation notes and the experiment feed, and contains icons for different tools.
As shown in the image above, there are two sections on the experiment screen (when you are viewing in split screen mode): the experiment feed and the observations you are making.
The experiment feed appears at the top and includes all of the observations you have made as part of the experiment. In the Science Journal app, all additions to an experiment are called observations. This includes notes, measurements, data recorded using the app, photos, and attachments. When you make or add an observation, it is automatically saved to the experiment feed with the time and date. The experiment feed is arranged in chronological order from oldest (top) to newest. As your experiment feed grows during a project, you will need to scroll to see all of the observations you have made.
Observations you are making appear at the bottom. What you see in this section depends on the observational tool being used. (These tools are covered in more detail below.)
These sections are divided by a gray toolbar that has four icons for observation tools. Either section can be expanded to full screen by sliding the gray toolbar up or down. (Try it: Put your finger on the grey toolbar and slide up to make the "Add an observation" box take up the full screen. To return to the split screen, put your finger on the gray toolbar at the top and slide down, stopping in the middle for split screen or sliding all the way to the bottom to make the experiment feed occupy the full screen.)
Add an Observation
Observations are at the heart of the Science Journal app. By making observations, you gather and record data and notes about your experiment, similar to the way you keep notes and record data in a paper-based lab notebook or science journal. With the Science Journal app, everything is stored digitally, and you have the ability to collect sensor-based data and take real-time measurements.
To add an observation, tap one of the four observation icons in the gray toolbar.
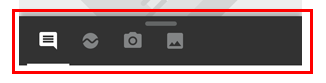
A cropped screenshot of a toolbar in the Google Science Journal app shows four icons. The icons are (from left-to-right): a chat bubble (add a note), a circle with a line through it (use a sensor), a camera (take a photo) and a photo (attach an image).
The observation tools allow you to:

 Use a sensor
 Take a photo
 Attach an image
When you perform an action using an observation tool, the observation is saved to the experiment with the time and date and will appear in chronological order in the experiment feed.
Note: The observation tool currently selected is white and has a horizontal white bar below it. (In the toolbar image above, the "note" observation tool is currently selected.)
Tip: If you have the experiment feed window fully open, you can immediately open any of the tools to add an observation by tapping an observation icon on the gray toolbar.
Add a Note
To add a note to the experiment, tap the note icon on the gray toolbar. Tap in the "Add an observation" box to activate the keyboard and type your note. When finished, tap the blue arrow to save the note.
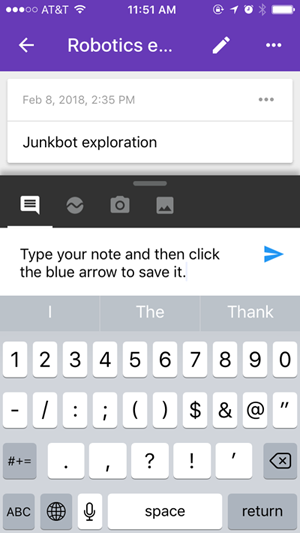
A screenshot of a note being added to an experiment in the Google Science Journal app. A blue arrow appears to the right of a typed note to save it to the experiment.
Once you save a note, the note appears in the experiment feed. Tap a note to open it and make edits or additions. (Note: Editing a note does not change the time and date stamp or record the date of the edit.) You can delete a note by tapping the three-dot menu next to the note in the experiment feed and then tapping "Delete." (On iOS, you can also delete a note by opening it and tapping the trashcan icon in the top right corner. On Android, tap the three-dot menu on an open note to access the delete option.)
Tip: You can add information like your hypothesis or variables as a note. You can also keep notes about your data collection, resources, materials, and any ideas you have while working on your experiment.
Use a Sensor
To use a sensor, tap the sensor icon (the circle with the wavy line across the middle) on the gray toolbar. Activating the sensor tool opens a sensor card with a set of colored bars and a graph showing data for the selected sensor, as shown below. The top colored bar of a sensor card shows the title of the selected sensor. The second colored bar is a horizontal list of available sensors. (You can hide or reveal this bar by tapping the arrow next to the sensor title.) Scroll the sensor bar horizontally to find the sensor you need. Tap any sensor to activate it.
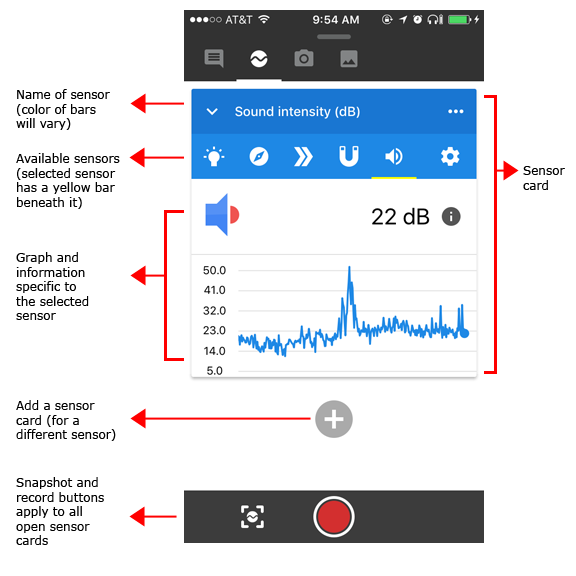
A screenshot of a sound intensity sensor card in the Google Science Journal app. The sensor card is labeled and shows the name of the sensor at the top. Below the name are icons to switch between sensors and below that is a graph for the sensor (measured in decibels). A gray plus sign beneath the sensor card allows additional sensor cards to be added and a bar at the bottom of the screen has buttons to take a snapshot and to record the sensor data.
Note: In the example above, the bars of the sensor card are blue. Additional sensor cards will use different colors.
Tip: Only one sensor card can be opened for a specific sensor at a time. If you add an additional card, the bar showing available sensors will show only sensors that your phone or device has and that are not already in use.
The following image shows some of the sensors that may be available on your phone or device:
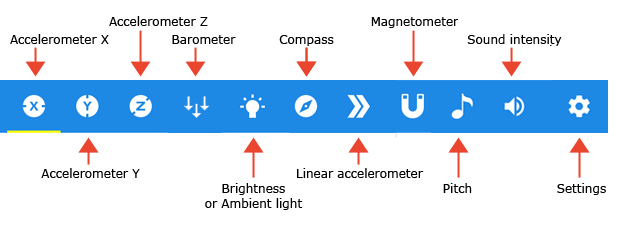
A cropped screenshot of the sensor card icons with labels in the Google Science Journal app. From left-to-right the sensors are pictured and labeled: circle with an X (accelerometer X), circle with a Y (accelerometer Y, circle with a Z (accelerometer Z), three downward arrows (barometer), a lightbulb (brightness or ambient light), a compass (compass), two right facing arrows (linear accelerometer), a U-shaped magnet (magnetometer), a musical note (pitch), a speaker (sound intensity) and a gear (settings).
(Note: Not all phones and devices will have all supported sensors. Sensor icons may not all be visible at one time, and the order of the sensors may vary by device. You may need to scroll to find the sensor you need. In the image above, the sensor marked with a yellow line underneath it is the currently selected sensor.)
The sensors:
- Accelerometer X: the acceleration of the phone to the left and right in meters per second squared (m/s2)
- Accelerometer Y: the acceleration of the phone forward and back in meters per second squared (m/s2)
- Accelerometer Z: the acceleration of the phone up and down in meters per second squared (m/s2)
- Brightness (iOS) or Ambient light (Android): the amount of light detected by the front-facing camera, measured in Exposure Value (EV) on iOS, or by the ambient light sensor, measured in lux on Android
- Compass: the orientation of the phone compared to the Earth's magnetic field, measured in degrees
- Linear accelerometer: total acceleration of the phone, excluding gravity, in meters per second squared (m/s2)
- Magnetometer: the strength of the geomagnetic field in microtesla (μT)
- Sound intensity: the intensity of sound reaching the sound sensor or microphone, measured in decibels (dB)
- Barometer: the atmospheric pressure measured in hectopascals (hPa)
- Pitch: the pitch of the sound reaching the sound sensor or microphone, measured in hertz (Hz)
After selecting a sensor, you can take a snapshot of data at a single point in time or you can record data over time. These features are covered in more detail in the next post in this series, Sensor Savvy with a Mobile Phone App. (Subsequent posts will also cover specific use of individual sensors.)
Take a Photo
To take a photo as part of your experiment, tap the camera icon from the gray toolbar. This activates your phone or device's camera. You will see your camera either in the lower half of the split screen or full screen. The split screen view is shown below:
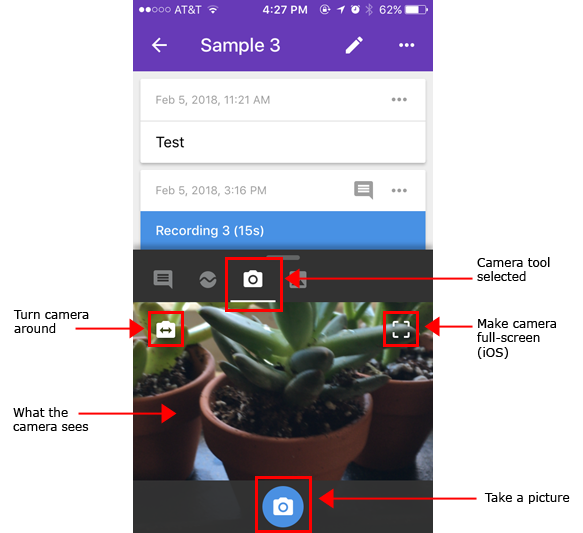
A screenshot of a photo being added to an experiment in the Google Science Journal app. A small camera viewfinder is opened in the bottom half of the Science Journal screen and buttons are available to turn the camera around or make the viewfinder fullscreen. A button to take the picture is located at the bottom of the screen.
To make the camera full screen, slide the toolbar up or or tap the small white "frame" that appears on the right side of the camera screen (iOS only). To access the camera's front-facing camera, tap the icon on the top left (of the camera screen). To take a picture, tap the blue circle with the camera in it.
When you take a photo, the photo is immediately saved to the experiment feed. You will see a thumbnail of the photo in the list with the date and time. You can add a description (or caption) to the photo, and additional information about the photo can be accessed by tapping the photo, tapping the three-dot menu, and then selecting "Info."
Tip: If you make sketches or drawings of your experiment on paper, you can take a photo to store them with your project in the Science Journal app.
Add an Image
To add an image from your photo gallery, tap the photo icon (white square with the mountains). Select an image from your photos and tap the blue circle with the white arrow to save the image as an observation. (Note: To use this feature, you will need to give Science Journal permission to access your photo library.)
To add a description or note to a photo or image, tap the observation to open it and then type the note in the "Add a description" box. Alternately, you can tap the "note" icon that appears above the photo or image in the experiment feed to add the caption. (Note: Once a caption has been added, the "note" icon goes away.) You can edit the caption by tapping the three-dot menu next to the photo or image in the experiment feed and selecting "Add Caption." (This opens the screen to edit the caption; only one caption can be added per photo or image.)
More About the Science Journal App and Sensors
In this series, we will be covering additional tips for managing and using observations and for working with individual sensors in the Science Journal app. To learn more about working with sensors and recording data, read the next post in this series, Sensor Savvy with a Mobile Phone App.
See other posts in this series and additional Science Journal app resources at Science Buddies:
- Sensor Savvy with a Mobile Phone App
- Exploring Sound Intensity with a Sensor App
- Exploring Light with a Sensor App
- Exploring Acceleration with a Sensor App
- Exploring Pitch with a Sensor App
- View all posts in this series
- Science Buddies and Google's Science Journal App (resource for educators)
- Science Buddies Project Ideas that use the Science Journal app
Download the App to Get Started!
The Google Science Journal app is no longer available. Download links have been removed.
Get Started using Google's Free Science Journal app
Categories:
You Might Also Enjoy These Related Posts:
- Teachers Develop Exciting New Lessons with Us for Science Journal
- Your Science Project Data Wherever You Are
- Exploring Pitch with a Sensor App
- Try Google's Science Journal App with Six Activities for Chemistry Exploration
- Try Google's Science Journal App with Five Activities for Physics Exploration
- Try Google's Science Journal App with Five STEM Activities for the Classroom
- Exploring Acceleration with a Sensor App
- Learn to Use Google's Science Journal App