Exploring Sound Intensity with a Sensor App
The third in our "how-to" series for using Google's Science Journal app for science class focuses on using the sound intensity sensor to record data.
Experiment with the sound intensity sensor in the Science Journal app. www.sciencebuddies.org
Note: The Google Science Journal app is no longer available. Projects and Lesson Plans at Science Buddies that used the app have been revised to use other sensor apps for mobile devices that have similar functionality. The information below may still be valuable as a starting point for working with sensor-based apps, but please refer to your app for specific information about accessing and using sensor tools.
Google's free Science Journal app lets you use sensors on your phone or mobile device (for iOS or Android) to observe and record data as part of an experiment or exploration of the world around you.
For an introduction to the Science Journal app and how to work with sensors in the app (in general), see the first two posts in this tutorial series:
In this post, learn more about using the sound intensity sensor in the Science Journal.
Understanding Sound Intensity and the Decibel Scale
Experimenting with sound intensity using the Science Journal app means experimenting using the microphone that is built into the phone or mobile device. The microphone, which allows you to be heard when you talk to someone using your device, can also be used to monitor and measure sound intensity in your environment (or as part of an experiment).
The Science Journal app measures sound intensity in decibels (dB). Decibels are a logarithmic scale, not a linear scale. This means that for every increase of 10 dB, the sound intensity (or loudness) doubles. It is important to keep this in mind when thinking about how sounds compare in intensity. For example, a chainsaw (100 dB) is much more than twice as loud as moderate rainfall (50 dB).
We hear sounds with greater intensity as "louder" than sounds with lower intensity. Keep in mind that distance (how far away you are from a sound) will have an effect on the intensity of the sound that you hear (or your device records). (In other words, a sound may be recorded as having a very high intensity when you are right next to it, but the intensity will be different if you measure it from farther away.)
(Note: Sounds also have a frequency or pitch that is measured by a separate sensor.)
Tip: For more information about sound intensity, click the "i" next to the sensor reading in the sound intensity sensor card. Along with information about sound and the decibel scale, you will find a list of some common sounds, ordered by sound intensity (low to high).
Use the Sound Intensity Sensor in an Experiment
To measure or monitor sound intensity, open the app and start an experiment (or open an existing experiment). Open the sensor tools by tapping the sensor icon on the gray toolbar and select the sound intensity icon from the colored bar showing available sensors. This will open a sound intensity sensor card.
Tip: If you need more information on how to navigate and interact with the app, read posts 1 and 2 in this tutorial series.
The image below shows a sample sound intensity sensor card. No data is being recorded, but the sensor is actively reading sound intensity. The graph on the sensor card shows the readings the sensor is making. (Note: A sensor begins reading as soon as a sensor card is opened, but the app only records data when you start a recording or take a snapshot reading.) When viewing sound intensity sensor data, the units on the y-axis are in dB. The x-axis represents time in mm:ss. (Note: The x-axis does not show on iOS until a recording begins.)
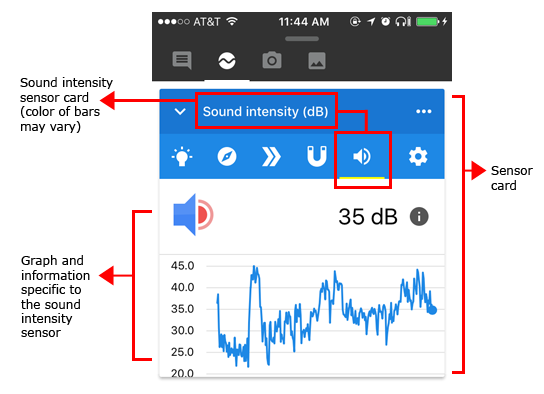
A cropped screenshot of a sound intensity sensor card in the Google Science Journal app. The sensor card is labeled and shows the name of the sensor at the top. Below the name are icons to switch between sensors and below that is a graph for the sensor (measured in decibels).
With a sound intensity sensor card open, watch the data being picked up by your device. Do you see a relatively low decibel reading? If you are in an environment with very little noise (like a library), you may see low decibel readings. Is the line on the graph flat, or does it go up and down? If you see an even line on the graph, you may be in an environment with a relatively constant level of noise (regardless of whether the decibel level is high or low). For example, an environment with constant background (or ambient) noise (like a fan running) may show a relatively even line. If you see spikes and variation on your graph, there may be more fluctuation or change in the ambient noise reaching your device. For example, you may be in a location with traffic-related noise that is constantly changing.
Find it! To use the sound intensity sensor effectively in your experiments, you need to know where the sensor is located on your phone or device. Remember that the Science Journal uses your device's microphone to measure sound intensity. On most smartphones, the primary microphone is near the bottom of the phone. (If you are unsure where your microphone is located, you may need to consult documentation about your specific device.)
With your sound intensity card open, experiment to see if covering up your microphone with your hand makes a difference on the graph. What happens if you cover the microphone with a jacket? You may find that there is very little change in the sound intensity readings when you cover or uncover the microphone. However, when using the sound intensity sensor in Science Journal for an experiment, you will want to keep in mind the location of the sensor and make sure the microphone isn't obstructed. For example, if you want to walk around and take recordings in different places, don't do it with the phone or device in your pocket. You also want to keep the orientation of the phone consistent relative to what you want to measure. If you point the top of the phone at one source of sound, you want to point the same part of the phone at any other sources of sound you are testing or recording during your trials.
Try the Sound Intensity Sensor
To see the sound intensity sensor in action in Science Journal, try the following simple activity. As you watch the sound intensity sensor graph, clap your hands near the device. Do you see a spike on the graph? Wait a few seconds, and clap again. Wait a few seconds, and repeat. Unless you are in a very noisy environment, you should see clear spikes on the graph that correspond to your claps. Experiment with your claps to see how they show on the graph and how clapping more loudly or more quietly changes what shows on the graph.
The screenshot below shows periodic claps being recorded in the Science Journal app. (Note: You can tell the sensor is recording because data being recorded has a light red background.)
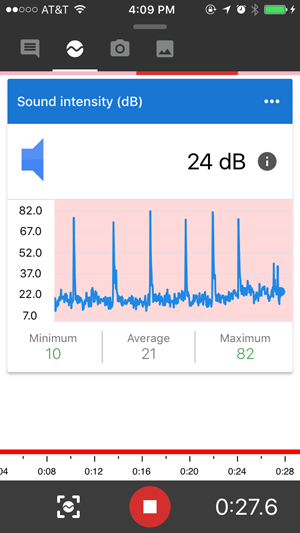
A screenshot of an active recording for a sound intensity sensor card in the Google Science Journal app. The sensor card is labeled and shows the name of the sensor at the top. A red section, showing what is being recorded, is outlined on the graph for the sensor (measured in decibels). Minimum, average and maximum values of the recorded section appear beneath the graph. There is also a timeline and timer at the bottom of the screen to keep track of the time of the recordings.
Looking at the graph in the image above, do you think the claps were similar in loudness?
Recording Sound Intensity Sensor Data
Using the Science Journal app, you can take snapshots of sound intensity readings or record sound intensity data over time. (Note: These steps are explained in more detail in this post.)
The image below shows how snapshots and recordings from the sound intensity sensor appear in the Science Journal experiment feed. Tapping a snapshot or a recording opens the observation so that you can view additional details (or access additional features like Crop and Share for recordings).
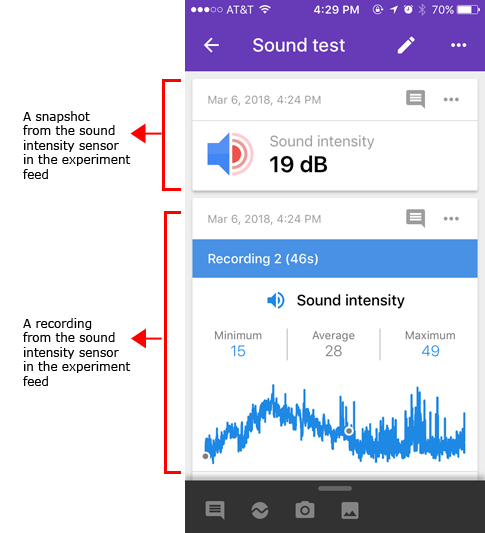
A screenshot of a snapshot and recording taken from a sound intensity sensor card in the Google Science Journal app experiment feed. The snapshot shows a single value (21 dB in this example), label for the sensor card and a date and time. The recording shows a graph of the recording, the recording title, date and time, label for the sensor card and minimum, average and maximum values of the graph.
Reviewing a Recording
When you open a recording from the experiment feed, you can review the graph in more detail. A sample recording from the sound intensity sensor is shown below.
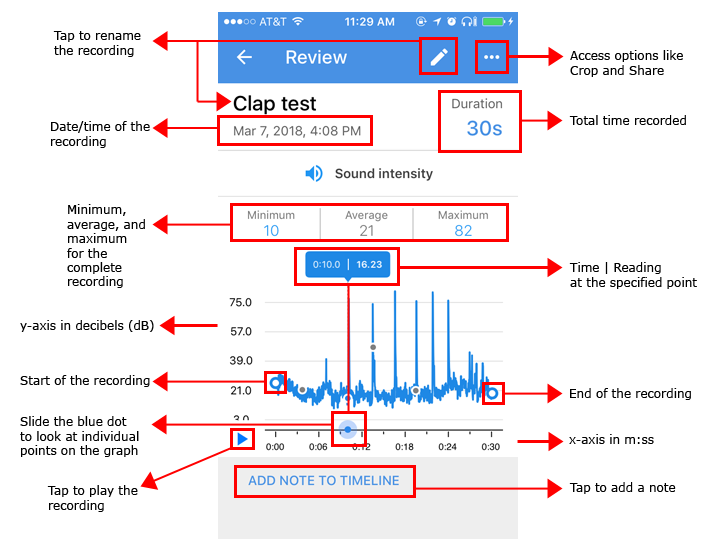
A screenshot of a recording review for a sound intensity sensor card in the Google Science Journal app. A pencil at the top of the screen allows the user to rename the recording. A menu (three dots in the top-right of the screen) can be pressed to access additional tools such as cropping and sharing. The review shows the recording title, duration, date and time, and the type of sensor card used to record at the top of the screen. Below that is a graph of the recorded data with minimum, average and maximum values shown above the graph, and a marker on the graph that shows data points at specific times on the graph. A play button and link to add a note to the timeline are located on the bottom of the screen.
Before using your data, you may need to crop your graph to remove additional noise at the beginning or end. For example, you may need to remove noise that occurred while handling your device. Be careful! There is currently no way to undo a crop. Crop and Share (export) options can be accessed by tapping the three-dot menu in the top corner of the recording.
(Information about reviewing a recording and working with crop and share options is covered in more detail in this post.)
Experiment with the Sound Sensor
The following projects at Science Buddies use the sound sensor.
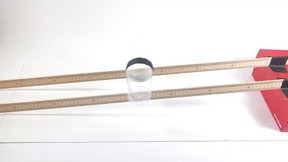
- Can You Hear Sounds in Outer Space?: experiment with a buzzer in a vacuum to simulate conditions in outer space. Use the Science Journal app to measure sound intensity and gather data during the experiment.
- Plop, Plop, Fizz Fast: The Effect of Temperature on Reaction Time: Alka-Seltzer® tablets fizz when they are dropped into water because of a chemical reaction that occurs. The temperature of the water can make a difference in the rate of the chemical reaction. Use the Science Journal app to measure the sound intensity (and duration) of the fizzing in this experiment.
- Heart Health: How Does Heart Rate Change with Exercise?: experiment to find out how different activities compare when it comes to elevating your heart rate. Use your voice to "speak" in time with your pulse and use the Science Journal app to visualize your heart rate after different kinds of activities.
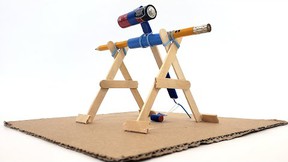
- Measure the Frequency Response of a Paper Speaker: build speakers out of paper and experiment to find out how the number of magnets affects the loudness of the speaker. Use the Science Journal app to record sound intensity data in the experiment as you compare loudness with different numbers of magnets..
- Extreme Sounds: Lessons in a Noisy World: use the Science Journal app to compare noise levels in different settings and locations.
- How to Make a Piano Sing: experiment to find out how to make piano strings sing using sympathetic vibrations. Use the Science Journal app to measure sound intensity and find out which combination of notes creates the longest vibrations.
More to Come
In the next post in this tutorial series, we will look more closely at the light sensor in the Science Journal app and Science Buddies projects that use the light sensor.
See other posts in this series and additional Science Journal app resources at Science Buddies:
- Get Started with Google's Science Journal App
- Sensor Savvy with a Mobile Phone App
- Exploring Light with a Sensor App
- Exploring Acceleration with a Sensor App
- Exploring Pitch with a Sensor App
- View all posts in this series
- Science Buddies and Google's Science Journal App (resource for educators)
- Science Buddies Project Ideas that use the Science Journal app
Download the App to Get Started!
The Google Science Journal app is no longer available. Download links have been removed.
Sound intensity and the Science Journal app
Categories:
You Might Also Enjoy These Related Posts:
- Teachers Develop Exciting New Lessons with Us for Science Journal
- Your Science Project Data Wherever You Are
- Exploring Pitch with a Sensor App
- Try Google's Science Journal App with Six Activities for Chemistry Exploration
- Try Google's Science Journal App with Five Activities for Physics Exploration
- Try Google's Science Journal App with Five STEM Activities for the Classroom
- Exploring Acceleration with a Sensor App
- Learn to Use Google's Science Journal App