Exploring Light with a Sensor App
The fourth in our "how-to" series for using Google's Science Journal app for science class focuses on using the light sensor to record data and perform experiments involving light.
Experiment with the light sensor in the Science Journal app. www.sciencebuddies.org
Note: The Google Science Journal app is no longer available. Projects and Lesson Plans at Science Buddies that used the app have been revised to use other sensor apps for mobile devices that have similar functionality. The information below may still be valuable as a starting point for working with sensor-based apps, but please refer to your app for specific information about accessing and using sensor tools.
Google's free Science Journal app lets you use sensors on your phone or mobile device (for iOS or Android) to observe and record data as part of an experiment or exploration of the world around you.
For an introduction to the Science Journal app and how to work with sensors in the app (in general), see the first two posts in this series:
In this post, learn more about using the light sensor in the Science Journal.
Measuring Light in the Science Journal App
While many of the sensors in Science Journal work similarly on Android and iOS, each platform obtains light data differently and uses a different unit of measurement. This is important to note, especially if you are working with or comparing data from more than one device.
On iOS, experiments with light measure "brightness" in EV (Exposure Value) based on the amount of light reaching the front-facing camera on the phone or mobile device. The brightness sensor measures luminance, and the EV value is based on the brightness of pixels recorded by the camera and is determined by the combination of shutter speed, f-number, and ISO value. Higher EV values correspond to increased brightness. Note: EV readings can be negative.
On Android, experiments with light measure "ambient light" in lux (the amount of luminous flux per unit area). Luminous flux depends upon the amount of incoming light and the area over which it is spread. Note: Lux readings are always positive.
Tip: For more information about measuring light using EV (iOS) or lux (Android), click the "i" next to the sensor reading on the brightness or ambient light sensor card in the app.
Using the "Light" Sensor
To measure or monitor light, open the Science Journal app and start an experiment (or open an existing experiment). Open the sensor tools by tapping the sensor icon on the gray toolbar and select the lightbulb icon from the colored bar showing available sensors. This will open a brightness (iOS) or ambient light (Android) sensor card.
Tip: If you need more information on how to navigate and interact with the Science Journal app, read posts 1 and 2.
The images below show sample brightness (top) and ambient light (bottom) sensor cards. No data is being recorded in these examples. The graph on each card shows the readings the sensor is making in the units used by the app on that platform. (Note: A sensor begins reading as soon as a sensor card is opened, but the app only records data when you start a recording or take a snapshot reading.) When viewing light sensor data, the units on the y-axis are in EV (iOS) or lux (Android). The x-axis represents time in mm:ss. (Note: Keep in mind that the x-axis does not show on iOS until a recording begins.)
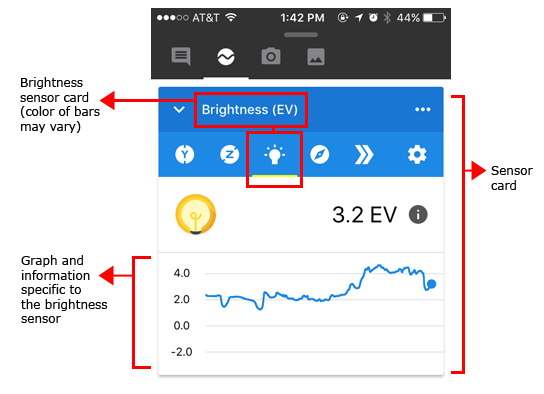
A cropped screenshot of a brightness sensor card in the Google Science Journal app. The sensor card is labeled and shows the name of the sensor at the top. Below the name are icons to switch between sensors and below that is a graph for the sensor (measured in EV or exposure value).
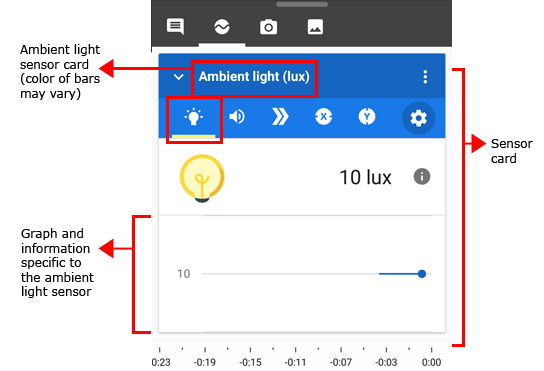
A cropped screenshot of an ambient light sensor card in the Google Science Journal app. The sensor card is labeled and shows the name of the sensor at the top. Below the name are icons to switch between sensors and below that is a graph for the sensor (measured in lux).
Find it! To use the light sensor effectively in your experiments, you need to know where the sensor is located on your phone or device. On both Android and iOS, the light sensor is on the front of the device (the part that faces you). On iOS, the brightness sensor is the front-facing camera. On Android, the ambient light sensor is typically near the front-facing camera. (Note: If you are unable to locate the light sensor, consult the documentation for your device.)
With a light sensor card open, cover the light sensor area with your finger. Do you see a change in the graph? If not, move your finger around until you locate the sensor. When you cover the sensor with your finger, you will see the readings decrease (on iOS, you may even see negative readings). When you uncover the sensor, the readings will increase. When using the light sensor for an experiment, you will want to keep in mind the location of the sensor so that you can position the sensor effectively in relation to the light source being measured. You also want to be careful to make sure the sensor is not blocked or covered.
Try the Light Sensor
To see the light sensor in action, try the following simple activity. As you watch the light sensor graph, cover the light sensor with your finger (as you did before when locating the sensor). Do you see a decrease in the light reading on the graph? Wait a second, and then uncover the sensor. Wait a few seconds, and repeat. After doing this a few times, you should be able to identify the high and low points on the graph and how these correspond to the change in light being read by the sensor.
Tip: When you cover the sensor with your finger, you may also notice that the lightbulb icon on the light sensor card dims and then brightens again when you remove your finger!
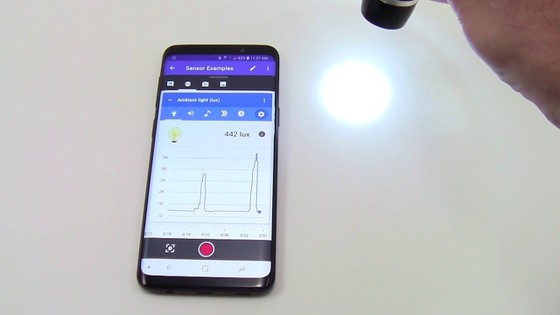
The screenshot below shows data being recorded using the brightness sensor (iOS). You can tell the app is actively recording because the graph has a light red background, indicating data being recorded. A recording using the ambient light sensor on Android would appear similar.
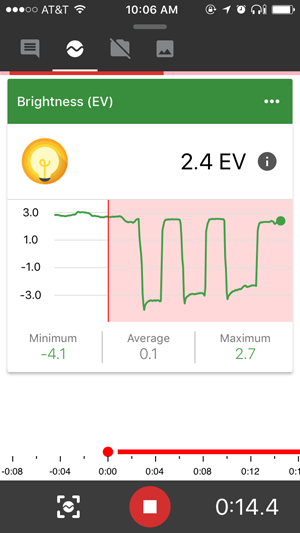
A screenshot of an active recording for a brightness sensor card in the Google Science Journal app. The sensor card is labeled and shows the name of the sensor at the top. A red section, showing what is being recorded, is outlined on the graph for the sensor (measured in EV). Minimum, average and maximum values of the recorded section appear beneath the graph. There is also a timeline and timer at the bottom of the screen to keep track of the time of the recordings.
(Note: Keep in mind that the color of the bars will vary in the app based on how many sensor cards are open.)
The screenshot below shows data that was recorded in the Science Journal app using the brightness sensor (left) and ambient light sensor (right). While the units differ between platforms, you can see the clear pattern recorded by each type of light sensor when the sensor was covered and uncovered.
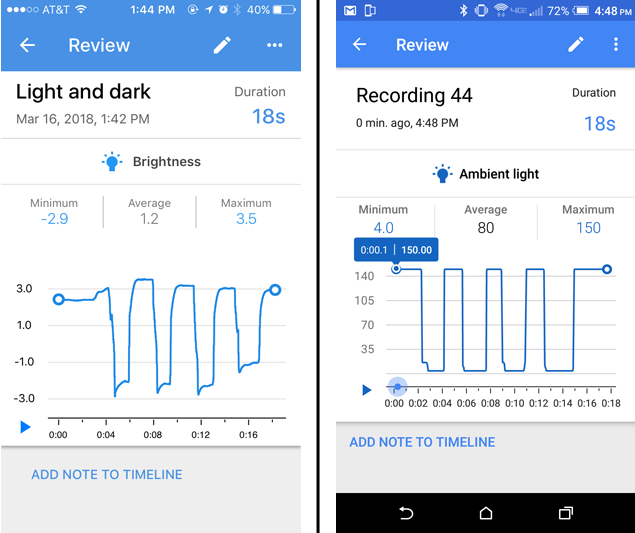
Two screenshots show a recording review for a brightness and ambient light sensor card in the Google Science Journal app. Both graphs record data from when a sensor is covered and uncovered and show very similar patterns between the two graphs.
Recording Light Sensor Data
Using the Science Journal app, you can take snapshots of light sensor readings or record light sensor data over time. (Note: These steps are explained in more detail in this post.)
The image below shows how snapshots and recordings from the brightness sensor appear in the experiment feed. Tapping a snapshot or a recording opens the observation so that you can view additional details (or access additional features like Crop and Share for recordings). (Note: Snapshots and recordings will appear similar in the experiment feed on Android, but the sensor will be the ambient light sensor.)
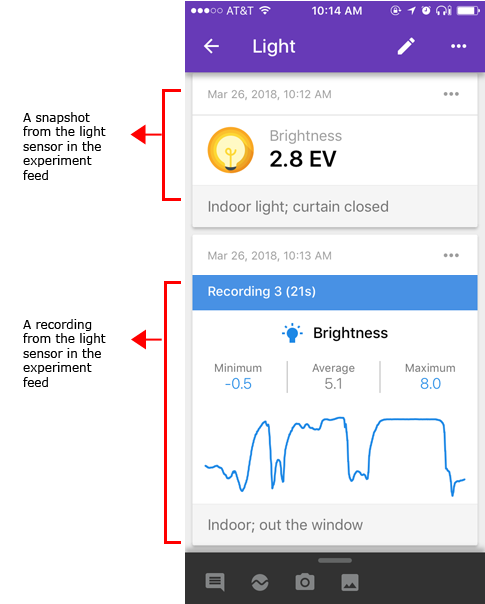
A screenshot of a snapshot and recording taken from a brightness sensor card in the Google Science Journal app experiment feed. The snapshot shows a single value (2.8 EV in this example), label for the sensor card and a date and time. The recording shows a graph of the recording, the recording title, date and time, label for the sensor card and minimum, average and maximum values of the graph.
Reviewing a Recording
When you open a recording from the experiment feed, you can review the graph in more detail. A sample recording from the brightness sensor is shown below.
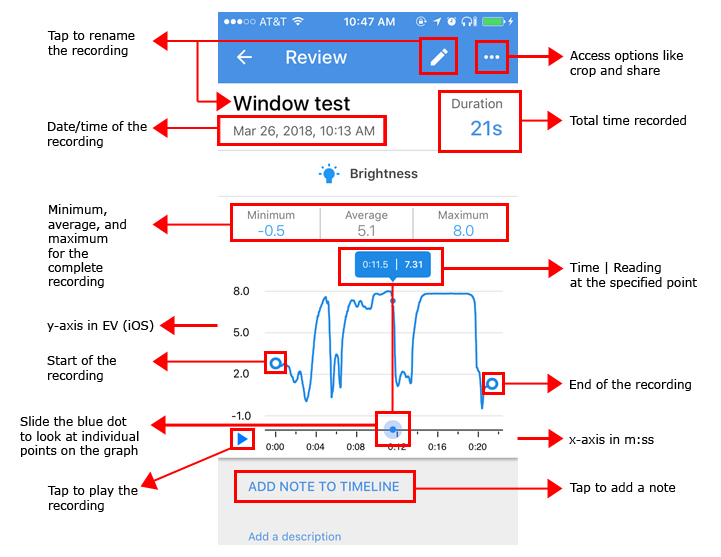
A screenshot of a recording review for a brightness sensor card in the Google Science Journal app. A pencil at the top of the screen allows the user to rename the recording. A menu (three dots in the top-right of the screen) can be pressed to access additional tools such as cropping and sharing. The review shows the recording title, duration, date and time, and the type of sensor card used to record at the top of the screen. Below that is a graph of the recorded data with minimum, average and maximum values shown above the graph and a marker on the graph that shows data points at specific times on the graph. A play button and link to add a note to the timeline are located on the bottom of the screen.
Before using your data, you may need to crop your graph to remove data at the beginning or end that occurred while handling your device. You can crop your graph to remove information, but be careful. There is currently no way to undo a crop. Crop and Share options can be accessed by tapping the three-dot menu in the top corner of the recording.
(Information about reviewing a recording and working with crop and share options is covered in more detail in this post.)
Experiment with the Light Sensor
The following projects at Science Buddies use the light sensor.
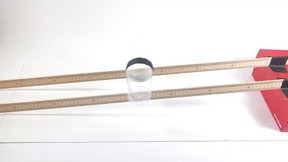
- Balloon-Powered Car Challenge: Design a balloon-powered car and use the light sensor in Science Journal to test its speed.
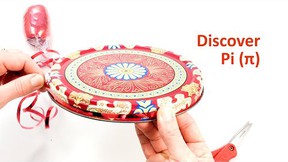
- Take a Candle Carousel for a Spin: Explore the relationship between the number of lit candles used in a candle carousel and how fast the carousel spins. Use the light sensor in the Science Journal app to record the rotations of the candle carousel.
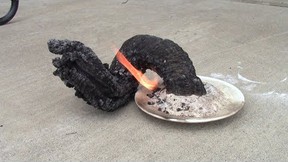
- Effects of Exercise: Changes in Carbon Dioxide Output: How does your carbon dioxide output change after exercise? Use your breath, a colorimetric pH test, and the light sensor in the Science Journal to find out!
- Hacking the Air Gap: Stealing Data from a Computer that isn't Connected to the Internet: Investigate how a computer that is not connected to the Internet or to other computers can still be hacked by transmitting data using light, sound, vibration, or heat.
- Investigate the Kinetics of the Color Changing Iodine Clock Reaction: Investigate how the concentration of hydrogen peroxide affects the rate of the iodine clock reaction and use the light sensor in the Science Journal app to record the color change.
- Measuring the Amount of Acid in Vinegar by Titration with an Indicator Solution: Determine the amount of acid in different types of vinegar using titration and a colored pH indicator. Use the light sensor in the Science Journal app to measure the titration curve.
- Minds of Their Own: A Chemical Reaction that Changes, then Changes Back!: Explore an oscillating chemical reaction and use the light sensor to record the color change cycle.
- Star light, Star bright: How Does Light Intensity Change with Distance?: Experiment with a light source to see if it light from it follows the inverse-square law.
More to Come
In the next post in this tutorial series, we will look more closely at the accelerometer in the Science Journal app and Science Buddies projects that use the accelerometer.See other posts in this series and additional Science Journal app resources at Science Buddies:
- Get Started with a Sensor App
- Sensor Savvy with a Mobile Phone App
- Exploring Sound Intensity with a Sensor App
- Exploring Acceleration with a Sensor App
- Exploring Pitch with a Sensor App
- View all posts in this series
- Science Buddies and Google's Science Journal App (resource for educators)
- Science Buddies Project Ideas that use the Science Journal app
Download the App to Get Started!
The Google Science Journal app is no longer available. Download links have been removed.
Experiment with the light sensor in Science Journal
Categories:
You Might Also Enjoy These Related Posts:
- Teachers Develop Exciting New Lessons with Us for Science Journal
- Your Science Project Data Wherever You Are
- Exploring Pitch with a Sensor App
- Try Google's Science Journal App with Six Activities for Chemistry Exploration
- Try Google's Science Journal App with Five Activities for Physics Exploration
- Try Google's Science Journal App with Five STEM Activities for the Classroom
- Exploring Acceleration with a Sensor App
- Learn to Use Google's Science Journal App