Exploring Acceleration with a Sensor App
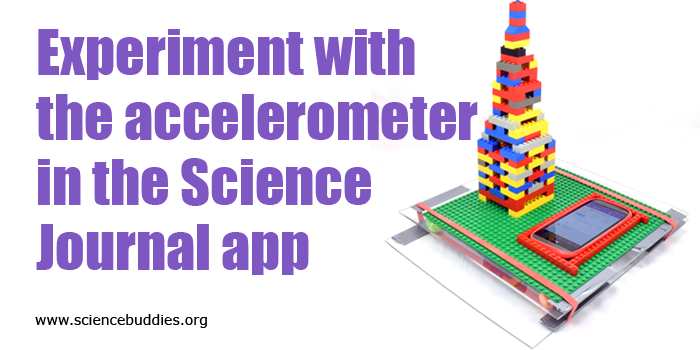
Experiment with the accelerometer in the Science Journal app. www.sciencebuddies.org
Note: The Google Science Journal app is no longer available. Projects and Lesson Plans at Science Buddies that used the app have been revised to use other sensor apps for mobile devices that have similar functionality. The information below may still be valuable as a starting point for working with sensor-based apps, but please refer to your app for specific information about accessing and using sensor tools.
Google's free Science Journal app lets you use sensors on your phone or mobile device (for iOS or Android) to observe and record data as part of an experiment or exploration of the world around you.
For an introduction to the Science Journal app and how to work with sensors in the app, see other posts in this series:
In this post, learn more about using the accelerometer in the Science Journal app.
Measuring Acceleration in the Science Journal App
Your phone has a built-in device called an accelerometer that measures acceleration, which is the change in an object's velocity per second. Since velocity is measured in meters per second (m/s), acceleration is measured in meters per second per second, which is written as meters per second squared (m/s2). Accelerometers are used for things like motion controls in video games or to detect when you pick your phone up.
Unlike the light sensor and microphone, which each just record one value, the accelerometer on your device records acceleration in three different directions, or "axes" (orientations in space), referred to as X, Y, and Z. Even though the accelerometer is a single sensor built into your device, in the Science Journal app, there is a separate accelerometer sensor for each axis.
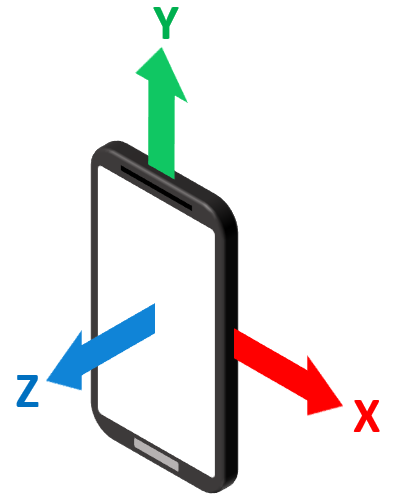
If you look in the Science Journal app along the strip of sensors, you will find Accelerometer X, Accelerometer Y, and Accelerometer Z. (There is also an accelerometer sensor called the Linear accelerometer, which will be talked about later in this tutorial.) The X, Y, and Z axes correspond to a physical direction relative to your phone's body, as shown in the diagram below.
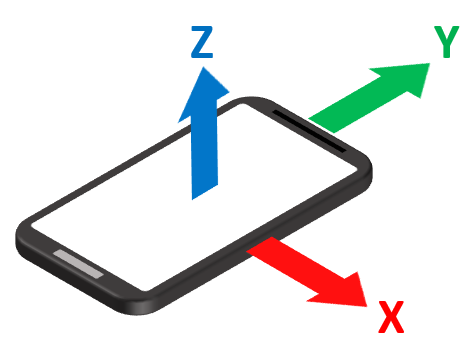
Note: It is important to keep in mind that these axes are relative to the phone's body. If you rotate your phone, the axes remain the same in relation to the phone's body. In the diagram below, the phone has been rotated 90 degrees. You can see that the Z axis, for example, is no longer "up"; instead, it remains the same in relation to the screen of the device.
Using the Accelerometer
To take measurements with the accelerometer in the Science Journal app, you first have to choose which accelerometer you will use—X, Y, Z, or Linear. Once you have decided which sensor to use, open the Science Journal app and start an experiment (or open an existing experiment). Open the sensor tools by tapping the sensor icon on the gray toolbar and select the icon for the specific accelerometer sensor (X, Y, Z, or Linear) you will be using from the colored bar showing available sensors. This will open an accelerometer card for that sensor. The four accelerometer sensors available in Science Journal are indicated below (remember that the icons may appear in a different order on your device):
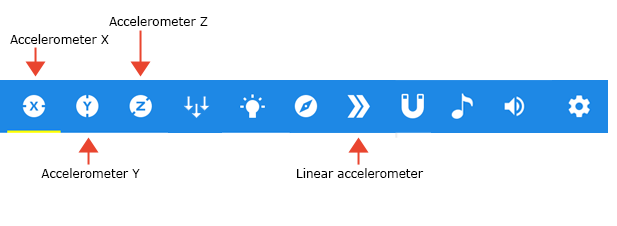
A cropped screenshot of the sensor card icons with labels in the Google Science Journal app. From left-to-right the sensors are pictured and labeled: circle with an X (accelerometer X), circle with a Y (accelerometer Y, circle with a Z (accelerometer Z), three downward arrows (barometer), a lightbulb (brightness or ambient light), a compass (compass), two right facing arrows (linear accelerometer), a U-shaped magnet (magnetometer), a musical note (pitch), a speaker (sound intensity) and a gear (settings).
Tip: If you need more information on how to navigate and interact with the Science Journal app, read posts 1 and 2 in this tutorial series.
It may sound confusing to have multiple accelerometer options, but when you start using and experimenting with the accelerometer sensors in the Science Journal app, it will be easy to see how the different sensors work when you move your phone in different directions or tilt it at different angles.
For example, to see the Accelerometer Z sensor in action, try the following. Start a recording and then pick your phone up from its flat position on the table and hold it at chest level in front of you, parallel to the ground. Keeping the position of the phone as flat as possible, quickly lift the phone into the air and then quickly lower it, imagining you are moving the phone up and down along a straight vertical line. You should see peaks and valleys on the graph that correspond to the movements. Try lifting and lowering the phone more quickly or more slowly to see how the graph changes. The screenshot below shows a sample graph from the Accelerometer Z sensor.
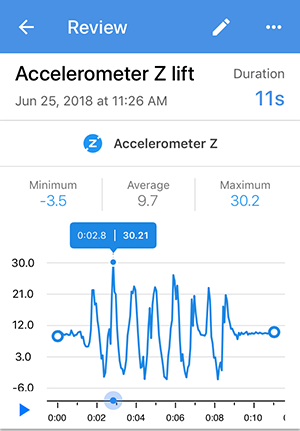
A screenshot of a recording review for an accelerometer Z sensor card in the Google Science Journal app. A pencil at the top of the screen allows the user to rename the recording. The review shows the recording title, duration, date and time, and the type of sensor card used to record at the top of the screen. Below that is a graph of the recorded data with minimum, average and maximum values shown above the graph and a marker on the graph that shows data points at specific times on the graph. A play button and link to add a note to the timeline are located on the bottom of the screen.
Reminder: Keep in mind that you need to select the accelerometer that is the best fit for the kind of movement you will be detecting. Trying the same activity as the one above (e.g., lifting and lowering the device on the Z axis) using the Accelerometer X or Accelerometer Y sensor would not result in the same data.)
What Can you Do with the Accelerometer?
Depending on how you use them, your phone's X, Y, and Z accelerometers can be used to measure a few different things, including:
- Acceleration: this can be measured when the phone moves around, but its tilt relative to the ground remains constant.
- The period of an object's oscillation: an "oscillation" is a repeating back-and-forth motion. The period is how long it takes to complete one oscillation. This can be measured even if the phone tilts and moves around, as long as you only care about the period and not the actual acceleration values.
- The direction of gravity: this can be measured if the phone tilts but doesn't move around.
The Try the Accelerometer in Science Journal section (below) contains examples that demonstrate these three uses. For additional explanation of the science behind how an accelerometer works, see the Accelerometer Technical Note.
X, Y, Z, and Linear
In addition to separate sensors for Accelerometer X, Y, and Z in the Science Journal app, there is a fourth accelerometer sensor in the app called the "Linear accelerometer." The Linear accelerometer measures the combined acceleration from all three axes, excluding gravity. The Linear accelerometer can be useful to detect "bumps" or motion in experiments where you cannot easily control the phone's orientation.
Note: The Linear accelerometer reading is always positive, even if the phone is "slowing down." This may seem confusing at first—see the Try the Accelerometer section and Accelerometer Technical Note for more details.
Using the Accelerometer Sensors
The image below shows a sample Accelerometer Z card in the app. No data is being recorded in this example. The y-axis on the graph shows the readings the sensor is making in m/s2. (Note: A sensor begins reading as soon as a sensor card is opened, but the app only records data when you start a recording or take a snapshot reading.) The x-axis represents time in mm:ss. (Note: Keep in mind that the x-axis does not show on iOS until a recording begins.)
Important!: The accelerometer measures acceleration along X, Y, and Z axes. Be careful not to get that confused with the X and Y axes of a graph. The x-axis on a graph in the Science Journal app always shows time; the y-axis on a graph from an accelerometer sensor in the app shows the values (in m/s2) for whatever accelerometer axis is being measured.
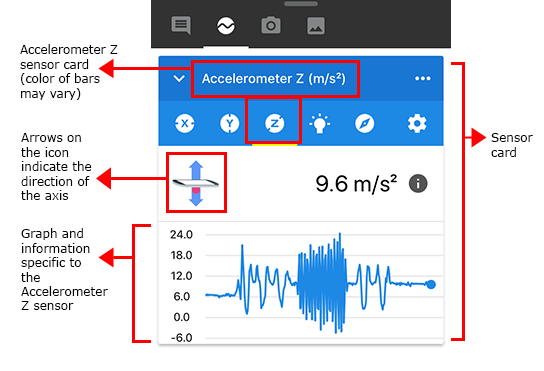
A screenshot of an accelerometer Z sensor card in the Google Science Journal app. The sensor card is labeled and shows the name of the sensor at the top. Below the name are icons to switch between sensors and below that is a graph for the sensor (measured in meters per second squared). Above the graph an icon of a horizontal phone shows the direction of the axis with arrows pointing up and down.
Find it! Unlike other sensors on your device that can be used in the Science Journal app, the accelerometer is inside your device and is not something you can physically locate on your phone or device. You do not have to worry about blocking it when doing your experiments.
Recording Accelerometer Sensor Data
Using the Science Journal app, you can take snapshots of accelerometer sensor readings or record accelerometer sensor data over time. (Note: These steps are explained in more detail in this tutorial.)
The image below shows how snapshots and recordings from an accelerometer sensor appear in the experiment feed. The sample snapshot and recording shown below are from the Accelerometer Y sensor.
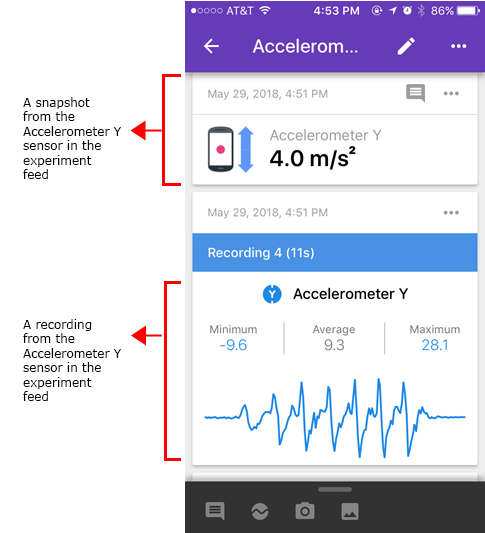
A screenshot of a snapshot and recording taken from an accelerometer Y sensor card in the Google Science Journal app experiment feed. The snapshot shows a single value (4.0 meters per second squared in this example), label for the sensor card and a date and time. The recording shows a graph of the recording, the recording title, date and time, label for the sensor card and minimum, average and maximum values of the graph.
Tapping a snapshot or a recording opens the observation so that you can view additional details (or access additional features like crop and export for recordings).
Because there are four different types of accelerometer sensors available in the Science Journal app (X, Y, Z, and Linear), you will need to pay attention to which sensor was used when reviewing snapshots or recordings. The sensor name and icon indicates which accelerometer was used. The directional arrows for each sensor's icon (on an open sensor card or snapshot) can also help remind you of the axis for the accelerometer sensor.
The following image shows the icons for each of the X, Y, and Z accelerometer sensors as they appear in a snapshot or on a sensor card.
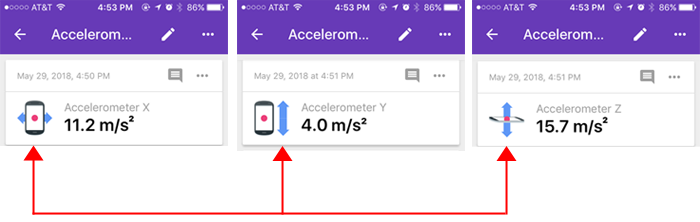
Cropped screenshots of three different accelerometer snapshots in the Google Science Journal app show an icon that illustrates the direction of the axis for a specific sensor card. The icons for the accelerometer X, Y and Z sensor cards all feature a smartphone and arrows that point in different directions that change based on the particular sensor card.
Reviewing a Recording
When you open a recording from the experiment feed, you can review the graph in more detail. A sample recording from the Accelerometer X sensor is shown below.
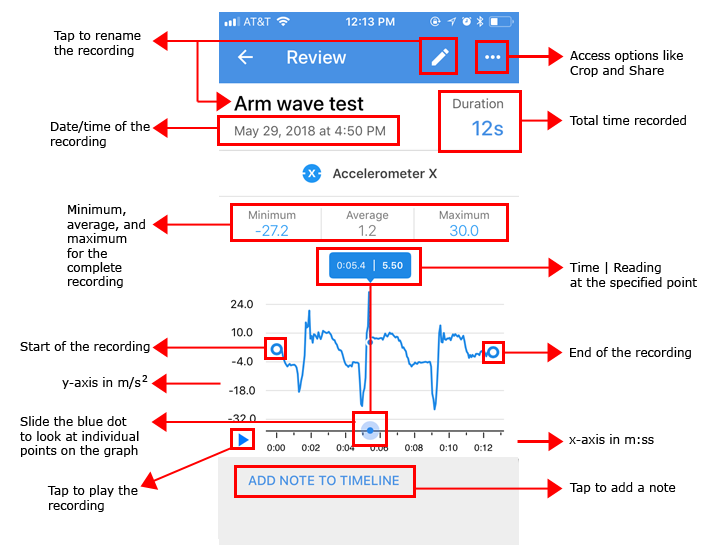
A screenshot of a recording review for an accelerometer X sensor card in the Google Science Journal app. A pencil at the top of the screen allows the user to rename the recording. Three dots in the top-right of the screen can be pressed to access additional tools such as cropping and sharing. The review shows the recording title, duration, date and time, and the type of sensor card used to record at the top of the screen. Below that is a graph of the recorded data with minimum, average and maximum values shown above the graph and a marker on the graph that shows data points at specific times on the graph. A play button and link to add a note to the timeline are located on the bottom of the screen.
Before using your data, you may need to crop your graph to remove data at the beginning or end that occurred while handling your device. You can crop your graph to remove information but be careful. There is currently no way to undo a crop. Crop and Share options can be accessed by tapping the three-dot menu in the top corner of the recording.
(Information about reviewing a recording and working with crop and share options is covered in more detail in this post.)
Try the Accelerometer in Science Journal
To see the accelerometer sensors in action, try the following examples:
Change in Velocity
Put your phone flat on a table with the screen facing up. Open the Accelerometer Y sensor in the Science Journal app. The acceleration should read zero. If you slide the phone back and forth in the Y direction while keeping it flat on the table, the acceleration will change between positive and negative values. (Look back at the diagram above if you need a reminder about which direction the Y axis is in relation to the phone's body. See the Accelerometer Technical Note to learn more about acceleration and sign conventions.)
Now, leaving the phone in the same position on the table (and still using the Accelerometer Y sensor), slide the phone back and forth in the X direction. You should see very little change in the Y acceleration. (You will still see some small changes, since it is virtually impossible to move the phone perfectly in the X direction with no motion in the Y direction.)
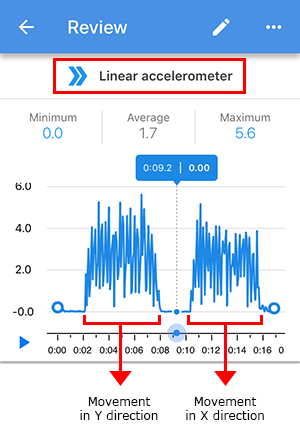
The screenshot below shows this simple experiment using the Accelerometer Y sensor with movement in the Y direction (at the beginning of the recording) and movement in the X direction (in the middle of the recording). The flat line at the very end is a period of no movement.
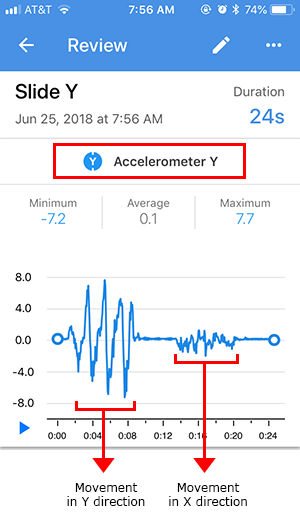
A screenshot of a recording review for an accelerometer Y sensor card in the Google Science Journal app. Movement in the Y axis is recorded as large spikes in the graph while movement in the X axis is recorded as small spikes in the graph.
Oscillation
Next, open the Accelerometer X sensor and start a recording. Hold the phone in your hand face-up and then let your arm hang down at your side (the screen of the phone will now be facing your body). Swing your arm back and forth at least 5 times. Then stop the recording and look at the resulting graph. You should see clear peaks and valleys that correspond to your arm swings, as shown in the screenshot below.
Can you identify a repeating pattern in the graph? You can measure the period, or the amount of time it takes to complete one full oscillation, as the distance on the x-axis (the amount of time) between identical points in the repeating pattern. In this case, you don't care about the acceleration values in the recording (the values recorded along the y-axis of the graph). Instead, you will be looking at the time values on the x-axis to analyze the oscillation period.
The screenshot below shows a sample recording from the arm swinging described above. A complete period of oscillation is marked.
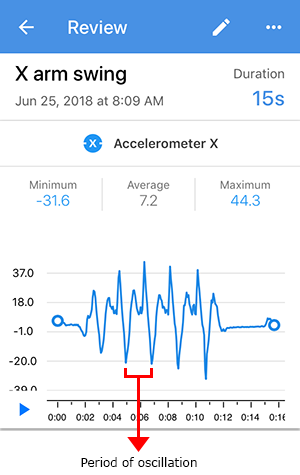
A screenshot of a recording review for an accelerometer X sensor card in the Google Science Journal app that measures the acceleration of a swinging arm. The space between peaks or troughs in the graph are labeled as the period of oscillation.
Try this experiment again, moving your arm more slowly or more quickly to see how the readings on the graph—and the period of oscillation—change. The screenshot below shows a swinging arm test done at different speeds. Can you tell by looking where the arm was swinging most quickly?
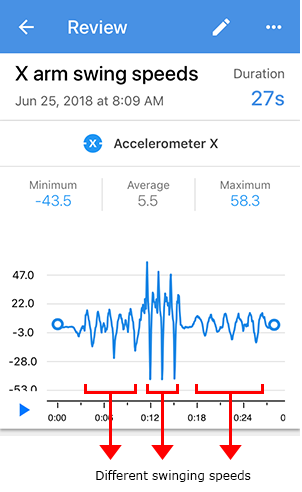
A screenshot of a recording review for an accelerometer X sensor card in the Google Science Journal app that measures the acceleration of a swinging arm. The space between peaks or troughs in the graph are labeled as the period of oscillation. There are three distinct sections where the period of oscillation changes.
Gravity
Now switch to the Accelerometer Z sensor in the app. Keep the phone flat on the table with the screen facing up. You may notice something strange—the acceleration is 9.8 m/s2, not zero! Why is there acceleration being detected even though the phone is not moving? This occurs because the accelerometer also detects gravity, which is felt by all objects on Earth, and always points down. Try picking the phone up and slowly rotating it so the screen faces you and the phone is vertical. The Z acceleration should change to 0 m/s2. If you keep rotating the phone until it is upside-down, the Z acceleration will be about -9.8 m/s2.
The screenshot below shows a sample graph using the Accelerometer Z sensor while rotating the phone, as described above. As you can see, values between about 9.8 m/s2 and -9.8 m/s2 were recorded as the phone was rotated.
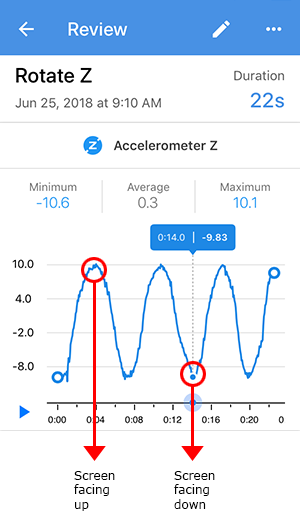
A screenshot of a recording review for an accelerometer Z sensor card in the Google Science Journal app that measures the orientation of a phone. The peaks of the graph indicate a phone facing up while the troughs indicate a phone facing down.
Note: Because the accelerometer detects gravity, it is important to keep the phone's orientation constant in projects where you need to accurately measure acceleration excluding gravity. If your phone rotates throughout the experiment, that will affect your data. For example, you can use the Accelerometer Y sensor to measure the acceleration of a toy car as it zooms across the flat floor. But you cannot compare those readings directly to acceleration readings when the car is on a ramp, because the car on the ramp is tilted relative to the ground, and gravity will affect the Accelerometer Y sensor readings.
Combined Acceleration
Now try the Linear accelerometer. Open a Linear accelerometer sensor card and start a recording. Now gently drop your phone a short distance onto something soft, like a pillow or a couch, and stop the recording. You should see a big spike in the graph from the impact when your phone landed because its velocity abruptly changed. In this case, it is difficult to control your phone's orientation because it may tumble as it falls or it may bounce when it lands. The linear accelerometer measures the phone's total acceleration (the combined acceleration of the X, Y, and Z axes), excluding gravity. This makes it useful for experiments where you can't control the phone's orientation but still want to measure acceleration. That way you don't have to worry about which way the phone is facing or the direction of gravity.
The screenshot below shows a sample graph recorded when using the Linear accelerometer sensor and repeatedly dropping a device a short distance, as described above. Notice that all of the readings are above zero.
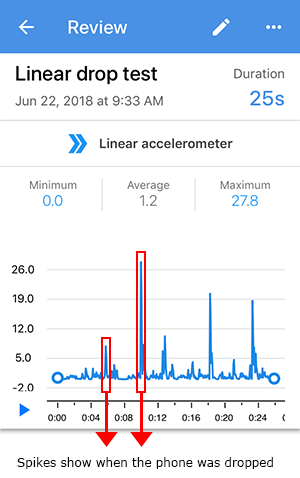
A screenshot of a recording review for a linear accelerometer sensor card in the Google Science Journal app that measures the acceleration of a dropped phone. The peaks of the graph indicate when a phone is dropped.
Next, with a sensor card for the Linear accelerometer open, put the phone flat on a table. The reading should be zero (remember that the effect of gravity, which acts in the Z direction in this case, is automatically subtracted out with this sensor). Move the phone back and forth in the Y direction. You might notice something that seems strange at first—unlike when you did this with the Accelerometer Y sensor, the Linear accelerometer value never goes negative! Now slide the phone back and forth in the X direction. You should see values that are similar to the ones you saw when you moved the phone in the Y direction, but again, they are never negative. This occurs because the Linear accelerometer sensor reports the magnitude of the total acceleration. A magnitude is like a length. Imagine using a ruler to measure something. You might measure an object that is 10 centimeters long. If you flip the object (or the ruler) around, it is still 10 centimeters long. You wouldn't say it is "negative 10 centimeters long"—the length is always positive. Similarly, the linear acceleration value is always positive. See the Accelerometer Technical Note to learn more.
The screenshot below shows a sample graph for the Linear accelerometer when the device was moved back and forth along the Y axis and then along the X axis. (Remember, when this same activity was recorded using the Accelerometer Y sensor, there was almost no acceleration recorded when the device was moved in the X direction. The Linear accelerometer measures the phone's total acceleration, minus gravity.)
A screenshot of a recording review for a linear accelerometer sensor card in the Google Science Journal app that measures the acceleration of a phone moved in multiple directions. The graph shows minimal differences between motion in the X or Y axis.
Previously, you tried the Linear accelerometer by repeatedly gently dropping your device onto a pillow or soft surface. For comparison, switch to the Accelerometer Z sensor and try repeatedly gently dropping your device the same way again. Depending on how the device falls and lands, you may see some readings above zero and some below zero. Can you guess why some might be below zero when using the Accelerometer Z sensor?
How Do You Know Which Accelerometer Sensor to Use?
With four different options for using the accelerometer in the Science Journal app, how do you choose the right one for your experiment? To make the best choice, you will first need to determine what you are measuring and what direction the phone will be moving or tilting.
The following guidelines can help you decide which sensor to use:
- I want to measure straight-line acceleration: pick the accelerometer (X, Y, or Z) that corresponds with the direction the phone will move.
- I want to measure the phone's tilt relative to the ground: pick an axis that will change direction relative to the ground as the phone rotates.
- I want to measure the period of an oscillation: use the X, Y, or Z accelerometer, depending on which way the phone is moving.
- I want to measure peak accelerations, but I don't care about the direction: use the Linear accelerometer.

Experiment with the Accelerometer
The following projects at Science Buddies use the accelerometer:
- Building the Tallest Tower: Build an earthquake table and a tower and then use the Science Journal app to measure how hard the earthquake table shakes.
- Keeping Up: Use the Science Journal app to explore the relationship between height and walking stride to learn more about how a pedometer works.
- Motion Mania: Applying Physics to Hula-Hooping: Experiment to find out what variables make a hula hoop easier to keep in motion and use the Science Journal app to measure how fast you hula hoop.
- Skipping Science: An Experiment in Jump Rope Lengths: Explore the relationship between jumping rope and the length of the rope and use the Science Journal app to measure how fast you jump.
- Swing Low: Investigate the Motion of a Pendulum: Investigate the factors that affect the speed and duration of a pendulum's swing and use the Science Journal app to determine the period of oscillation.
- Simple Harmonic Motion in a Spring-Mass System: Use the Science Journal app to measure the periodic motion of a mini Slinky® and explore Hooke's Law.
- Hacking the Air Gap: Stealing Data from a Computer that isn't Connected to the Internet: Investigate how a computer that is not connected to the Internet or to other computers can still be hacked by transmitting data using light, sound, vibration, or heat.
More to Come
In the next post in this tutorial series, we will look more closely at the pitch sensor in the Science Journal app and Science Buddies projects that use the pitch sensor.See other posts in this series and additional Science Journal app resources at Science Buddies:
- Get Started with a Sensor App
- Sensor Savvy with a Mobile Phone App
- Exploring Sound Intensity with a Sensor App
- Exploring Light with a Sensor App
- Exploring Pitch with a Sensor App
- View all posts in this series
- Science Buddies and Google's Science Journal App (resource for educators)
- Science Buddies Project Ideas that use the Science Journal app
Download the App to Get Started!
The Google Science Journal app is no longer available. Download links have been removed.
Categories:
You Might Also Enjoy These Related Posts:
- Teachers Develop Exciting New Lessons with Us for Science Journal
- Your Science Project Data Wherever You Are
- Exploring Pitch with a Sensor App
- Try Google's Science Journal App with Six Activities for Chemistry Exploration
- Try Google's Science Journal App with Five Activities for Physics Exploration
- Try Google's Science Journal App with Five STEM Activities for the Classroom
- Exploring Acceleration with a Sensor App
- Learn to Use Google's Science Journal App