Page 1 of 1
Using the Solar & Heliospheric Observatory Satellite (SOHO) to Measure the Motion of a Coronal Mass Ejection
Posted: Fri Jan 22, 2016 9:23 am
by deleted-322784
(It's me again !!)
so the part of the dorections where you're supposed to figure out the screen vs sun proportions. What does it mean by s screen and s actual
^HELPPP asap please
Re: Using the Solar & Heliospheric Observatory Satellite (SOHO) to Measure the Motion of a Coronal Mass Ejection
Posted: Sat Jan 23, 2016 3:05 am
by theborg
ewjoey,
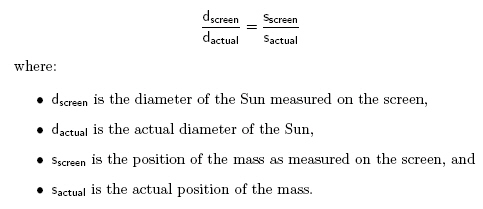
Thanks for your question. In future, try to post all questions about a project to a single thread. As for this one, the equation allows you to scale the distances in the image to the actual distance in space. s_screen is the distance measured with a ruler on the screen (or print) from the edge of the sun to the CME structure you've picked to track across the images. You then use the equation to solve for s_actual, which will be the actual distance from the sun to the CME. Rearranging the equation to do this, you get:
s_actual = s_screen (d_actual / d_screen).
Where you measure, with a ruler, the distance from the sun to the CME to get s_screen and you measure the diameter of the sun on the screen to get d_screen, and we know the physical diameter of the sun from the project documentation to be 1.4 million km, denoted as d_actual.
Re: Using the Solar & Heliospheric Observatory Satellite (SOHO) to Measure the Motion of a Coronal Mass Ejection
Posted: Mon Jan 25, 2016 2:47 pm
by deleted-322784
another question sorry
what are t1 and t2 supposed to be im not rlly clear on that ://
Re: Using the Solar & Heliospheric Observatory Satellite (SOHO) to Measure the Motion of a Coronal Mass Ejection
Posted: Tue Jan 26, 2016 12:14 pm
by theborg
No problem, as many questions as you need to ask!
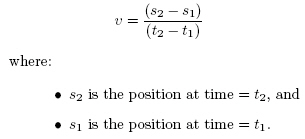
For this part you are finding the average velocity of the CME in your pictures by finding how far the CME has travelled in a certain amount of time between any two images. So in this equation you find s1, the position of the CME in image 1 and s2, the position of the CME in image 2 and subtract s2 - s1 to get distance in Kilometres (Km) the CME has travelled. The images themselves will have a time stamp on them. This is the time the image was taken. This is your t1 and t2 for time of image 1 and 2 respectively. Subtract t2 - t1 to get the amount of time, say number of hours, that has passed between images. For example: if image 1 was taken on 25 Jan at 07:15:20 and image 2 was taken on 25 Jan at 10:30:00 then t2 - t1 yields 10.50 hrs - 7.26 hrs = 3.24 hrs between images. Dividing distance by time gives you the average velocity of the CME (Km/hr) from one image to the next. If you find that the CME has travelled 10,550 Km in that time then the velocity would be 10,550Km/3.24hrs = 3,256.17 Km/hr. These are just random numbers I've used to illustrate my point. Do not be alarmed if your numbers are greatly different.
Re: Using the Solar & Heliospheric Observatory Satellite (SOHO) to Measure the Motion of a Coronal Mass Ejection
Posted: Wed Jan 27, 2016 8:46 am
by deleted-322784
whata bout the last image then
wut wud u do for second position and second time??
Re: Using the Solar & Heliospheric Observatory Satellite (SOHO) to Measure the Motion of a Coronal Mass Ejection
Posted: Wed Feb 03, 2016 12:48 am
by theborg
The last image is your end time. You solve for velocity and acceleration between any two images. You will have velocity between images 1 and 2, images 2 and 3, images 3 and 4, and images 4 and 5. Four velocities total, we'll call them v1, v2, v3, v4. You use these to find acceleration between v1 and v2, v2 and v3, and v3 and v4. Giving you three values for acceleration. This should give you a good idea of how the CME is changing as it moves away from the sun.