Abstract
Race car drivers need every advantage they can get to give them the competitive edge in a race. In addition to human factors, like driving skill and reaction time, their cars must overcome physical forces, like air resistance, to maintain their high speeds. While this science project will not have you driving around a race track at 200 miles per hour, you will get to test how increased air resistance affects a real car's fuel economy. You will do this by measuring and comparing the gas mileage of a car with and without a roof rack.Summary
Ben Finio, PhD, Science Buddies

Objective
Measure and compare the fuel economy of a car with and without a roof rack.
Introduction
If you are a big fan of car racing, you probably know that race cars can zoom around the track at speeds of over 200 miles per hour (mph). At such high speeds, a car's engine must work very hard to overcome lots of air resistance. Air resistance (also commonly referred to as drag) is a force that acts on a car opposite its direction of motion. Air resistance occurs because the car (or any moving object) has to push a lot of air out of the way in order to move forward. Air resistance is always opposite to the direction of motion, and it gets stronger as the car moves faster. In other words, when a car moves forward, air resistance tries to slow it down. The faster the car moves, the more air resistance it encounters, as shown in Figure 1, below.
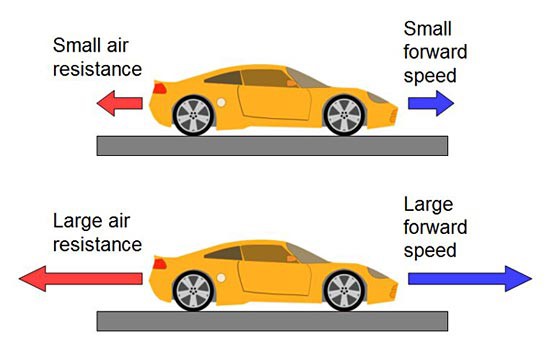 Image Credit: Wikimedia Commons user Ebaychatter0, modified by Ben Finio (Science Buddies) / Creative Commons Attribution-Share Alike 3.0 Unported
Figure 1. Air resistance is always in the opposite direction a vehicle is moving. As a car's speed increases, so does the air resistance (image adapted from Ebaychatter0, Wikimedia Commons, 2012).
Race car drivers want to minimize the air resistance on their cars, because air resistance slows them down. This is why race cars are designed to be very aerodynamic, meaning they have very little air resistance. While normal drivers are not concerned about the need to drive at speeds of 200 mph, they also want to minimize air resistance, because it will help improve the car's fuel economy. You may have heard adults talking, or seen commercials, about cars that "get good gas mileage" or "have a good fuel economy," but what exactly does this mean? Fuel economy is a measure of how far, on average, a car can travel using a certain amount of gasoline. In the U.S., it is measured in miles per gallon, or mpg for short. So, for example, if a car "has a fuel economy of 30 mpg," that means, on average, it can drive 30 miles on 1 gallon of gasoline. Fuel economy tends to be better if you are driving at a steady speed (like on a highway), and worse if there are lots of sudden starts and stops (like in a city with lots of red lights), so cars are usually rated separately for their highway fuel economy and their city fuel economy.
In this sports science project, you will investigate how air resistance affects the fuel economy of a car. You will measure the fuel economy of a car without a roof rack, and then with a roof rack added, which will increase the air resistance on the car. Do you think adding a roof rack to a car will have an impact on its fuel economy? If so, how big do you think the difference will be? Do you think you will be able to measure a decrease in fuel economy, or will it be too small to notice?
Terms and Concepts
- Air resistance
- Drag
- Force
- Aerodynamic
- Fuel economy
- Miles per gallon (mpg)
Questions
- What are some typical fuel economies for different types of vehicles, such as a large pickup truck or SUV versus a small hybrid sedan? See the Bibliography below for some references to look up fuel economies.
- How different are the city and highway fuel economy ratings for most vehicles?
- Which is more aerodynamic, a small sports car or a large pickup truck?
- How much of an impact do you think air resistance from a roof rack will have on fuel economy? Will it be a large effect or barely noticeable?
- How do you think other factors can affect fuel economy?
- For example, how could weather conditions like wind, rain, or snow affect fuel economy?
- What about the amount of weight the car is carrying or towing? How would adding more passengers or cargo to a car affect its fuel economy?
Bibliography
- U.S. Department of Energy & Environmental Protection Agency. (n.d.). www.fueleconomy.gov: the official U.S. government source for fuel economy information. Retrieved November 22, 2013.
- Glenn Research Center, NASA. (2022, July 21). What is Drag?. Retrieved August 4, 2023.
- U.S. Department of Energy & Environmental Protection Agency. (n.d.). Planning and Combining Trips. Retrieved November 22, 2013.
- U.S. Department of Energy & Environmental Protection Agency. (n.d.). How Vehicles are Tested. Retrieved December 4, 2013.
Materials and Equipment
- Adult volunteer with a valid driver's license and who is allowed to drive a car
- Car with detachable roof rack, like those used for bikes, skis, or luggage. Many different types of roof racks and luggage racks are available from Amazon.com. Have an adult help you pick a roof rack that will fit on the car you will use for the experiment.
- Lab notebook
Disclaimer: Science Buddies participates in affiliate programs with Home Science Tools, Amazon.com, Carolina Biological, and Jameco Electronics. Proceeds from the affiliate programs help support Science Buddies, a 501(c)(3) public charity, and keep our resources free for everyone. Our top priority is student learning. If you have any comments (positive or negative) related to purchases you've made for science projects from recommendations on our site, please let us know. Write to us at scibuddy@sciencebuddies.org.
Experimental Procedure
- Note: For convenience when doing the experiment, this procedure is written using miles (mi) per gallon (gal), or mpg, to measure fuel economy. However, science is done in metric units, so you may need to convert your results to metric units when writing up your procedure and for your science project display board. In the metric system, fuel economy is measured in kilometers per liter, or kpl. If you do not know how to convert between English and metric units, you can use an online unit conversion tool to do this.
-
The objective of this experiment is to compare the fuel economy of a car with and without a roof rack. In order to do so, you will need to plan out the driving routes your adult volunteer will use.
-
When the government does fuel economy tests, they are done in a carefully controlled laboratory environment. This lets government scientists control all the variables in their experiment. For example, they do the tests indoors to eliminate variables like wind, rain, and traffic. You can read more about how cars are tested at How Vehicles Are Tested. However, you will be doing the experiment in real-world driving conditions, which can be subject to changes in weather, traffic patterns, and other factors out of your control. This means that you need to do your tests over a long enough period of time for the effects of all of these variables to average out. You should do a minimum of 2 hours of total driving time for each test (one without the roof rack and one with the roof rack). You will need to pick the same driving route to use for each period. Here are some suggested ways to test for that length of time:
- If your adult volunteer drives to work every day (or has another consistent commute, like dropping kids off at school or picking them up at sports practices), you could have him or her commute without the roof rack one week, and with the roof rack the following week. Try to make sure the commute is at least 12 minutes in each direction, which would result in a total commuting time of 2 hours for a 5 day work week (a longer commute is even better).
- You could make two long trips to a destination about an hour away. Make one complete 2 hour roundtrip without the roof rack, and one complete roundtrip with the roof rack.
-
Because you cannot do your tests in a laboratory environment, you will need to do your best to control variables like traffic, weight, and weather.
- Do not compare two testing periods with very different weather conditions. For example, do not compare a clear, sunny week (or single 2 hour trip) to a rainy, windy week (or single 2 hour trip). You may need to look at the weather forecast in advance to help plan your experiment.
- Do not compare two testing periods with very different traffic conditions. If your adult volunteer is commuting for 5 days for each test, it is okay if he or she consistently gets stuck in traffic every day during the commute. If there usually is not a lot of traffic, it is also okay if he or she gets stuck in traffic only once or twice (for example, due to an accident). However, do not compare an entire week of no traffic to an entire week with lots of traffic (for example, if there is a new construction project along his or her commute). If you are doing a long trip, you can check an online traffic app in advance to try and avoid traffic.
- Do not compare two testing periods when a lot of extra driving is done with the car during one, but not during the other. For example, if you typically make one trip to the grocery store and three trips to soccer practice throughout the week, it is okay to do that for both weeks. However, you should not compare one week where the car is only used to commute, to another week where the car is used to commute and to run errands every day. The trips during both testing periods do not need to be exactly the same, but should be as similar as possible.
- Make sure you have similar amounts of weight in the car for both tests. This includes the total weight of all passengers, cargo, and towing objects (if any). It is OK if you occasionally have extra passengers in addition to the driver, or consistently have extra passengers all week. But do not compare one week with no passengers or cargo to another week with four passengers and a lot of cargo.
- Remember to make sure you take as similar a route as possible for each half of the experiment. For instance, do not compare two weeks when your adult volunteer commutes to very different locations, or two roundtrips to different destinations.
- If you do a long roundtrip route, make sure you do a complete roundtrip without the roof rack, and another complete roundtrip with the roof rack. Do not test without the roof rack one way and with the roof rack on the return trip. This is because differences in elevation between two locations (and driving uphill or downhill between them) can have a big impact on fuel economy.
-
When the government does fuel economy tests, they are done in a carefully controlled laboratory environment. This lets government scientists control all the variables in their experiment. For example, they do the tests indoors to eliminate variables like wind, rain, and traffic. You can read more about how cars are tested at How Vehicles Are Tested. However, you will be doing the experiment in real-world driving conditions, which can be subject to changes in weather, traffic patterns, and other factors out of your control. This means that you need to do your tests over a long enough period of time for the effects of all of these variables to average out. You should do a minimum of 2 hours of total driving time for each test (one without the roof rack and one with the roof rack). You will need to pick the same driving route to use for each period. Here are some suggested ways to test for that length of time:
-
In your lab notebook, make a data table like Table 1, below, in which to record the results of your experiment.
- Note: Some newer cars have a dashboard display that shows the car's current fuel economy in mpg. Usually the fuel economy measurement resets when you reset the trip odometer. If your car is equipped with this feature, you can use it to measure fuel economy for your experiment, but you should still do the calculation by hand, as described below.
| Without the Roof Rack | With the Roof Rack | |
| Starting fuel as a fraction of the total tank | ||
| Ending fuel as a fraction of the total tank | ||
| Starting fuel (gal) | ||
| Fuel added (gal) | ||
| Ending fuel (gal) | ||
| Total fuel used (gal) | ||
| Total distance driven (mi) | ||
| Fuel economy according to your calculations (mpg) | ||
| Optional: Fuel economy according to car's dashboard display (mpg) (if available) |
Table 1. Data table for recording the results of your experiment. The last row is optional, depending on whether or not your car displays fuel economy on the dashboard.
-
Once you have discussed your plan with your adult volunteer, start your experiment and record your data. First you will measure fuel economy without the roof rack.
- Note: It will be easier to record the initial fuel level if you start the experiment with a full tank of gas. This is recommended, but not required.
- On the first day of your experiment (or at the beginning of your long trip), have your adult volunteer reset the car's trip odometer to zero.
-
In your data table, record the starting level of the fuel tank as a fraction (for example, "3/4"). If the gas tank is full, the value is just "1".
- If necessary, have an adult help you estimate the gas tank level. For example, if the needle is halfway between the ½ and ¾ marks, then the tank is ⅝ full. This value will affect the fuel economy you calculate at the end of the experiment, so try to be as accurate as possible.
- Have your adult volunteer drive the car through the planned route for the experiment (this may take up to a week, depending on your plan). Important: Make sure your volunteer keeps all receipts for filling up the car with gasoline. You will need to know how much gasoline has been added to the fuel tank throughout the experiment.
-
On the final day of the experiment (or at the end of your trip), record the trip odometer distance (the distance driven, in miles) and the ending fuel tank level in your data table.
- Again, if necessary, have an adult help you estimate the fuel tank level. Be as accurate as possible.
- Use the receipts to add up the total amount of gasoline that was put in the tank, and enter this value in your data table.
-
Calculate the car's fuel economy without the roof rack.
-
First, you will need to convert the fractional fuel tank amounts (starting and ending) to gallons, and enter these values in your data table. To do this, you will need to look up the size of your car's fuel tank. You can find this information in the owner's manual (ask an adult for help if necessary). Multiply the starting fraction by the fuel tank's capacity to calculate the amount of fuel in gallons.
- For example, a 12 gal fuel tank that is ¾ full has 9 gal of gasoline in it.
-
Next, you need to calculate the total amount of fuel used, and enter this value in your data table. To do this, add together the starting fuel and the amount of fuel added, then subtract the ending fuel (all in gallons, not fractions).
- For example, if the tank started out with 9 gal. of gasoline, your adult volunteer added 10 gal. total throughout the experiment, and the tank ended with 3 gal., then you used a total of 9 + 10 - 3 = 16 gal of gasoline.
-
Finally, calculate the car's fuel economy in mpg using Equation 1:
Equation 1:
- For example, if the car that used 16 gal of fuel drove a total of 400 mi, then it had a fuel economy of 400/16 = 25 mpg.
- Optional: If your car displays fuel economy on the dashboard, check the value (have your adult volunteer help you if necessary) and record it in your data table. Compare this value to the one you calculated using Equation 1. Are they very similar?
-
First, you will need to convert the fractional fuel tank amounts (starting and ending) to gallons, and enter these values in your data table. To do this, you will need to look up the size of your car's fuel tank. You can find this information in the owner's manual (ask an adult for help if necessary). Multiply the starting fraction by the fuel tank's capacity to calculate the amount of fuel in gallons.
-
Repeat steps 4–5 with the roof rack installed.
- Remember to reset the trip odometer before you start the second half of your experiment.
- Remember to keep track of the fuel tank levels and fuel added in the second column of your data table. Be careful not to get gasoline receipts from the first half of your experiment mixed up with those from the second half.
-
Calculate the percentage change in fuel economy from driving the car without the roof rack to driving it with the roof rack by using Equation 2:
Equation 2:
-
Analyze your results.
- How much did fuel economy decrease when you added a roof rack? How does this compare to your prediction?
- Based on your results, would you recommend leaving a roof rack installed on a car when it is not actually in use? Why or why not?
- In the Introduction you learned that air resistance increases as a car's speed increases. Presumably, your adult volunteer did this experiment at typical "safe" driving speeds and followed the speed limit—usually no higher than 65 miles per hour (mph). But, some race car drivers can reach speeds of over 200 mph. How much more of an effect do you think air resistance has at 200 mph instead of 65 mph? How much of an impact would this have on fuel economy?
Ask an Expert
Global Connections
The United Nations Sustainable Development Goals (UNSDGs) are a blueprint to achieve a better and more sustainable future for all.

Variations
- What happens if you actually add cargo to the roof rack (such as luggage, bikes, or skis)? Repeat the experiment with cargo on the roof rack, and compare to the fuel economy with an empty roof rack, and no roof rack.
- How does tire pressure affect a car's fuel economy? Can driving with under-inflated tires hurt fuel economy? Warning: Driving with tire pressure that is too low can be dangerous. Have an adult help you figure out a safe range of tire pressures to conduct this experiment.
- On a hot summer day, it may be tempting to turn your car's air conditioning on full blast. But, did you know this can affect the fuel economy? How does driving a car with and without the air conditioning on affect fuel economy? What about driving with the windows down instead of running the air conditioning? Is one option better than the other?
- Does the amount of weight a car is carrying affect fuel economy? How does the fuel economy change when the driver is the only person in the car, versus the driver plus several passengers, or additional cargo? What about driving with a nearly full gas tank versus a nearly empty gas tank? Does the weight of the gasoline itself make a difference?
- Does weather affect fuel economy? How does fuel economy vary on hot days versus cold days, or sunny days versus rainy days?
- How does fuel economy vary for different types of cars (such as sedans, SUVs, pickup trucks, etc.)? What about hybrid versus non-hybrid cars?
- While it may be difficult to do your own full-scale laboratory experiments to measure fuel economy, use model cars to measure air resistance, and the impact of adding a model roof rack. Here are some other Science Buddies projects that might give you some inspiration:
Careers
If you like this project, you might enjoy exploring these related careers:


Related Links
- Science Fair Project Guide
- Other Ideas Like This
- Aerodynamics & Hydrodynamics Project Ideas
- My Favorites