Abstract
Strike a key on the piano, and you hear the string vibrating. Just about any object vibrates when it's knocked, but how much and how fast? What properties of the material affect the way it vibrates? This project helps you find out. You'll build a simple light-sensing circuit for measuring the frequency of vibrating springs.Summary
Andrew Olson, Ph.D., Science Buddies
Sources
This project is based on:
- St. Hilaire, G.P., 2004. Effects of Stiffness and Density on a Material's Natural Frequency, California State Science Fair Abstract. Retrieved November 16, 2006.

Objective
The goal of this project is to measure the vibrational frequency of spring/mass combinations using springs of different stiffness and a graded range of masses for each spring.
Introduction
Have you ever "twanged" a ruler sticking off the edge of a desk and then pulled it back to hear the funny sound it makes? When you twang the ruler, it vibrates at a natural frequency determined by the stiffness of the ruler material and the length of the ruler that is able to vibrate. As you pull back on the ruler, the length that is free to vibrate becomes shorter and shorter. The frequency of the vibration increases, and you hear that funny, rising sound.
Any solid object will have a natural vibration frequency. For massive objects, the vibrations may be very small, and thus hard to measure. In this project, you will measure the vibration frequencies of springs with different masses hanging from them. Try to find a selection of springs with a wide variety of stiffnesses. For each spring, use a range of masses. Be careful not to put too much weight on each spring, though. If you put too much strain on the spring, you will go beyond its range of elasticity and you will end up permanently deforming the spring.
The Experimental Procedure section explains how you can build a simple light-sensor circuit which you can use with an analog-to-digital (A/D) converter to measure the frequency of vibration of your different spring/mass combinations. An A/D converter takes an analog signal (the voltage signal from your light-to-voltage circuit) and converts it to a digital signal (a stream of 0's and 1's, the language of computers). The A/D converter samples the analog signal at regular intervals (called the sampling rate or sampling frequency) and converts the signal to a number that is proportional to the strength of the signal. The sampling rate places a limitation on the frequency of the signals that can be accurately recorded. In theory, you can resolve a signal at half the sampling frequency.
In practice, the sampling rate should be slightly higher than twice the desired maximum frequency. For example, audio signals, which range from 20–20,000 Hz, are sampled at 44,100 Hz for typical MP3 files. For digital TV, and digital audio tape recorders, the sampling rate for audio is even higher, 48,000 Hz.
The inexpensive A/D converter recommended for this project can sample at a maximum rate of 240 Hz, so you the maximum frequency of the signals you can expect to record is about 100–105 Hz.
Terms and Concepts
To do this project, you should do research that enables you to understand the following terms and concepts:
- Hooke's law,
- vibrational frequency,
- sampling rate (or sampling frequency).
Questions
- If an A/D converter has a sampling rate of 240 samples per second, what is the maximum frequency that can be reliably detected?
Bibliography
- Science Buddies Staff. (n.d.). How to Use a Breadboard. Retrieved September 25, 2015.
- Wikipedia Contributors. (2006). Hooke's Law. Wikipedia: The Free Encyclopedia. Retrieved November 16, 2006.
- Light-to-Voltage Converter Data Sheet: TAOS, Inc. (2006). TSL12S, TSL13S, TSL14S Light-to-Voltage Converters. Retrieved November 16, 2006.
Materials and Equipment
To do this experiment you will need the following materials and equipment:
- light-to-voltage converter (e.g., part number 856-TSL14S-LF, Mouser Electronics),
- 10 kΩ, 1/4-watt resistor (e.g., part number 271-10K-RC, Mouser Electronics),
- 3 AA batteries,
- battery holder (e.g., part number 12BH331-GR, Mouser Electronics),
- insulated connecting wire,
- for building the circuit you can use:
- solderless breadboard (e.g., part number 517-922306, Mouser Electronics), or
- you can solder the circuit together and install them in a small enclosure (you'll need to drill a hole and position the sensor so that light can reach it),
- flashlight,
- analog-digital (A/D) converter with data acquisition software (e.g., DI-145, DATAQ Instruments) [requires Windows operating system],
- computer with serial port,
- springs of different stiffness,
- masses to hang from springs (range of a few grams to kilograms, depends on stiffness of springs).
Disclaimer: Science Buddies participates in affiliate programs with Home Science Tools, Amazon.com, Carolina Biological, and Jameco Electronics. Proceeds from the affiliate programs help support Science Buddies, a 501(c)(3) public charity, and keep our resources free for everyone. Our top priority is student learning. If you have any comments (positive or negative) related to purchases you've made for science projects from recommendations on our site, please let us know. Write to us at scibuddy@sciencebuddies.org.
Experimental Procedure
Building the Vibration Frequency Detector Circuit
-
The circuit is very simple. The light-to-voltage converter is an integrated package that contains a photodiode and an amplifier (Figure 1 shows the functional block diagram).
Light (arrows) illuminates the photodiode sensor and generates a current. The operational amplifier (or "op amp," symbolized by the large triangle in the diagram) produces an output voltage that is proportional to the intensity of the light illuminating the photodiode.
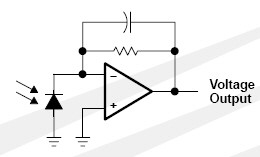 Image Credit: TAOS, Inc. / Copyrighted
A light-to-voltage converter is wired in parallel with a resistor and is connected to a circuit with an LED and battery.
Figure 1. Light-to-voltage converter functional block diagram. (TAOS, Inc., 2006)
-
A drawing of the actual component is shown in Figure 2. The round window contains the light-sensitve region. The component has three pins, as shown.
- Pin 1 should be connected to ground (black wire from the battery holder).
- Pin 2 should be connected to the positive supply voltage (red wire from the battery holder). The supply voltage should be between 2.5 and 5.5 V DC, so you can use either 2 or 3 AA batteries.
- Pin 3 is the output voltage, a signal that is proportional to the amount of light falling on the sensor.
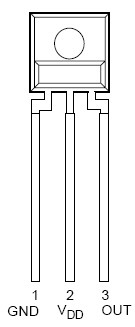 Image Credit
Figure 2. Drawing of light-to-voltage converter package. (TAOS, Inc., 2006)
-
Figure 3 shows a schematic diagram of the complete circuit. In addition to the light-to-voltage converter, there is only one more component: a 10 kΩ resistor (RL). Connect the resistor from pin 3 to ground, as shown.
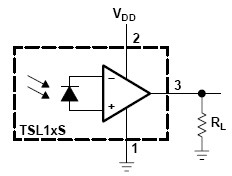 Image Credit: TAOS, Inc. / Copyrighted
Diagram of a light-to-voltage converter wired to a battery that has an LED connected to it. A resistor is connected to the third pin.
Figure 3. Light-to-voltage converter circuit schematic. (TAOS, Inc., 2006)
- The output signal is the voltage drop across the 10 kΩ resistor. Connect pin 3 to the channel 1 input on the DI-145, and connect pin 1 to the GND input on the DI-145.
- You can easily build the circuit on a solderless breadboard. You can learn how to use a breadboard in the Science Buddies reference How to Use a Breadboard for Electronics and Circuits.
- Alternatively, if you have experience with a soldering iron, you can make the circuit in a small enclosure. You'll have to drill a hole and position the light-to-voltage converter so that light can reach its sensor.
- If you have a digital multimeter, you can use it to test your circuit (if you need help using a multimeter, check out the Science Buddies reference How to Use a Multimeter). Connect the multimeter across the 10 kΩ resistor, and set the multimeter to read DC volts (the maximum signal will be about 5 V). When you shine a flashlight on the sensor, your multimeter should read between 3 and 5 V (depending on whether you used 2 or 3 batteries). When you cover the sensor, the multimeter should read close to 0 V.
Measuring Vibration Frequency
- For measuring the vibration of a spring, you will need a continuous readout of the voltage from your circuit. For this, you will use the analog-to-digital (A/D) converter. If you happen to have access to an oscilloscope, you could use that instead.
- Follow the instructions that come with the DATAQ A/D converter (DI-145) for installing the WinDAQ Lite software. Connect the A/D converter to your computer using the supplied serial port cable. (Be sure to use the thumbscrew connectors to insure a good ground connection.)
- Connect the A/D converter to read the voltage across the 10 kΩ resistor in your circuit. To do this, connect the ground from your light-to-voltage circuit to the GND connection on the A/D converter, and connect the output (pin 3) to the Channel 1 input on the A/D converter.
- Start the WinDAQ Lite software.
-
By default, the WinDAQ software will take samples from each of the four input channels, cycling through all four channels before repeating with the first channel. Since you are only using one input channel, you can turn off sampling on channels 2–4.
- To turn off sampling on a channel, select Edit/Channels (or press the "F5" function key). Type "-" and then the channel number to turn off sampling for that channel, then hit Enter. Turn off sampling for channels 2, 3, and 4.
- This means that the software will only sample from one channel, so the sampling rate will be four times faster. The maximum sampling rate of the DI-145 is 240 samples/s. When sampling from all four channels, the maximum rate is thus 60 samples/s for each channel. When sampling from a single channel, the maximum rate is 240 samples/s.
- Note that the theoretical maximum frequency you can resolve with the DI-145 when sampling a single channel at the maximum rate is 0.5 × 240 samples/s or 120 Hz. Practically, the maximum frequency will be about 100–105 Hz.
- The output of the light-to-voltage converter ranges from 0 to about 5 V. The DI-145 has a fixed gain, so its dynamic range is always -10 to +10 V. However, you can change the scaling of the signal on the screen so that you can see the response more easily. From the menus, select Scaling/Limits, and change the upper and lower limits to 5 and 0V, respectively.
- You can test to see that the A/D converter is working by pointing a flashlight on the sensor and then away. You should see the voltage rise when the light is on the sensor and then fall when the light moves away. If you don't see a response, go back and check all of your connections and try again.
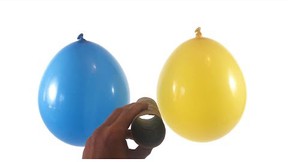
- Next you need to hang a spring from a sturdy support and attach a weight to the bottom. Position the sensor behind the weight, right near the top edge. Shine the flashlight directly at the weight. When you pull down on the weight, the light should fall on the sensor. When you let go of the weight, the spring will vibrate, and the weight will move up and down, blocking and unblocking the sensor. From the changing voltage output of your circuit, you will be able to measure the frequency of the vibration.
- Practice setting the weight vibrating a couple of times to make sure that everything is positioned correctly. The flashlight should be bright enough to provide a full-scale response (i.e., about 5 V) when it falls on the sensor.
-
The A/D converter can record the voltage data to a file, which you can later analyze to measure the vibration frequency.
- Select File/Open from the menus.
- Type a name for your data file and press <enter> . To help you keep track of your data, the name should identify the spring and weight used for each file.
-
To record, press
<f4> . - Pull down on the weight and release it to set the spring vibrating.
- When the vibrations have stopped, pull down and release the weight again. Record at least 3 trials.
- To stop recording, press <f4>.
- Repeat for each spring/mass combination, using a separate file for each one.
- To measure the frequency of vibration, use the WinDAQ Waveform Browser software to open the data file. Since you have data on only one channel, you should format the screen to view only that channel. Choose View/Format Screen and select "1 Waveform."
-
Figure 4 illustrates some of the features of the software and shows data measured from the spring-loaded plunger on a pinball machine.
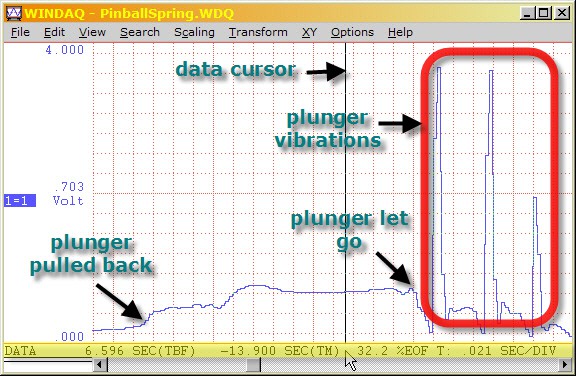
A graph in the program WinDAQ measures the vibrations of a plunger through changes in voltage. When a plunger is released there is a large spike in voltage on the graph that lasts for a brief moment.
Figure 4. Screenshot of the WinDAQ Waveform Browser software. Data readout line is highlighted in yellow. Click and drag on this line to move the data cursor with the mouse. You can also see the voltage signal increase when the plunger is pulled back, then decrease when the plunger is let go. The three sharp peaks that follow are due to the vibration of the plunger allowing light to pass through to the sensor.
-
You can position the data cursor (Options/Data Cursor) with the arrow keys, or by clicking and dragging in the data read-out line just below the graph. In Figure 5, the data cursor has been dragged to the peak of the first vibration, when the plunger had bounced out of the way and the sensor was receiving the maximum amount of light.
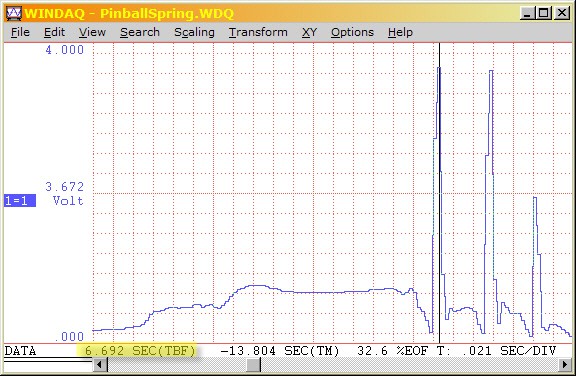
A cursor is placed over a spike in a voltage graph created in the program WinDAQ. The cursor highlights the time the spike occurred at the bottom of the program window.
Figure 5. In this screenshot, the data cursor is now positioned at the first peak. The data readout line shows the time of this peak (since the beginning of the file).
-
Now you can use a Time Marker to measure the time between the data cursor position and the moveable Time Marker. It's a little confusing at first, because the Time Marker looks just like the Data Cursor. You can move it with the arrow keys, or by clicking and dragging in the data readout line. When you enable a Time Marker, the current position of the Data Cursor becomes a blue line. As you drag the Time Marker, the data readout line shows the measured time between the Data Cursor and the Time Marker. See Figure 6.
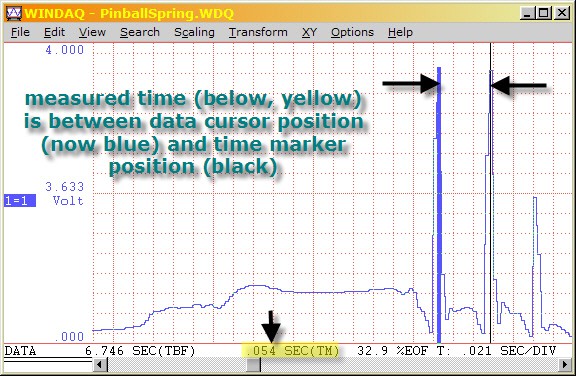
The program WinDAQ allows for a cursor to measure the time between two points on a graph. A blue line and black line are aligned with two peaks on a voltage graph and the time between the two lines is displayed at the bottom of the program window.
Figure 6. In this screenshot, the Time Marker is now enabled. The position of the data cursor is now shown in blue. The Time Marker has been positioned at the second peak, and the time between the two peaks is given on the data readout line (highlighted in yellow).
- The frequency of the vibrations is the reciprocal of the time between two adjacent peaks. In the case of the pinball plunger spring from Figure 6, the frequency is 1/0.054 s, or 18.5 Hz.
- Repeat the measurements for each pair of peaks and for all of the trials for each spring/mass combination.
- For each spring, make a graph of vibration frequency vs. weight.
Ask an Expert
Global Connections
The United Nations Sustainable Development Goals (UNSDGs) are a blueprint to achieve a better and more sustainable future for all.

Variations
- The Wikipedia article on Hooke's Law (Wikipedia, 2006) contains an equation relating frequency of vibration, stiffness of a spring, and mass on the spring. Does this equation fit your results?
- See if you can use the sensor to measure the vibration of a ruler (described in the first paragraph of the Introduction). How does the vibration frequency change as the ruler is shortened? Design an experiment to find out.
Careers
If you like this project, you might enjoy exploring these related careers: