Star light, Star bright: How Does Light Intensity Change with Distance?
Abstract
Have you ever looked up at the stars at night and wondered how fast they were moving or how far away they were? By studying how the brightness of a star changes with distance, you can answer those questions. In this astronomy science project, you'll create a model of starlight and use a sensor app with your smartphone to discover the key relationship between brightness and distance.Summary
Sabine De Brabandere, PhD, Science Buddies

Objective
To determine how the light intensity of a point source of light, like a star, changes with distance from that source.
Introduction
Do you love looking at the stars? No, not the Hollywood kind—the ones in the sky! For thousands of years, people have looked up at these faithful pinpoints of light and wondered about those "diamonds in the sky." They have used stars as centerpieces for religions, fuel for legends and myths, tools for navigation, and as predictable calendars for planting crops. In 1584, though, Giordano Bruno suggested that the stars were objects, much like the Sun, just farther away. This idea upset a lot of people, and he was actually killed for this and for other beliefs. It would take more than 250 years for people to accept that Bruno was right and take their first distance measurement from Earth to a star.
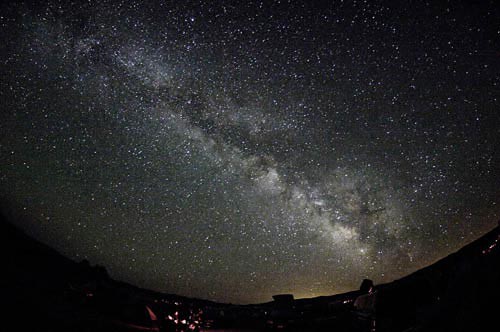 Image Credit: Kenneth Hess, Science Buddies / Science Buddies
Figure 1. A photo, taken by Science Buddies founder Kenneth Hess, of 100 billion stars in the Milky Way at the Golden State Star Party. (Kenneth L. Hess, 2009.)
To find out just how far away a star is, scientists first had to figure out how the light intensity of a point source of light, like a star, changes with distance. Light intensity is a measure of how much light falls on a certain area, like one square meter. Scientists experimented and predicted that the relationship between intensity and distance would follow an inverse-square law. This means that as the distance from a light source doubles, its light intensity decreases by a factor of four, (which is the square of the factor of change). This is illustrated in the Figure 2, where the red dot, the point source of light, has a light intensity we will name L0 for this example, at one unit (it could represent any unit) away from the light source; but as you double the distance to two units away, the intensity goes down by a factor of four. At three units away, the intensity goes down by a factor of nine, and so on.
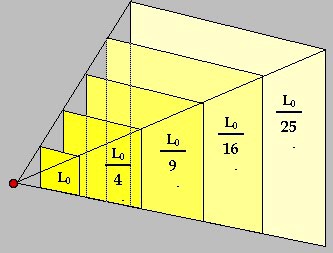 Image Credit: NASA / Public domain, government website
A point of light spreads out in an increasing pattern of squares to represent the inverse-square law. As light travels a certain distance, the intensity of the light will decrease by a square of the distance. The smallest square is closest to the point of light and is the brightest. The second light square is twice as far from the light source as the first square, so the light intensity decreases by a factor of 4. The third square is 3 times the distance as the first so the light intensity decreases by a factor of 9. The fourth square is 4 times the distance as the first so light intensity decreases by a factor of 16. Finally the last square is the least bright as it is 5 times the distance from the first and the light intensity decreases by a factor of 25.
Figure 2. This drawing shows how light follows an inverse square law. Notice that as the distance increases from the light source (the red dot), the light must spread out over a larger surface area, and the light intensity at the surface decreases by the distance squared. (NASA, 2006.)
In this astronomy science project, you will set up an experiment to re-create what scientists discovered about the relationship between light and distance. When you are done, think about what you would need to know to calculate how far away a star is from Earth.
Terms and Concepts
- Intensity
- Point source
- Inverse-square law
- Square
- Factor
- Lux (lx)
- Linear
- Inverse
Questions
- Why do you think stars are approximated as point sources, even though they are much bigger than Earth?
- Based on your research, how is it possible to measure distance of stars from changes in the light intensity of a point source?
- Can you think of any other laws that follow an inverse-square relationship?
Bibliography
This source provides a history of stars:
- Cain, F. (2009, February 10). History of Stars. Retrieved March 17, 2010.
These sources explain the inverse-square law for light and how changes in brightness can be used to measure distance and velocity (speed and direction) of a star:
- Newman, P. (2006, January 30). More on Brightness as a Function of Distance. National Aeronautics and Space Administration, Goddard Space Flight Center. Retrieved March 17, 2017.
- Newman, P. (2006, January 30). Observing the Light Intensity of M31. National Aeronautics and Space Administration, Goddard Space Flight Center. Retrieved March 17, 2017.
Materials and Equipment
- Bulb socket with cord and lightbulb (any wattage) or lamp with removable shade with a lightbulb (any wattage), detailed specifications can be found in the Procedure.
- Measuring tape
- Room that can be darkened well and cleared of objects in a 6-foot by 6-foot area
- Material to align the phone with the light source. This could be a ball of clay, an easel, a camera stand, etc.
- Graph paper
- Optional: Material to cover shiny objects. This could be black posterboard, dark colored sheets, etc.
- Smartphone with a sensor app such as phyphox, available for free on
Google Play for Android devices (version 4.0 or newer) or from the App Store for iOS devices (iOS 9.0 or newer). Note: Phyphox does not support the light sensor on iOS devices. If you need the light sensor, you have to use Android devices for your experiment. Note that on some devices the light sensor is only updated when there is a coarse change of illuminance. This means that if the light intensity does not change or only changes slightly, the sensor appears to not record any data. The recording will continue once the light intensity changes again. If your experiments allows, it helps to wiggle the phone or the light source (e.g. flashlight) slightly to induce minimal reading fluctuations and keep the sensor active.
- Lab notebook
Experimental Procedure
For this science project, you will use the light sensor of your smartphone to measure light intensity levels. Specific sensor apps such as phyphox let you record data using sensors that are built into many smartphones, including a light sensor. The light sensor measures light intensity in units of lux (lx), which is a measure of how much light falls on a certain area.
Setting Up Your Experiment
- Familiarize yourself with the sensor app and the light sensor.
- Choose a light source.
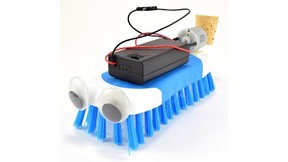
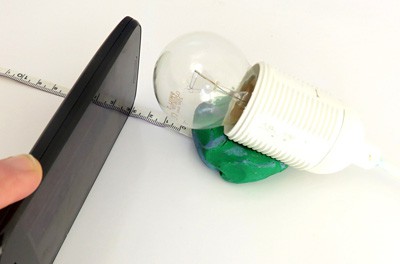
- Any type of light bulb where the light shines equally in all directions is fine as a light source. Note that if you choose a lamp, you might need to remove the lamp shade so that the bulb is exposed. Figure 3 shows some good choices of incandescent and fluorescent light bulbs. The bulbs in Figure 4 direct light forward. Those do not work effectively to model stars.
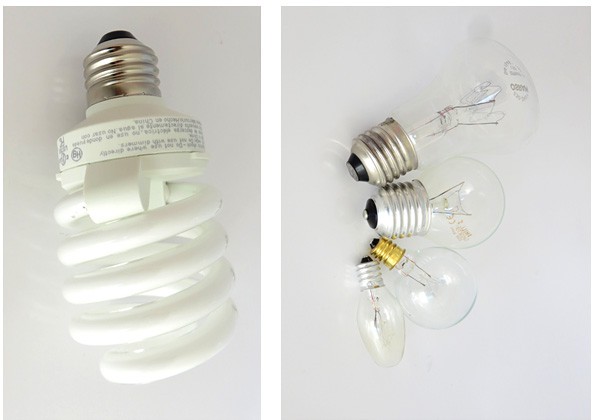 Image Credit: Sabine De Brabandere, Science Buddies / Science Buddies
Figure 3. Examples of incandescent light bulbs (right) and a fluorescent light bulb (left) that are good choices to model a star.
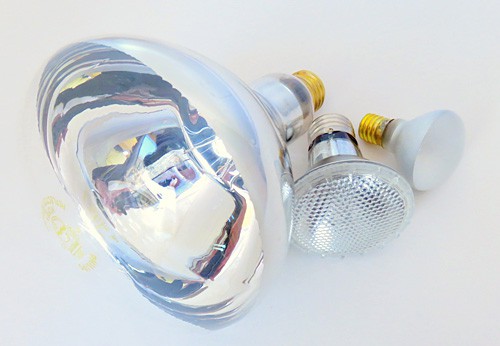 Image Credit: Sabine De Brabandere, Science Buddies / Science Buddies
Figure 4. Directional light bulbs are not good choices to model a star.
You may notice that different light bulbs with the same power rating (or watt value) can yield different lux measurements. This is because a lux measurement favors some wavelengths (colors) over others in order to mimic the human eye's perception of light, and different types of light bulbs emit different sets of wavelengths. This is not a problem for this project, as you will only use one type of bulb.
- Find a place to take measurements.
- Find an area that is approximately two by three meters in a room that can be darkened (like a room without windows or one where you can close the window blinds if there are windows). For brighter bulbs, you might need a larger space.
- Remove shiny items that can reflect light.
- Be as far as possible from walls that might reflect light.
- Cover the floor with dark poster board or a dark-colored sheet if the chosen area has shiny or light-colored floors.
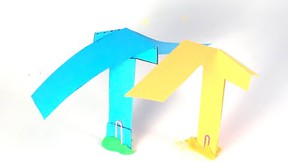
- Set up the light source, measuring tape, and phone. Figure 5 shows an example of a setup.
Some things to keep in mind when you design your setup:
- The light sensor on the phone needs to be at the same height as the light source. In the setup shown in Figure 5, this is done by placing the bulb on a ball of clay.
- Find a way to glide the phone in a controlled way towards or away from the light source. In Figure 5, the phone is resting on the ground. Other solutions are resting the phone on an easel, a camera stand, etc.
- Place the measuring tape in a way that you can easily read the distance between the light source and the light sensor.
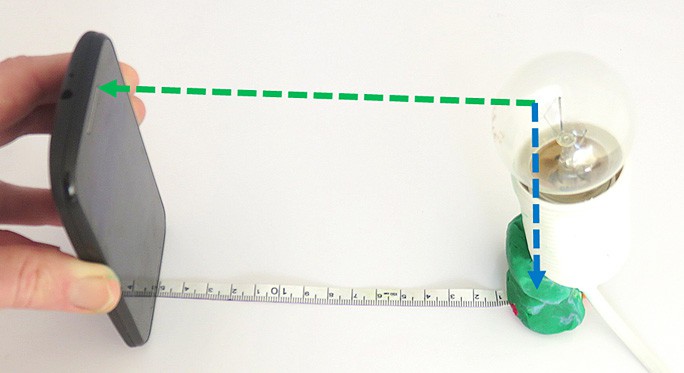 Image Credit: Sabine De Brabandere, Science Buddies / Science Buddies
Figure 5. Experimental setup to measure light intensity versus distance of a light source. Note that in your setup, the floor covering should be dark to reduce the reflection of light on the floor. The green arrow shows how the light source and the light sensor line up. The blue arrow shows that the light source is located at the 0 cm point of the measuring tape.
Measuring
- Create a table like Table 1 in your lab notebook.
| Light Intensity Measurements | ||||
|---|---|---|---|---|
| Distance from light source [cm.] | Trial 1 [lux] | Trial 2 [lux] | Trial 3 [lux] | Average of trials [lux] |
- Darken the room. Do your best to eliminate as many stray sources of light as possible. Then, turn on the light bulb. People with sensitive eyes might want to put on sunglasses. Note: Some light bulbs need a few minutes to reach their maximum brightness. Wait until the bulb's brightness is steady before you start your experiment.
- If you are using the phyphox app, open the light sensor and go to the 'Simple' tab. In this mode, the app will display the measured light intensity as a numeric value. Then, start by holding the sensor relatively close to the bulb. Remember the light sensor must always be level with the light source. Move the phone away from the light source and determine a distance where the measurement is very low and changes minimally with changing distance. This will be your starting distance.
- This step describes how to measure and record a single data point at each distance with the phyphox app in 'Simple' mode. Optionally, you can also record data continuously while moving the phone toward the light source in constant intervals, as described in the Recording Data While Moving the Phone section.
- Hold the phone at the starting distance.
- Write down the distance in your lab notebook, read the lux measurement from your phone and record the measurement value in your table.
- Move the phone 5 cm closer to the light source and repeat step b. Continue this until the light sensor is very close to the light source. To record higher-resolution data, reduce the distance between consecutive measurements from 5 to 2.5 cm.
- Note: If your values start flickering, or you get unexplained low values, this could be due to interference between the sampling frequency of the sensor (how many data points it records per second) and the flickering of the light source, which might be flickering faster than your eye can see. If this happens, try one more time. If the issue persists, switching to a different light source or a different phone usually solves the problem.
- This finishes one trial. Repeat step 4 two more times for a total of three trials.
Recording Data While Moving the Phone
Optional: As an alternative to writing down the lux values while you do the experiment, the phyphox app allows you to record how light intensity varies over time. If done as described below, you can read the measured lux values for different distances from such a graph.
- To create the graph, open the light sensor in the phyphox app and select the 'Graph' tab.
- Put your phone in place at the starting distance you determined in step 3 of section "Measuring." Write the starting distance down in your notebook.
- Press the play button in the phyphox app to start a recording.
- Move the phone 5 cm towards the light source every 10 seconds (s). Note a time axis is displayed on the phone while you are recording in graph mode.
- Press the pause button to stop recording and save your data. Make sure to label it appropriately. Do not forget to write the starting distance and the distance over which you shifted the phone every 10 s. in your notes.
- Use the graph to fill in your data table. Here are some hints:
- The first 10 seconds of your graph were taken at the starting distance from the source.
- Every 10 seconds, the phone was moved a fixed distance (e.g. 5 cm) closer to the source. Can you find a formula to find the distance to the source at any given time?
- With the 'pick data' tool in phyphox you can view the X value (elapsed time) and Y value (measured light intensity in lux) of specific data points on the graph.
- Figure 6 shows an example graph over a period of 60 seconds, where the phone was moved closer to the light source about every 10 seconds.
- To record higher resolution data, do another trial and move the phone in smaller steps (e.g. steps of 2.5 cm instead of 5 cm).
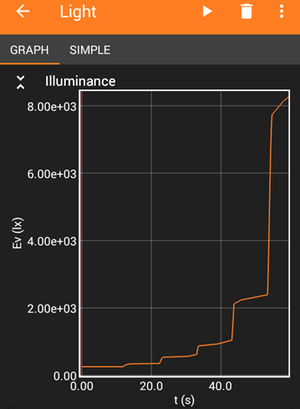 Image Credit: Sabine De Brabandere, Science Buddies / Science Buddies
The sample graph shows light intensity being measured over time with a minimum lux value of 252 and a max lux value of 8125. The plotted points rise slowly from 0 to 560 lux in the first 30 seconds and then from 560 to 2389 lux between 30 and 50 seconds. At the 50 second mark the lux values jumps from 2389 to over 8000 where the graph ends.
Figure 6. Example data from the phyphox app while moving the phone closer to the light source about every 10 seconds. The x-axis of the graph shows time in seconds [s] and the y-axis is light intensity in lux.
Analyzing Your Data Table
- Calculate the average light intensity for each distance from the three trials and record your calculations in the last column of your data table.
- Make a line graph that plots the distance (in cm) on the x-axis and the average light intensity (in lux) on the y-axis.
- Looking at your graph, can you find a relationship between light intensity and distance to the light source?
- Does light intensity increase or decrease with distance?
- Is the relationship linear, meaning you can draw one straight line so all data points are close to this line? Or does it look like the data points follow a curve?
- If it looks like a curve, is the light intensity equal to a constant divided by the distance (indicating an inverse relationship), or, is the light intensity equal to a constant divided by the distance squared (indicating an inverse-square law)?
- What happens when you get very far away from the light source? Does the law you discovered in previous steps still hold? If your law does not hold there, why could this be? Could you change your setup so the law governs a wider range of distances?
Ask an Expert
Variations
- What happens with a light source that is not a point source, but is directed, like a flashlight? Redo the project using a flashlight or other directional light. Note: Do not use a laser for this project! There is a high risk of eye damage from looking into a laser.
- In this science project, you tested one light bulb. You can also verify if the relationship holds over several types or different powers of light bulbs.
Careers
If you like this project, you might enjoy exploring these related careers:

Related Links
- Science Fair Project Guide
- Other Ideas Like This
- Astronomy Project Ideas
- Science With Your Smartphone Project Ideas
- My Favorites