Abstract
The movement of satellites is intriguing, but how do they orbit the way they do? Aerospace engineers run calculations and set up computer models to help them predict how satellites move in space, but in this astronomy science project, you will create a physical model with marbles, clay, and a cookie sheet to help you study how satellites move in space and learn from your observations.Summary
Sabine De Brabandere, PhD, Science Buddies
This project is an adaption of a 2014 science project, Juno vs Cassini, submitted by Ashleigh Nicoll while she was a student at Holly Ridge Elementary School in North Carolina.

Objective
Model the gravitational pull of a planet on satellites to observe how varying the speed of the satellite influences the altitude at which the satellite orbits.Introduction
Have you ever wondered what keeps the Moon from crashing into Earth? Or what keeps the International Space Station in space? Aerospace engineers use their knowledge of mathematics and physics to calculate the path, or trajectory, of these orbiting objects, which are called satellites. Satellites are bodies that revolve around a planet. The trajectory a satellite follows is called its orbit. In this science project, you will use a physical model you can build yourself to study the trajectory of satellites. You will be able to change the speed of the satellite, and even the mass of the planet that your satellite orbits. Before we explain the model, a basic introduction into satellite movement is helpful. It will help you make educated choices for speeds and planets.
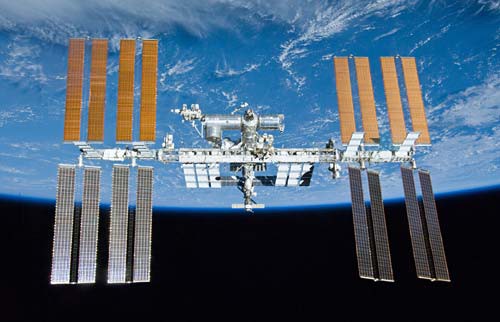
Figure 1. The International Space Station is an example of a large man-made satellite orbiting Earth
To understand why satellites move the way they do, we must look at a force called the gravitational force, often referred to as gravity. Isaac Newton stated in his masterwork, the Principia, that a gravitational pull or gravitational force exists between any two objects in the universe. This is called universal gravitation. If it were not for this pull, the concept of "falling" would not exist, as "falling" is nothing but gravity working on an object. This same gravitational force keeps a satellite in orbit near a planet. In a way, the satellite is continuously falling toward the massive planet.
Looking a little closer, we see that the gravitational force is always attractive, proportional to the mass of the objects (more massive objects create a stronger pull) and that it decreases quickly as the distance between the objects increases. In this science project, the objects you will study are a planet and a satellite, as illustrated in Figures 2 and 3.
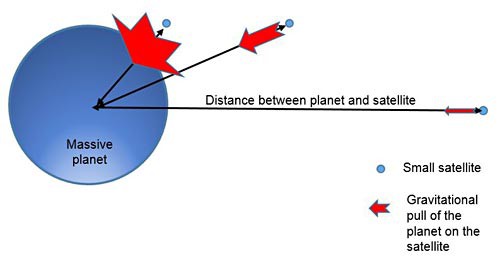 Image Credit: Sabine De Brabandere, Science Buddies / Science Buddies
As a satellite approaches the planet the gravitational force increases the closer the two objects become.
Figure 2. The gravitational force pulls the satellite and the heavy planet toward each other. A satellite farther away from the planet feels a much weaker pull than a satellite closer to the planet.
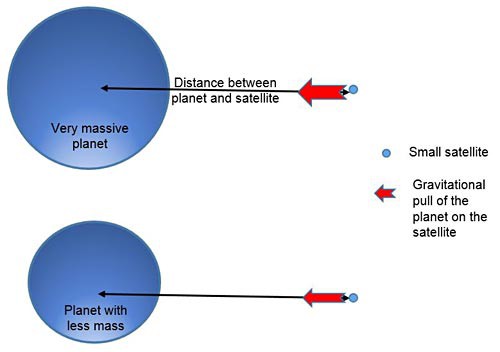 Image Credit: Sabine De Brabandere, Science Buddies / Science Buddies
Figure 3. The gravitational pull felt by a satellite is stronger when it orbits a very massive planet than when it orbits a planet of smaller mass. Note that what counts is the mass of the planet—not its radius—as the distance is measured to the center of the planet.
If it were not for this gravitational pull, objects like satellites would follow a straight line through space. The strong gravitational pull created by a nearby planet deflects the satellite from a straight trajectory toward the center of the planet, as shown in Figure 4.
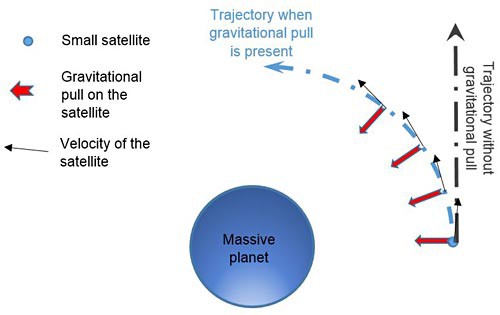 Image Credit: Sabine De Brabandere, Science Buddies / Science Buddies
Diagram showing the trajectory of a satellite in the presence of a massive planet. The gravitational pull of the planet causes the satellite to assume a curved trajectory or orbit.
Figure 4. The gravitational force of a nearby planet pulls a satellite away from its straight trajectory into a curved trajectory.
Another factor to consider in an orbiting satellite is speed. Looking at Figure 5, you will see how gravitational pull has a large effect on the orbit of slow satellites. Slow satellites might eventually crash into the planet. Gravitational pull has a smaller effect on fast-moving satellites; some fast-moving satellites might even escape the planet's gravitational pull and shoot off into space.
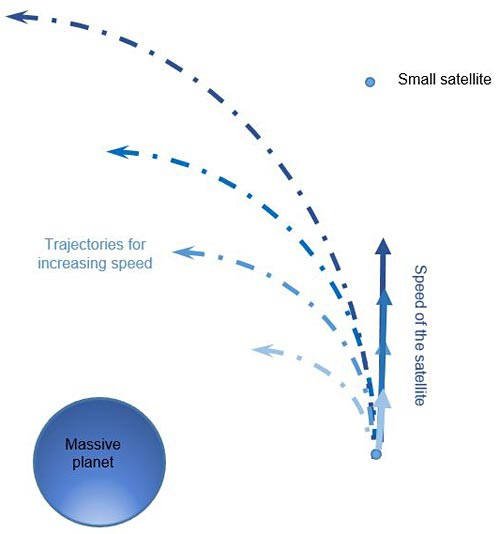 Image Credit: Sabine De Brabandere, Science Buddies / Science Buddies
Figure 5. A satellite that moves faster will get less deflected by the gravitational pull than a slower satellite. This figure shows a range from slow (light blue) to faster satellites with increasing darkness in color.
When the gravitational pull on the satellite (its tendency to fall toward the heavy planet) just balances the satellite's tendency to keep going in a straight line, the resulting orbit is either a circle or an ellipse (a shape that looks like a squashed circle). This happens at a specific speed. Astronomers call this speed the orbital velocity of the satellite.
So, in essence, a satellite's ability to maintain a closed orbit results from a balance between two factors: its speed (at which it would travel in a straight line), and the gravitational pull between the satellite and the planet it is orbiting. This balance will be different at different altitudes. The higher the orbit (larger distance between the planet and the satellite), the less speed is required to prevent the satellite from falling out of its orbit and crashing into the planet. The nearer the orbit, the faster it must move to ensure that it does not crash into the planet.
In summary, three parameters determine the ability of a satellite to maintain a closed orbit around a planet: the mass of the planet, the distance between the center of the planet and the satellite, and the speed of the satellite. Sounds great, right? Well...reality provides a couple more challenges. The gravitational pull of other nearby objects and the mass distribution within the planet are just a couple of factors that are left out of the picture. Astronomers refer to these deviations as perturbations. Nevertheless, studying the relationship created by the gravitational pull between a planet and a satellite provides a remarkably good approximation of the satellite's orbit.
The possible trajectories resulting from the mathematical problem explored above (an object like a satellite in the vicinity of a planet) are a perfect circular orbit, an elliptical orbit, a trajectory following a parabola, and a trajectory following a hyperbola. These trajectories are illustrated in Figure 6.
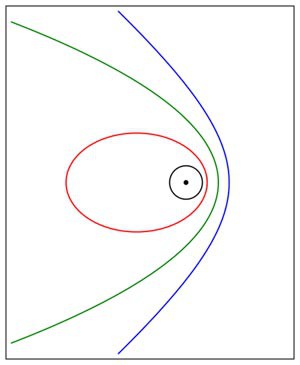 Image Credit: Wikimedia Commons / Public Domain
Looking only at the gravitational pull, the satellite will move along a path in the shape of a circle (shown in black), an ellipse (shown in red), a parabola (shown in green), or a hyperbola (shown in blue) .
Figure 6. Looking only at the gravitational pull of a nearby planet on a satellite, mathematicians can conclude the satellite will move along a path in the shape of a circle (shown in black), an ellipse (shown in red), a parabola (shown in green), or a hyperbola (shown in blue) .
When doing your research, you might notice astronomers often express the shape of the orbit in terms of the eccentricity (e) of the orbit.
- e=0 refers to a circular orbit
- 0<e<1 refers to an elliptical orbit
- e=1 refers to trajectory in the shape of a parabola
- e>1 refers to trajectory in the shape of a hyperbola
While high school-level mathematics and physics would allow you to calculate the orbital velocity given the mass of the planet and distance between the satellite and the planet for circular orbits, do not worry; you do not need these mathematical skills to get a fundamental understanding of how satellites orbit planets. In this science project, you will use a simple, homemade model to study the relationship. It will allow you to answer questions like "Can we take a satellite like Cassini—created to orbit Saturn—and let it orbit Jupiter? If so, could it orbit Jupiter with the same speed? Or could it orbit Jupiter at the same altitude?". Models are simplified representations of an object or a system in the real world. Some models exist on the computer, while others are physical replicas. Computer models are used by aerospace engineers. In this astronomy science project, you will use a physical model to study the satellite movement. You will build a model that studies the satellite's deflection due to gravity of a nearby planet. Your model will act the same as a satellite in space in important ways. You will be able to change the gravitational pull on and the speed of your satellite and observe the effect these changes have on the satellite's trajectory by observing the deviation from a straight-line trajectory.
Before you start building, it will be helpful to do some research on the planets you would like to study. Since gravitational pull is proportional to the mass of the planet, comparing the masses will inform you of how the gravitational pull of these planets compare to each other. Looking at Saturn and Jupiter—the two planets chosen for this science project—you find that as the mass of Jupiter is about 3.34 times the mass of Saturn, the gravitational pull at a given distance from the center of Jupiter will be 3.34 times stronger than the gravitational pull at the same distance from the center of Saturn. Keep this number in mind as you build your model following the instructions provided in the Procedure.
When comparing the gravitational pull on satellites that are revolving around planets, be sure to compare the gravitational pull at a given distance from the center of the planet. This is very different from comparing the gravitational pull at the surface of the planet (also called surface gravity), because the radius of the planets can be very different and the gravitational pull weakens rapidly as the distance to the center of the planet increases. For example, Saturn has approximately the same surface gravity as Earth, even though the mass of Saturn is about 95 times the mass of Earth. However, for a satellite traveling at the same distance from the center of those planets, the gravitational pull caused by Saturn is still 95 times larger than the one created by Earth, not 1.07 times, as you might mistakenly conclude when comparing surface gravity of both planets.
| Earth | Saturn | Jupiter | |
|---|---|---|---|
| Mass | 1 Earth mass | 95 Earth masses | 318 Earth masses |
| Surface Gravity | 1 Earth surface gravity | 1.07 Earth surface gravity | 2.53 Earth surface gravity |
| Mean Radius | 6,371 km | 58,232 km | 69,911 km |
Now you are ready to build your model with a marble, some clay, and a cookie sheet. Observe what happens when you increase the gravitational pull or the speed of the satellite.
Terms and Concepts
- Trajectory
- Satellite
- Orbit
- Gravitational pull
- Gravitational force
- Universal gravitation
- Orbital velocity
- Model
Questions
- Which force keeps a satellite in orbit around a planet?
- What parameters will determine if a satellite can stay in orbit around a given planet?
- Why would you use the gravitational pull at a given distance from the center of the planet and not the surface gravity when comparing the pull that different planets exert on satellites?
- Does an orbit that deviates very far from a straight trajectory have a high curvature or a low curvature? Hint: Think about the orbital shapes described in the Introduction or look back at Figure 3 and Figure 4.
- Will a closed orbit with high curvature mean the satellite orbits at a lower or higher altitude than one with small curvature?
Bibliography
- Stillman, Dan. (2014, February 20). Institute for Global Environmental Strategies. What Is a Satellite? NASA. Retrieved June 23, 2014.
- Stern, D.P. (2006, March 14). National Aeronautics Space Administration: Goddard Space Flight Center. Newton's theory of "Universal Gravitation.". Retrieved May 14, 2014.
- Brown, G. and Harris, W. (2000, May 19). How Satellites Work. HowStuffWorks. Retrieved May 14, 2014.
- The Physics Classroom. (n.d.). Newton's Law of Universal Gravitation.. Retrieved May 16, 2014.
Materials and Equipment
- Cookie sheet (14 x 20 inches); choose the type with a rim on only one side, like the one available from Amazon.com
- Finger-paint paper (3 sheets), 15 cm x 40 cm or bigger; available at your local craft store or from Amazon.com
- Tape, such as masking tape or clear tape
- Metric ruler
- Pencil
- Scissors
- Cardboard tube, like the inner tube of a roll of paper towels
- Modeling clay (used to elevate your tube and cookie sheet); available from craft stores
- Newspaper or other paper to protect your workplace
- Marble
- Lids of plastic food containers, to serve as paint palettes (6)
- Disposable gloves
- Liquid food coloring (15 drops each of yellow, blue, and red)
- Cloths or paper towels
- Lab notebook
Disclaimer: Science Buddies participates in affiliate programs with Home Science Tools, Amazon.com, Carolina Biological, and Jameco Electronics. Proceeds from the affiliate programs help support Science Buddies, a 501(c)(3) public charity, and keep our resources free for everyone. Our top priority is student learning. If you have any comments (positive or negative) related to purchases you've made for science projects from recommendations on our site, please let us know. Write to us at scibuddy@sciencebuddies.org.
Experimental Procedure
In this astronomy science project, you will use a model to study the trajectory of a satellite when varying its speed or the mass of the planet it orbits. An example of the satellite trajectory model you will build is shown in Figure 7.
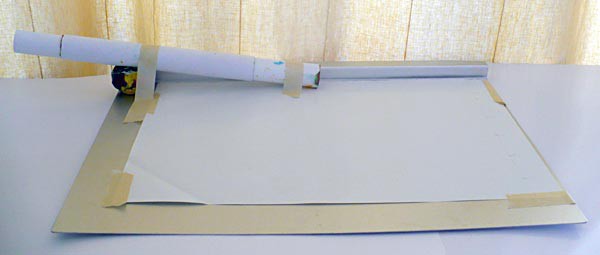 Image Credit: Sabine De Brabandere, Science Buddies / Science Buddies
Figure 7. A finished satellite launcher used to study the trajectory of satellites as they revolve around planets.
You will roll a marble down a paper tube onto a cookie sheet. Tilting the cookie sheet will cause the marble to skew to one side, simulating the gravitational pull of a planet. A larger slope simulates a bigger gravitational pull. Changing the slope of the tube will change the initial speed of the marble, simulating different satellite speeds. First, you will set up your model and test if it works the way you want it to work. Only then can you use your model to find answers to your questions.r
Setting Up a Satellite Trajectory Model
- Create a trajectory panel:
- Set the cookie sheet down, with the long, rimmed edge farthest from you. Place one sheet of finger-paint paper on your cookie sheet, aligning it with the long, rimmed side and the right side, as shown in Figure 8.
- Attach the piece of paper with tape to the cookie sheet.
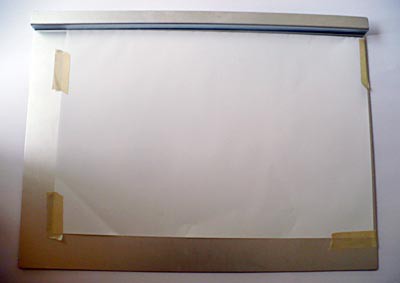 Image Credit: Sabine De Brabandere, Science Buddies / Science Buddies
Figure 8. Place the paper on the cookie sheet so it lines up with the rimmed edge and the right edge of the cookie sheet.
- Add the measuring indicators to your trajectory panel:
- Draw a pencil line on the top of your paper, parallel to and 2 cm below the rimmed edge of your cookie sheet. This line will be referred to as the horizontal track line.
- Draw a line parallel to the right edge of your paper that is 3 cm from the edge. You will read the deviation from a straight trajectory on this line.
- Create marks on your vertical line to help read the deviation from a straight trajectory:
- Write "0" where the line you drew in step 2.a. and the line you drew in step 2.b. intersect.
- From the 0 point down, draw small horizontal marks every centimeter and bigger marks every 5 cm.
- Add numbers to the bigger marks.
- Mark the spot on the horizontal track line that is 23 cm from the right side of your cookie sheet. The launch tube will end at that location.
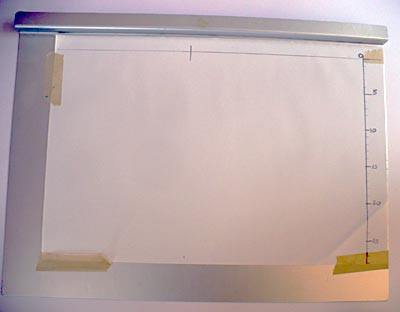 Image Credit: Sabine De Brabandere, Science Buddies / Science Buddies
Figure 9. A vertical line with measuring marks will help you read the deviation from a straight trajectory.
- Create a tube to launch your satellite (marble):
- Take a second piece of finger-paint paper.
- Cut off one end so the paper becomes a rectangle that is 40 cm long.
- Roll this paper lengthwise and slide it inside the cardboard tube to create a tube of length 40 cm, as shown in Figure 10.
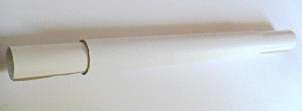 Image Credit: Sabine De Brabandere, Science Buddies / Science Buddies
Figure 10. A rolled-up paper held in place by a cardboard tube is used as a launch tube.
- Put the launch tube in place: The elevation difference between the two ends of your launch tube will give your satellite varying speeds. You will use clay to create an elevation difference of 5 cm from one end of the 40 cm launch tube to the other. Use Figure 11 to guide you as you place your tube.
- Form a ball of clay that is approximately 5 cm in diameter.
- Place the ball near the left edge of your cookie sheet on the horizontal track line.
- Push the middle of the clay ball down a little to create a U shape that is the width of the launch tube. The "U" should be facing the short left edge of your cookie sheet.
- Let the launch tube rest in the U shape of the clay ball, with one end of the tube on the mark indicated in step 2.d.
- Measure the elevation of the left end of the tube, as shown in Figure 11.
- It is easiest to measure the elevation difference over the length of the tube by comparing the elevation of the lowest points of each end of the tube. Note that the lowest point of the right end is at elevation 0, resting on the cookie sheet.
- Hold your metric ruler perpendicular to the elevated tube end, then place a pencil horizontally just below that tube end to measure the elevation.
- Adjust the clay ball until the elevation gain over the length of the tube is 5 cm.
- The U shape of the clay should keep the tube solidly in place, but you should add tape to secure the tube to the cookie sheet so it keeps its position.
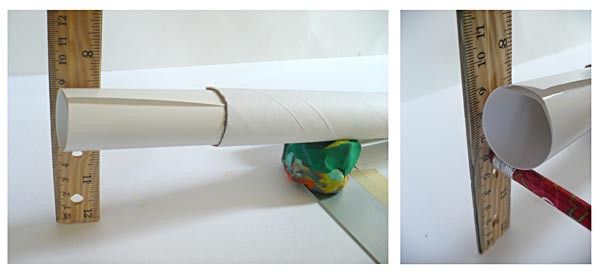 Image Credit: Sabine De Brabandere, Science Buddies / Science Buddies
Figure 11. The launch tube is supported by a U-shaped lump of clay placed on the left side of the cookie sheet. A pencil helps accurately measure the elevation gain over the length of the launch tube.
- Create your elevation blocks to elevate the launch side of the cookie sheet. Elevating this side of the cookie sheet will create a downward pull on the launched satellite (marble), modeling the gravitational pull from a nearby planet. Skip past the next few images to see an example of the elevated blocks in Figure 15.
- Use clay to form two identical pillars that are each 4 cm high. These will model a medium gravitational pull, like the pull created by Saturn.
- Form two identical pillars that are 12 cm high. These will model a strong gravitational pull like the pull created by Jupiter. Note: If you find it hard to create stable 12 cm high pillars with the clay, you can use a cup or glass and add clay below or on top (to hold the cookie sheet in place) to create a 12 cm high pillar.
The table summarizes the parts of the satellite trajectory model and what they represent in space. Keep it nearby as you launch your satellites (marbles) and try to understand how the model works.
| Satellite Trajectory Model | |
|---|---|
| Part of the Model | What It Represents |
| Marble | Satellite |
| Track on paper | Trajectory of the satellite |
Measured deviation from a straight track:
|
Measurement of how much the satellite's trajectory deflects from a straight trajectory:
|
Height of one end of the cookie sheet:
|
Gravitational pull of a nearby planet:
|
Elevation difference over the length of the launch tube:
|
Speed of the satellite:
|
Testing Your Satellite Trajectory Model
To test if the model does model real-life trajectories of satellites well, you will:
- Fine-tune your model to represent that the satellite's trajectory follows a straight line when no gravitational pull is present.
- Observe if the satellite's trajectory shows an increasing deviation from the straight-line trajectory with increasing gravitational pull.
- First, fine-tune using the "no gravity present" (zero gravity) situation:
- If it isn't already, put the cookie sheet flat on your workspace to model the case where no gravity is present.
- Take a marble and launch this satellite by letting it roll through the tube. For an ideal launch, you should:
- Release the marble on the "floor" of your circular tube so it takes a straight path down inside the tube; in other words, do not drop the marble inside the tube, but place it on the inside edge and let it roll.
- Release the marble without giving it an extra boost so you do not increase the speed of the satellite as it exits the tube.
- Observe if the marble rolled along a straight line parallel to the edge of the cookie sheet edge. If not, evaluate if you need to:
- Adjust your tube so it points straight out, parallel to the cookie sheet edge, or
- Practice releasing the marble from the position described in step 1.b.
Repeat steps 1.b and 1.c. until your satellite consistently follows a straight line when released. Note that trajectories are made visible in Figure 12 to illustrate how trajectories should look when no gravity is present.
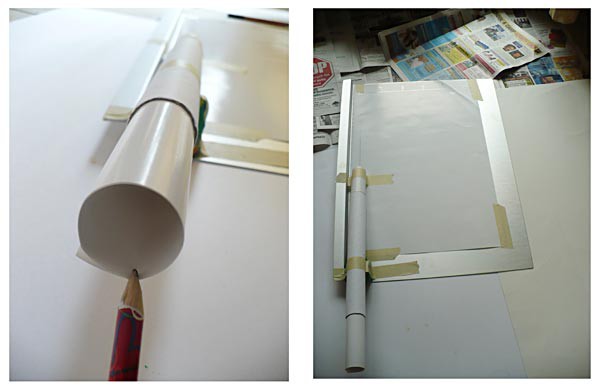 Image Credit: Sabine De Brabandere, Science Buddies / Science Buddies
Figure 12. Pencil indicating from where to release the marble so it follows a straight path down the launch tube (left) and the satellite trajectory model ready to be used (right).
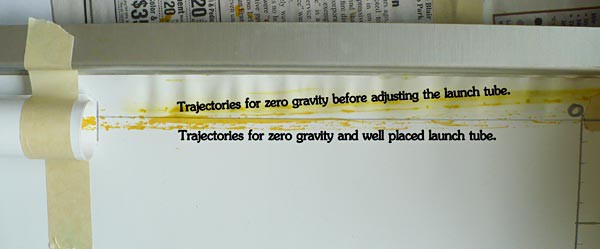 Image Credit: Sabine De Brabandere, Science Buddies / Science Buddies
Figure 13. Illustration of trajectories created for zero gravity by launching marbles in a misaligned launch tube (top yellow lines) and in a well-placed launch tube (bottom yellow lines).
- As shown in Figure 13, above, you will use colored tracks to observe the various paths your satellites take. To create the colored tracks:
- Take three plastic lids, pour some yellow liquid food coloring in the first, blue in the second and a mixture of yellow and blue in the third (to create a green color). An example is shown in Figure 14.
- Have your marble and some paper towels handy.
- Place some protective paper (such as newspaper) at the end of the cookie sheet to collect the colored marble as it rolls off the cookie sheet, as can be seen in Figure 12, above. Try to ensure the marble continues to roll away from the cookie sheet so it does not roll or bounce back and create a "roll back" track on your finger-paint paper.
- Put on the gloves.
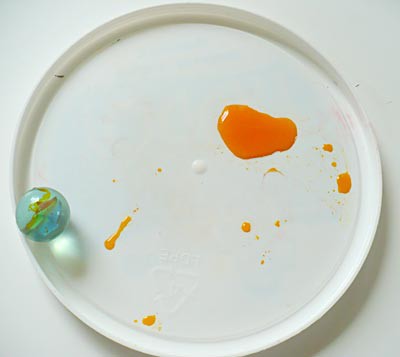 Image Credit: Sabine De Brabandere, Science Buddies / Science Buddies
Figure 14. Marble trajectories are created by first rolling the marbles in food coloring, as shown in this picture.
- Create the "zero gravity tracks" in yellow:
- Roll a marble in the yellow food coloring. Make sure it has food coloring all over it, but does not drip.
- Launch this marble.
- Pick up the marble and put it back on the yellow food coloring tray.
- Wait for about 30 seconds so the food coloring in the cardboard tube and on the paper can dry.
- Repeat steps 3.a.–3.d. three times for a total of four launched satellites in the zero-gravity circumstances.
- If one launch exactly follows the track of a previous launch, use a pencil to keep track of the number of launches that followed that track by placing a tally mark next to the track.
- Clean your marble with paper towels.
- Wait at least 1 minute before launching marbles of a different color (see step 4) so all the color inside the cardboard tube and on the paper can dry.
- Create the "Trajectories deflected by Saturn" in green:
- Place the 4 cm pillars under the long, rimmed side of the cookie sheet to which the launch tube is attached. Make sure your cookie sheet is stable. Figure 15 will help you visualize how to place the pillars. This elevation will create a downward pull on the marble, deflecting it from a straight-line trajectory. This models the deflection due to a nearby planet.
- Repeat steps 3.a.–3.g. using green food coloring this time.
- Observe the tracks being deflected from a straight trajectory. Is that in alignment with what you expected?
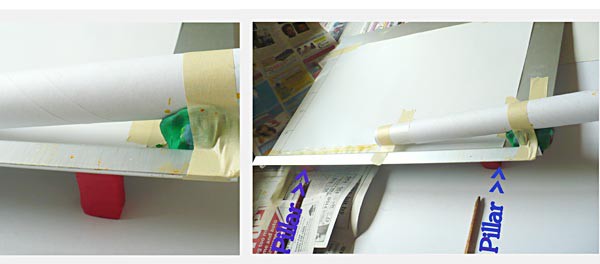 Image Credit: Sabine De Brabandere, Science Buddies / Science Buddies
Figure 15. Pillars elevate one side of the cookie sheet to model the gravitational pull on satellites near a planet.
- Create the "Trajectories deflected by Jupiter" in blue:
- Switch the 4 cm high pillars for the 12 cm high pillars. This elevation models a stronger gravitational pull of a planet like Jupiter nearby.
- Repeat steps 3.a.–3.g., now using blue food coloring.
- Are these tracks more deflected than the green tracks? Is this in line with what you expected?
- Check if your model represents reality. Figure 16 can help you with this task.
- Check if the yellow tracks (representing the "zero gravity present" situation) creates straight trajectories.
- Verify if the blue and green trajectories (created when gravity is present) show a deviation from the straight line.
- Verify if the blue trajectories (created with the largest gravitational pull used in this model) show the largest deviation from the straight line.
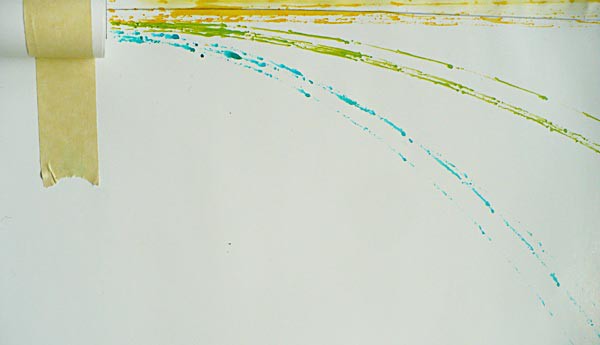 Image Credit: Sabine De Brabandere, Science Buddies / Science Buddies
Figure 16. Results showing that the model acts the same as a satellite in space in important ways.
Studying the Effect of Changing Speed
Once you are sure your model works well, you can use it to study the effect of changing speed on the deflection of trajectories.
- Create a larger elevation difference over the length of the launch tube. The speed of your marble (satellite) as it comes out of the launch tube depends on the difference in height between the two ends of the launch tube. You will increase this difference from 5 cm to 10 cm.
- Remove the tape holding your launch tube so you can lift the left end of the tube.
- Add a chunk of clay under the U-shaped clay ball currently supporting your launch tube.
- Measure the elevation difference of the tube, as shown in Figure 11, above.
- Adjust until the elevation difference over the length of the tube equals 10 cm.
- Secure the launch tube with tape.
- Take three more clean plastic lids, pour some red liquid food coloring in the first, create a mixture of red and blue in the second (to create a purple color) and yellow with a drop of red in a third (to create a light orange).
- Create the "Trajectories for a high-speed satellite deflected by the planet Jupiter" in red:
- Make sure you still have the 12 cm high pillars in place, modeling a strong gravitational pull, like the one from planet Jupiter.
- Repeat steps 3.a.–3.g. from the previous section Testing Your Satellite Trajectory Model, now using red food coloring.
- What do you observe?
- Create the "Trajectories for a high-speed satellite deflected by the planet Saturn" in purple:
- Switch to 4 cm high pillars, modeling a medium gravitational pull, like the one from planet Saturn.
- Repeat steps 3.a.–3.g. from the previous section Testing Your Satellite Trajectory Model, now using purple food coloring.
- Create the "Trajectories for high-speed satellites when no gravity is present" in orange:
- Remove the pillars so the cookie sheet lays flat, modeling the absence of gravitational pull (zero gravity).
- Repeat steps 3.a.–3.g. from the previous section Testing Your Satellite Trajectory Model, now using orange food coloring.
Analyzing Your Data
- Once you are done creating trajectories, remove your paper from the cookie sheet. Do not forget to add a legend explaining the color code used.
- Copy the data table in your lab notebook.
| Speed: Near planet: |
Low speed, None |
Low speed, Saturn |
Low speed, Jupiter |
High speed, None |
High speed, Saturn |
High speed, Jupiter |
|---|---|---|---|---|---|---|
| Color code | Yellow | Green | Blue | Orange | Purple | Red |
| Trial 1 | ||||||
| Trial 2 | ||||||
| Trial 3 | ||||||
| Trial 4 | ||||||
| Mean |
- Measure the deviations of the "no gravity present" trajectories:
- Measure the deviations of each of the four yellow trajectories (tracks).
- Record your measurements in the second column of your data table.
- Calculate the mean value of your four measurements and record it in the last line of your table. Note: If this number (your mean deviation for the case without gravity) is not 0 (or almost zero), you will need to correct all further deviation readings for this "offset". You do this by subtracting the value you just calculated (the mean deviation for the case of zero gravity) from each reading.
- Repeat step 3 for the green, blue, orange, purple, and red trajectories (columns 3–7).
- Create a graphical representation of your measurements:
- Create graphs showing how the deviation changes with changing gravitational pull, keeping the speed constant.
- Use the mean data from "low speed" columns of your data table.
- Graph the deviation on the vertical (y) axis and the level of gravitational pull on the horizontal (x) axis.
- Does this graph support that your model works in important ways like satellites in space do?
- Repeat this graph using the "high speed" columns of your table. Do you see the same trend of increasing deviation with increasing gravitational pull?
- Optional: Add the trails data with a different, smaller mark to your graph.
- Create graphs showing how the deviation changes with changing speed, keeping the gravitational pull constant.
- Graph the mean deviation on the vertical (y) axis and the level of speed setting on the horizontal (x) axis. Start with the trials where gravity is absent (yellow and orange tracks).
- Create the same graph for the trials where a medium gravitational pull (like Saturn) is present (green and purple tracks) and high gravitational pull (like Jupiter) is present (blue and red tracks).
- Do these graphs support what you expected?
- Optional: Add the trails data with a different, smaller mark to your graph.
- Create graphs showing how the deviation changes with changing gravitational pull, keeping the speed constant.
Additional Information
Although this model works well, it is important to note that it is not an exact miniature replica of the real thing. The Introduction mentioned leaving out any perturbations. In addition, the gravitational pull created by elevating one side of the cookie sheet always creates a downward pull (toward the center of Earth). Because your marble track is very short, this direction is essentially constant. However, a satellite travels a very long trajectory through space. The gravitational pull it feels is also directed to the center of the planet, but changes as it travels through space. Because of this, your marble will always follow a parabolic trajectory, while a real satellite in orbit can follow a circular, an elliptical, a parabolic, or a hyperbolic path. As shown in Figure 17, this model works when you study only the part of the trajectory close to the launch point. In this science project, the border of your paper limits you to studying only the part of the trajectory that is relatively close to the launch point.
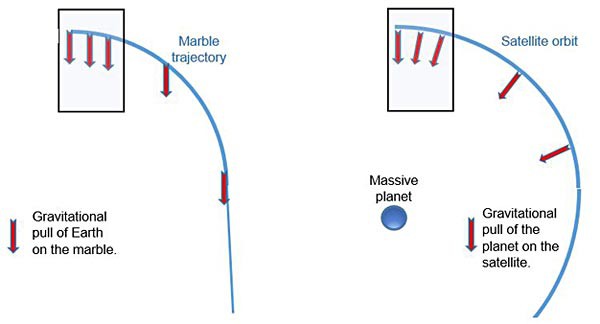 Image Credit: Sabine De Brabandere, Science Buddies / Science Buddies
Figure 17. Gravitation of Earth pulls the marble in your model straight down, as shown on the left. This represents the gravitational pull of a planet on a satellite shown on the right. The representation only holds when looking at a limited area close to the launch point of the marble, as indicated by the rectangle.
Note also that the gravitational pull felt by the marble is essentially constant in value since there is a negligible variation in the distance of the marble to the center of Earth. This is also the case for a satellite in circular orbit around a planet. It is not the case, however, for an elliptical orbit or a parabolic or hyperbolic path. In those cases, the varying distance from the center of the planet will cause the force of gravity acting on the satellite to change not only in direction but also in value. The relationships between mass of the planet, altitude, and velocity found in this science project will still hold, but the altitude and velocity will constantly change along the path of the satellite.
As a last note, when you lift one side of the cookie sheet much more than 12 cm in order to model a larger gravitational pull, your model (as described in this science project) might not work as well. As you lift the cookie sheet, your launch tube moves out of the vertical plane and the effective elevation gain over the length of the tube (which creates the speed) changes. You will need to adapt your model so the vertical elevation gain over the length of your tube stays constant as you lift the cookie sheet.
Ask an Expert
Global Connections
The United Nations Sustainable Development Goals (UNSDGs) are a blueprint to achieve a better and more sustainable future for all.

Variations
- This science project used Saturn and Jupiter as example planets. Choose a different set of planets and see how their gravitational pulls compare. Can you use your model to study satellites orbiting these planets?
- This science project studies how the altitude of a satellite's orbit changes with changing velocity. Could this model be used to prove that a satellite orbiting Saturn at a given altitude can be placed in orbit around Jupiter at the same altitude? In this case, you keep the curvature or the track (deviation from a straight line) constant and try to find a speed so the deviation from the straight line when high gravitational pull is present (like Jupiter) equals the deviation from the straight line for a different speed and lower gravitational pull (like the one created by Saturn). How do those speeds compare?
- In this science project, you measured the deviation from a straight line to identify the shape of the trajectory. You can also measure the curvature of the track by measuring its radius, assuming the first section of the trajectory is perfectly circular. The radius represents the distance from the satellite to the center of the planet it orbits. To do this:
- Draw a vertical line down from the end of your tube, just to where the trajectories of the satellites start.
- Take a piece of yarn that is about 15 cm long.
- Lay your piece of yarn on the line, vertically, from the start of the trajectories down.
- Place your thumb somewhere on the yarn to hold that point fixed, as shown in Figure 18. You will test if that point would be the center of a trajectory on your paper.
- Move the other end of the yarn to the right and observe if the end of the yarn follows a trajectory on your paper. If so, your thumb is at the center of this trajectory and the distance from your thumb to the end of your launch tube (or start of the trajectories) is the radius of this trajectory.
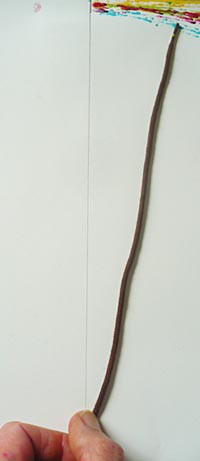 Image Credit: Sabine De Brabandere, Science Buddies / Science Buddies
Figure 18. Figure illustrating how to measure the radius of curvature of a trajectory.
- If you are familiar with the physics of circular motion and universal gravitation, you can calculate the theoretical formula for the orbit, assuming the satellite follows a circular orbit. Knowledge of potential and kinetic energy will allow you to calculate how the speeds for different elevation gains over the launch tube compare. You could see if the data obtained from your model follow your theoretical expectations, and maybe find areas where you could improve your model.
Careers
If you like this project, you might enjoy exploring these related careers:

Related Links
- Science Fair Project Guide
- Other Ideas Like This
- Astronomy Project Ideas
- Space Exploration Project Ideas
- My Favorites