Abstract
Would it surprise you to learn that no one knows the exact age of the universe? Astronomers have estimates, and as they gather increasingly precise data and measurements, they continue to refine those estimates to come up with more accurate estimates. In this project, you can look at data about stars in dense groups called globular clusters and come up with your own estimate for the minimum age of the universe. How closely will your estimate match those of other astronomers?Summary
Edited by Sandra Slutz, PhD, Science Buddies

Objective
Use information about the stars found in globular clusters to determine the ages of the clusters and, in turn, estimate the minimum age of the universe.
Introduction
If you want to know how old someone is, you could probably just ask them. But what if they could not, or would not, tell you? You could probably figure out a couple of different ways to estimate their age. For example, you could use the average age of their classmates as an estimate. Or, if you knew they had a younger brother who was 10 and an older sister who was 13 you could conclude that their age was between 10 and 13 years old. Similarly, astronomers can use a number of methods to estimate the age of the universe.
One method of figuring out the minimum age of the universe is to calculate the ages of some of the oldest stars in the universe. To understand the merits of this method, you need to know something about the history of the universe. Data suggests that the universe was born with an event known as the Big Bang; in a single moment all the heat, matter, and energy that makes up the universe exploded into being. Since that moment, the universe has continued to evolve—the temperatures have cooled, and some of the matter has redistributed and formed stars, planets, and other celestial bodies. This means that even the oldest stars were formed after the universe was first created. So, if you figure out the age of the oldest stars, you know the minimum age of the universe. Just like you know, from the example above, that the person's age is, at minimum, 10 years old since their brother, who is younger, is already 10 years old.
Astronomers have discovered that some of the oldest stars are often found in globular clusters. Globular clusters are tightly bound groups of stars. In fact, as you can see by looking at the M80 globular cluster in Figure 1, there are so many stars in one place that in the center of the cluster it can be hard to distinguish one star from another! The stars within a globular cluster are all approximately the same age because they all developed at the same time from the same gas cloud. This is similar to a litter of puppies— because they all developed at the same time from the same mother, they’re the same approximate age. But just like the puppies in a litter can be very different from one another in looks and behavior, so can the stars in a globular cluster. In fact, a globular cluster can have many different types of stars. To understand more about star types, you first need to know a little bit about the evolution of stars.
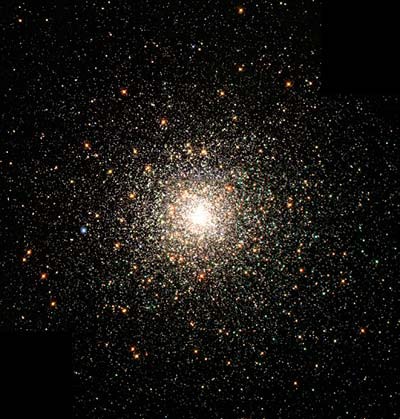
Figure 1. The M80 globular cluster is composed of more than half a million stars. (Image courtesy of NASA)
All stars start off with the same evolutionary path: they form from a stellar gas cloud, spend billions of years as main-sequence stars, burning their fuel and giving off light, then, as they die, they turn into either red giants or red supergiants. As seen in Figure 2, their death sequence from a red giant or supergiant can end in several different forms, including either white dwarf, neutron star, or black hole. In this astronomy project, you will mainly be interested in the time a star spends as a main-sequence star. This is the majority of the star's lifetime, when it is actively burning fuel. Main-sequence stars are further characterized by their mass (size), temperature, luminosity (brightness), color, and other characteristics. These characteristics are used to split the stars into seven spectral (star) classifications, as seen in Table 1. In general, the more massive the star, the faster it burns through its fuel. This means that it "turns off" the main sequence and moves on to being a red giant or supergiant sooner. In Table 1, this is called the turnoff age. For example, an O class star will turn off the main sequence after less than 40 million years, whereas the smaller G-class stars, like our Sun, live much longer and stay on the main sequence for at least 9.3 billion years, and, depending on the star's exact characteristics, up to 15.6 billion years. In general, larger stars burn brighter, hotter, look bluer, and live shorter lives, while smaller stars burn for a longer period of time, at a cooler temperature, give off less light, and look redder.
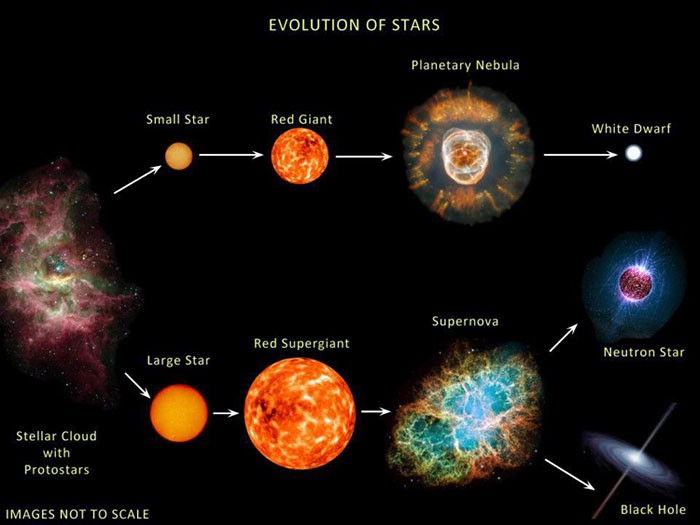 Image Credit: NASA, Chandra Xray Observatory / http://chandra.si.edu/photo/image_use.html
A diagram shows the lifecycle of various stars which all begin from a stellar cloud with protostars. The top of the diagram shows a small star created from a stellar cloud, the small star turns into a red giant, then into a planetary nebula and finally ending up as a white dwarf. The bottom of the diagram shows a large star created from a stellar cloud, the large star turns into a red supergiant, then into a supernova. The supernova can either turn into a neutron star or a black hole.
Figure 2. This graphic shows how stars evolve from a stellar cloud, to a star, then a red giant or supergiant before their death sequence as a nebula or supernova. (Images courtesy of NASA/CXC/SAO)
| Spectral Classification | Apparent Color | G-R Color | Luminosity* | Temperature** | Turnoff Age |
|---|---|---|---|---|---|
| O | Blue | -1.0 to -0.5 | > 30,000 | > 30,000 | < 40 million years |
| B | Light blue | -0.5 to -0.3 | 25,000–30,000 | 10,000–30,000 | 40 million–2.3 billion years |
| A | White | -0.2 to 0.2 | 5–25 | 7,500–10,000 | 2.3–5.1 billion years |
| F | Light yellow | 0.2 to 0.3 | 1.5–5 | 6,000–7,500 | 5.1–9.3 billion years |
| G | Yellow | 0.3 to 0.6 | 0.6–1.5 | 5,200–6,000 | 9.3–15.6 billion years |
| K | Orange | 0.6 to 1.4 | 0.08–0.6 | 3,700–5,200 | 15.6–49.4 billion years‡ |
| M | Red | 1.4 to 2.0 | < 0.08 | 2,400–3,700 | >49.4 billion years‡ |
**In degrees Kelvin (= Celsius + 273)
‡The lowest mass, reddish stars will be on the main sequence for longer than the current age of the universe.
To figure out how old a globular cluster is, you can take a look at the stars in the cluster and figure out which class of stars is currently leaving the main sequence. If B-class stars are currently leaving, then you know, from Table 1, that the globular cluster is between 40 million and 2.3 billion years old; if F-class stars are leaving the main sequence, you know the globular cluster is between 5.1 and 9.3 billion years old. To identify the class of stars currently leaving the main sequence, you start by creating a Hertzsprung-Russell diagram, or H-R diagram, for the globular cluster. H-R diagrams are created by plotting a group of stars' brightness (also called luminosity) versus their color. Figure 3 shows an example of an H-R diagram. The diagonal strip on the H-R diagram is where the main-sequence stars are found. Looking at the main sequence on an H-R diagram, you can see the turnoff point, highlighted in green in Figure 3, where stars turn off the main sequence and transition to red giants or supergiants. The luminosity and G-R color of the stars at the turnoff point allow you to determine the stars' class. An important note is that if a globular cluster is very young, the stars may not have had time to leave the main sequence yet! This would result in an indistinct or completely missing turnoff point.
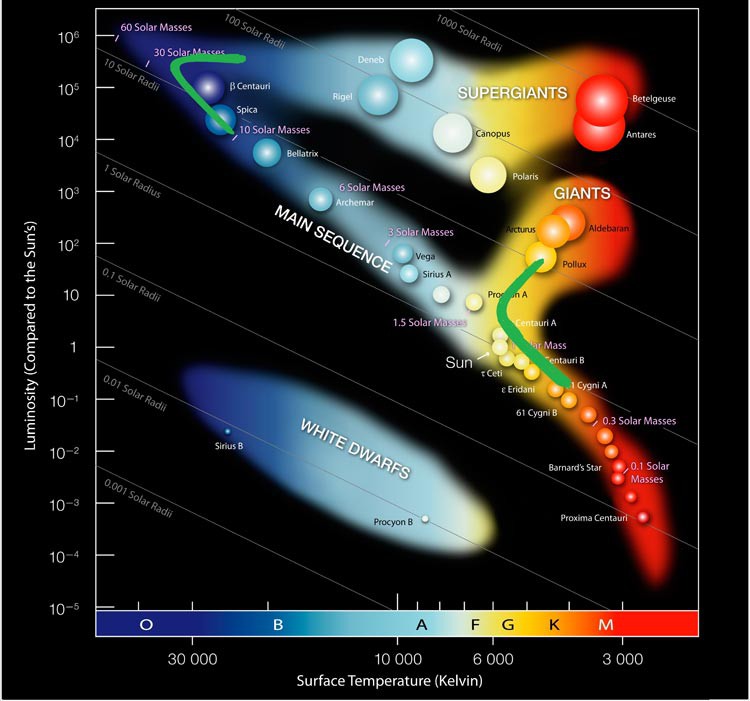 Image Credit: Adapted from http://www.eso.org/public/images/eso0728c/ / Original photo in public domain from European Southern Observatory
Hertzsprung-Russell diagram shows the luminosity and temperature of stars (with luminosity on the y-axis and temperature plotted on the x-axis). White dwarf stars fall in the bottom-left of the graph (being less bright and hot than other stars). Supergiant and giant stars fall in the top-right of the graph (as they are much brighter and hotter than other stars). The diagram also shows a band of stars (labeled Main Sequence) with decreasing luminosity and increasing temperature falling an a diagonal line across the plot.
Figure 3. Example of an H-R diagram. Note that the turnoff points have been marked with green curved lines. (Image adapted from a European Southern Observatory diagram.)
In this science project, you will create H-R diagrams for several globular clusters, determine their turnoff points, and use that information to estimate the age of each globular cluster. Do you think the clusters will have similar or different ages? What is the age of the oldest globular cluster in your sample? What does this suggest about the minimum age of the universe? How does this compare to other astronomers' estimates of the universe's age?
Terms and Concepts
- Big Bang theory
- Globular clusters
- Main sequence
- Hertzsprung-Russell diagram (also known as an H-R diagram)
- Turnoff point
- Right ascension
- Declination
Questions
- Do the stars in a globular cluster have similar or different ages?
- When do stars leave the main sequence?
- What characteristics are used to assign stars to spectral classes?
- What methods have astronomers used to estimate the age of the universe? How old do astronomers think the universe is?
Bibliography
- Howell, E. (2015, June 22). What Is the Big Bang Theory? Space.com. Retrieved July 30, 2015.
- NASA. (2012, December 21). How Old is the Universe? Universe 101: Our Universe. Retrieved July 30, 2015.
- Palma, C. (2014). Measuring the Age of a Star Cluster. Penn State Department of Astronomy & Astrophysics: Astro 801. Retrieved July 30, 2015.
Materials and Equipment
- Computer with Internet access
- Spreadsheet program, like Microsoft Excel
- Lab notebook
Experimental Procedure
To get you started, Table 2 contains several globular clusters. You will use these globular clusters to create your own H-R diagrams, and identify the class of stars at the turnoff point for each cluster. This will, in turn, tell you the age range for the stars in the cluster.
Collecting Globular Cluster Data
- Choose a star cluster from Table 2 and make note of its celestial coordinates.
| Star Cluster Name | Ra (in degrees) | Dec (in degrees) |
|---|---|---|
| NGC 2401 | 112.35168 | -13.96623 |
| NGC 2420 | 114.59958 | 21.57409 |
| Pal 5 | 229.02208 | -0.11139 |
The way globular clusters are located in the sky is through the use of the celestial coordinate system, using right ascension and declination. These two coordinate types are analogous to longitude and latitude on Earth.
- Use the Internet to access the Sloan Digital Sky Survey image-finding tool.
- As shown in Figure 4, input the right ascension and declination in the area circled in blue and click the blue "Get Image" button, circled in red. Then checkmark the boxes "Grid" and "Label," circled in green. You may also need to zoom in or out to get a better view of your globular cluster; this feature is also within the red circle.
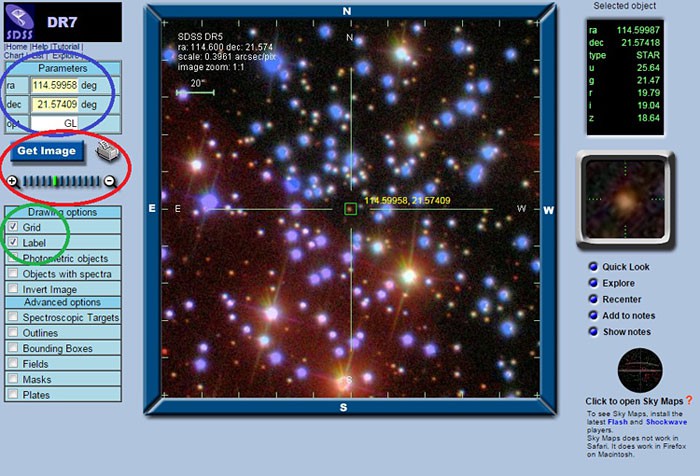 Image Credit: Sloan Digital Sky Survey , Science Buddies / Science Buddies
The Sloan Digital Sky Survey image-finding tool can be found online and shows an image of stars in space. On the left side of the webpage there are parameters where right ascensions and declinations can be changed in degrees. Beneath the parameter box there is a large blue button labeled "Get Image" that is used to find an image based on preset parameters. Beneath the Get Image button are image settings that can be changed, the settings for "Grid" and "Label" are checked.
Figure 4. In this screenshot from the Sloan Digital Sky Survey image-finding tool, the fields you will have to adjust to find a globular cluster are circled in blue, red, and green.
- Using the length scale in the top left corner of the image, estimate the size in arcminutes (see Technical Note #2) of the globular cluster. The size will likely be in the range of 1.5' to 3.0'. Make a note of how big the cluster is in arcminutes, and take a screenshot of the cluster (using the print screen on your keyboard), with the image zoomed as near to the size of the cluster as possible.
Just like the solar system or galaxy has a size, globular clusters also have a size. This is recorded in units called arcminutes and arcseconds. There are 60 arcseconds in 1 arcminute and the larger a globular cluster appears to be in the sky, the more arcminutes across it is. The arcminute symbol is denoted by an apostrophe (') and arc seconds by end quotation marks ("). Of the objects you can see with the naked eye, the Sun is around 31' in size, the Moon is around 30', and Jupiter is around 40'.
- Now use the Internet to access the Sloan Digital Sky Survey radial tool. You will use this tool to download a CSV file (spreadsheet file) containing the data about the globular cluster. As shown in Figure 5, input the size of the globular cluster you just estimated into the area circled in blue. Change the number of rows to "all rows," as shown in the green circle. Finally, change the "Format" to "CSV," as shown in the red circle, and click the "Submit" button, also within the green circle, to download the file.
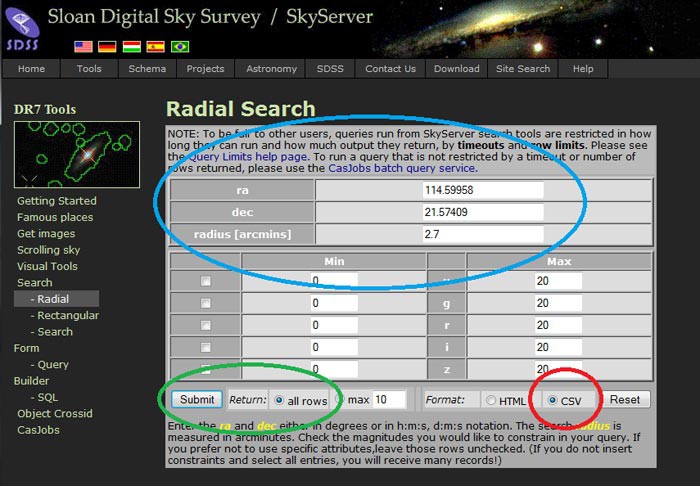 Image Credit: Sloan Digital Sky Survey , Science Buddies / Science Buddies
The Sloan Digital Sky Survey radial tool can be found online and will produce a spreadsheet of data regarding star clusters. At the center of the webpage there are parameters where right ascensions, declinations and a radius can be changed in degrees and arcmins. The sky survey tool also includes min and max settings, a submit button, and settings to print specfic rows and specific file formats. In this example screenshot right ascensions are set to 114.59958, declinations are set to 21.57409, radius is set to 2.7, all rows are selected and the format is set to .csv.
Figure 5. In this screenshot of the Sloan Digital Sky Survey radial tool, the fields you will have to adjust to download the globular cluster data are circled in blue, red, and green.
Make an H-R Diagram
Important Note: The instructions given here assume you are using Microsoft Excel version 2010. It is possible to use other versions of Microsoft Excel, as well as other spreadsheet programs, but you will have to adjust your actions accordingly.
- Open the CSV file in Microsoft Excel. Each row has information about a different star in the cluster; each column contains a different type of information about the star. For this project, you will want to use all of the stars (rows) available, but only some of the data (columns) for each star. The important data for this project is the color magnitude values of each star in the globular cluster. These colors are given in the columns labeled u, g, r, i, , and z. Scroll down to the bottom of the file and make a note of the number of the last row.
- Make a new column in the spreadsheet where you will fill in the color of each star. Calculate the color by subtracting the r value for a star from the g value (g-r = star color). If you do not know how to do this, look it up in the Help function of Excel, or ask someone who is familiar with Excel. After you have calculated the color for each star, save the file and continue with the next step.
- Here you will construct the H-R diagram with the plotting feature in Microsoft Excel.
- Highlight any two adjacent columns. On the top bar, click "Insert" then click "Scatter" for a scatter-point plot, and select "Scatter with only markers" to create a plot with only the points. Now you will need to add the data you want to the plot. Remember, an H-R diagram has star luminosity (g) on the y-axis and star color (g-r) on the x-axis.
- Right-click the plot area and click "Select Data." Click the "Add" button and click the small chart button to the right of "Series X values" and highlight the entire color (g-r) column, then click the small chart button again. Next, click the small chart button to the right of the "Series Y values" and highlight the entire luminosity (g) column and click the small chart button again. You have just assigned star color to the x-axis and star luminosity to the y-axis.
- Now you will change the x and y axes to complete the H-R diagram. Double-click on the numbers on the y-axis to bring up the "Format axes" box. Under "Axis Options," change the "Minimum" and "Maximum" values to get a useful zoom on the data points. Avoid letting the x and y axes go into negative numbers. Check the "Values in reverse order" box. Double-click on the numbers on the x-axis and adjust the zoom there, too. You can also change the axis name and the plot title by clicking on them. The y-axis should be labeled "star luminosity (g)" and the x-axis should be labeled "star color (g-r)".
- Can you find the turnoff point on your H-R diagram? If there are too few points, go back to the radial search tool website and increase the number of arcminutes. If there are too many points, and the plot looks messy, reduce the number of arcminutes in the radial search tool.
Match Your Turnoff Point to a Star Classification
- Once you have identified the location of the turnoff point on the H-R diagram, determine the star luminosity (y-axis) and star color (x-axis) values for the turnoff point. Record these in a data table in your lab notebook.
- Refer back to Table 1 in the Introduction. What class of stars has a luminosity and color range that matches the stars at the turnoff point? Record the star class and the turnoff age range in your data table. The globular cluster's age is equivalent to the turnoff age range.
- Repeat all steps for the other two globular clusters and compare the ages of all three clusters. Based on your sample, do globular clusters all have similar ages? What is the minimum age of the oldest cluster? What is the maximum age of the oldest cluster in your sample?
- What is the minimum age of the universe based on your globular cluster samples? How does this age compare to other estimations astronomers have made of the universe's age?
Ask an Expert
Global Connections
The United Nations Sustainable Development Goals (UNSDGs) are a blueprint to achieve a better and more sustainable future for all.

Variations
- Try this project using additional globular clusters. You can find a list of star clusters in this paper. How does the additional data change your estimate of the minimum age of the universe? Does the data tell you anything about when most globular clusters formed?
- If you are interested in learning more about globular clusters and what they teach astronomers about the universe, you may want to try one or both of these projects: The Milky Way and Beyond: Globular Clusters and Finding the Center of the Milky Way Galaxy Using Globular Star Clusters.
Careers
If you like this project, you might enjoy exploring these related careers:


Related Links
- Science Fair Project Guide
- Other Ideas Like This
- Astronomy Project Ideas
- Big Data Project Ideas
- My Favorites