Abstract
Landslides are powerful geological events that happen suddenly, causing fear in people who live in areas with unstable hills, slopes, and cliff sides. Landslides damage the surrounding habitat and can destroy homes in their path. But what causes landslides? Can slides happen on any slope, or do slopes have to have certain characteristics, such as a steep angle and a specific material mass? In this geology science project, you will learn about the different types of landslides and the characteristics of slopes and masses that unleash landslides.Summary
Michelle Maranowski, PhD, and Teisha Rowland, PhD, Science Buddies
This project is based on the exercise published at this website: http://schools.ednet.ns.ca/avrsb/993/jadams1/Geog10/Geog10Docs/Geo%2010%20Assignments/103_Lab3_Landslides&MassWasting.pdf
- LEGO is a registered trademark of the LEGO Group.

Objective
Set up a model hill and investigate how friction affects the slope angle at which a landslide occurs.
Introduction
The central coast of California, home of Big Sur, is famous for its rugged beauty. Walking through Julia Pfeiffer Burns State Park, you will see McWay Falls, an 80-foot waterfall spilling onto a sandy beach and into the Pacific Ocean. The interesting thing is that before 1983, the beach did not exist and the waterfall flowed directly into the ocean. How did a beach form so quickly? In April of 1983, a massive landslide involving tons of dirt and rock crashed down the steep hill just north of the park closing the coastal highway for almost a year. Repairs to the area pushed another several million cubic yards of debris into the ocean, and due to ocean currents, much of this debris settled into coves south of the landslide, creating the beach at McWay Falls. Figure 1 shows McWay Falls and its beach.
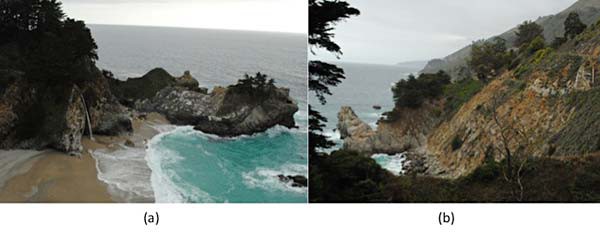 Image Credit: United States Geological Survey / Public domain
Figure 1. McWay Falls and beach (a) as seen in 2013; the location of the landslide that was the source of the material for the beach is shown in (b).
While it is fascinating to watch geological forces form and restructure the surface of Earth, the flip side is that they can be very hazardous. Landslides may cause 25 to 50 deaths in a year in the United States and billions of dollars in economic losses, in addition to changing the environment and damaging surrounding habitats. What are landslides and what causes them? The term landslide is a catch-all phrase that describes any geological process resulting in a downward movement from a slope of rock, soil, artificial fill, or a combination of the three under the influence of gravity. Landslides can result from several causes, including mechanical weathering (the gradual disintegration of rock due to physical activity), chemical weathering (the gradual disintegration of rock due to chemical activity), erosion (the removal of rock or soil by wind, water, or other natural processes), earthquakes, and volcanic activity. Figure 2 shows an example of a devastating landslide caused by an earthquake. Watch this video of a dramatic landslide.
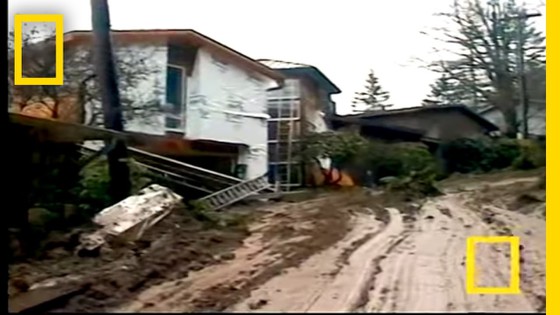
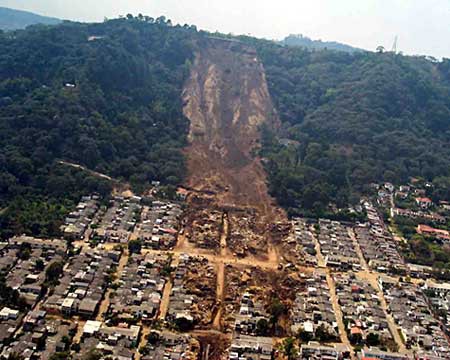
Figure 2. This landslide in the town of Colonia Las Colinas in El Salvador occurred on January 13, 2001, and buried houses under tons of earth. Hundreds of people died in this slide. (USGS, 2010.)
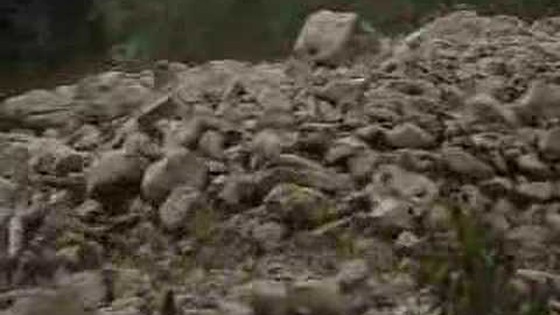
There are five main different types of landslides: slides, flows, falls, topples, and lateral spreads. Depending on the type of landslide, solid parts of the slope (such as rocks, debris, or soil) might slide down a slope, or fall off a cliff, as a unit or in several units (this happens in slides, falls, and topples). Alternatively, material might move down the slope like a river, as a collection of loose soil, rock, air, and water (such as in flows). An example of this is shown in the video. Soil can even liquefy, due to an earthquake or other rapid motion nearby, and this may cause any material above the liquefied soil to become unstable, creating a spreading type of landslide (called a lateral spread).
Although different kinds of landslides or mass movements of earth behave differently, they have a major force in common that helps initiate them: gravity. We normally think of gravity pulling an object vertically down, but when that object is on a slope, it gets just a bit more complicated. A force (like gravity) has both magnitude and direction. On a slope, the effect of gravity can be separated into a component that is parallel to the slope and a component that is perpendicular to the slope, as shown in Figure 3. This means that part of the force of gravity pulls an object down the slope and part pulls it against the surface of the slope, resisting movement down the slope.
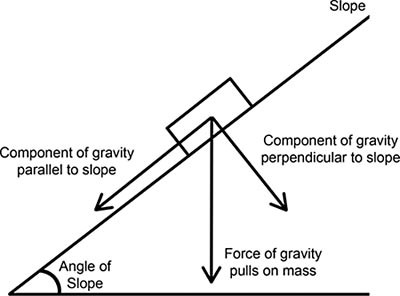 Image Credit: Teisha Rowland, Science Buddies / Science Buddies
An object resting on a slope has the force of gravity pulling it down towards the center of the Earth. In this diagram the force of gravity is separated into two components: a force pulling parallel to the slope and a force pulling perpendicular to the slope. Those two component forces of gravity are equal to the inital force of gravity pulling the object downward.
Figure 3. On a slope, the force of gravity can be separated in two components: the component parallel to the slope and the component perpendicular to the slope.
As shown in Figure 3, and Figure 4, every slope has an angle. As the angle of the slope increases, the component of gravity parallel to the slope increases and the force pulling the object down the slope becomes greater. At the same time, the component of gravity perpendicular to the slope pushing the object against the surface decreases, leading to a smaller resistance for downward movement.
This resistance is called friction. The friction that occurs depends upon the gravity perpendicular to the slope, as well as the surface of the slope and objects sliding down the slope. As you can imagine, friction happens when rough parts of a slope catch rough parts on an object sliding down the slope, as the two surfaces rub together. Just how much two types of surfaces interact with each other when rubbed together is measured by a value called the coefficient of friction, and this depends on the surface materials of the two objects.
When the component of gravity parallel to the slope becomes greater than the resistance, or friction, holding the objects on the slope in place, the objects become unstable and then slide or flow down the slope. The critical angle at which this happens is called the angle of repose.
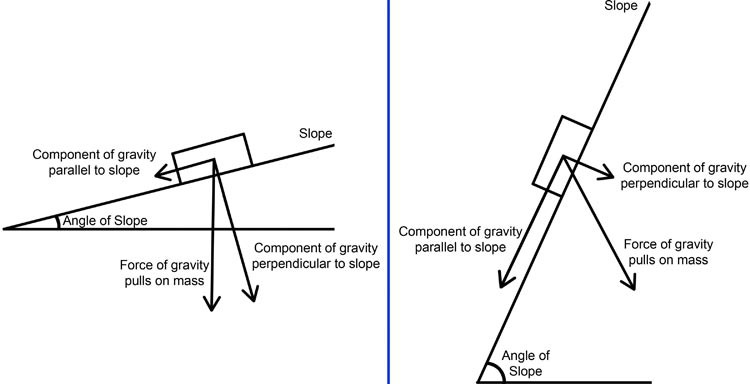 Image Credit: Teisha Rowland, Science Buddies / Science Buddies
On a low inclined slope the component force of gravity pulling perpendicular to the slope is much stronger then the forces acting parallel to the slope. This is the reverse on a very steep slope where the component of gravity parallel to the slope is much higher then the component of gravity perpendicular to the slope.
Figure 4. The magnitude of the slope-parallel and slope-perpendicular components depends upon the angle of slope. The angle of slope is less on the left side of this figure than it is on the right side. On the left side, the component of gravity that is parallel to the slope is smaller, whereas the component that is perpendicular is greater, when compared to the right side. On the left side, the object will stay in place. However, on the right side, the angle of the slope is so great that the object is much more likely to slide down the slope.
In this geology science project, you will model a landslide with a clipboard and pennies and investigate how the angle of repose changes when friction changes. The clipboard will be covered with different surfaces to alter the friction in the model landslide. Changing the surface of the slope (in this case, the clipboard) represents changes in friction on real slopes due to the presence of well-rooted vegetation and different underlying rock surfaces. Now you can start slip-sliding your way to a better understanding of landslides.
Terms and Concepts
- Landslide
- Slope
- Gravity
- Mechanical weathering
- Chemical weathering
- Erosion
- Force
- Magnitude
- Friction
- Coefficient of friction
- Angle of repose
Questions
- One source of erosion is the loss of vegetation from the slope. Why do you think the loss of vegetation can result in erosion?
- How does gravity cause an object to go down a hill?
- What factors might affect an angle of repose?
- How does friction between two objects affect how the objects move?
- How do you think landslides made out of solid objects move compared to landslides made out of fluid-like mud?
Bibliography
Here are some useful resources on landslides and related geological processes:
- KidsKnowIt Network. (n.d.). Introduction to Erosion. KidsGeo.com. Retrieved February 26, 2013.
- Schuster, R. L., and L. M. Highland. (2013, January 11). Socioeconomic and environmental impacts of landslides in the Western Hemisphere. Retrieved February 26, 2013.
- National Geographic. (n.d.). Landslides and more: Landslides 101. Retrieved March 6, 2013.
- Bapyou. (2007, July 4). Debris flow, Clear Creek County, Colorado, Spring 2003. Retrieved March 6, 2013.
Here is a resource on mass and gravity:
- Rader's Physics4Kids.com. (n.d.). Friction Basics. Retrieved January 10, 2014.
For help creating graphs, try this website:
- National Center for Education Statistics, (n.d.). Create a Graph. Retrieved June 25, 2020.
Materials and Equipment
- Table
- Pennies (4)
- Clear adhesive tape
- Optional: Metric ruler or tape measure
- Protractor
- Clipboard, hard board
- Sandpaper, any grit (1 sheet). It should be at least half as long as the clipboard.
- Paper towels (1 sheet)
- Scissors
- Lab notebook
Experimental Procedure
Make the Test Objects
- Make a taped stack of pennies.
- Take a piece of tape a little longer than the length of four pennies lined up next to each other (about 9 centimeters [cm] long) and centrally place two pennies so that they are touching, side by side, as shown in Figure 5.
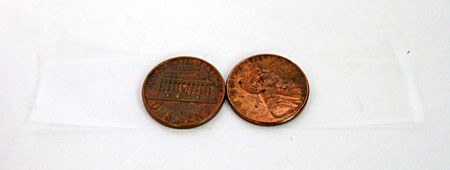 Image Credit: Teisha Rowland, Science Buddies / Science Buddies
Figure 5. Set two pennies side by side on a piece of tape (about 9 cm long).
- Set one penny on each of the pennies on the tape so that you have two stacks of two pennies each, as shown in Figure 6.
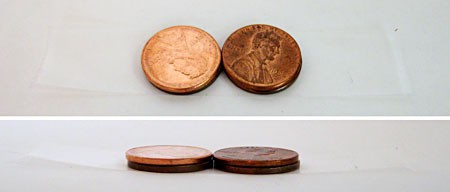 Image Credit: Teisha Rowland, Science Buddies / Science Buddies
Figure 6. Stack one penny on each of the pennies on the tape.
- Then wrap the tape long-ways completely around the pennies so that they are held in place, still stacked and side by side, as shown in Figure 7. The tape should slightly overlap on the top side.
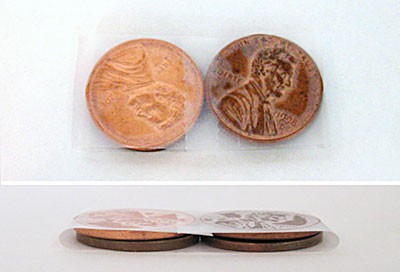 Image Credit: Teisha Rowland, Science Buddies / Science Buddies
Figure 7. Fold the tape over the pennies.
- Take a piece of tape a little longer than the length of four pennies lined up next to each other (about 9 centimeters [cm] long) and centrally place two pennies so that they are touching, side by side, as shown in Figure 5.
- Attach a strip of paper towel to the bottom of the stack of pennies.
- Cut out a strip of paper towel that is slightly longer than the length of one of the stacks of pennies, and the same width as the pennies (the strip should be about 5 cm to 6 cm long and 2 cm wide), as shown in Figure 8.
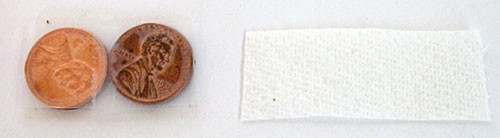 Image Credit: Teisha Rowland, Science Buddies / Science Buddies
Figure 8. Cut a small strip of paper towel that is slightly longer than the stack of pennies.
- Take the taped stack of pennies and make sure the rough, exposed tape edges are on the top, and the smooth side is on the bottom.
- Using two small pieces of tape, tape the paper towel strip long-ways on to the bottom of the stack of pennies so that both edges of the strip curve around to the top side and are taped there.
- Do not put any tape on the bottom side, which should be completely covered by the paper towel strip.
- Cut out a strip of paper towel that is slightly longer than the length of one of the stacks of pennies, and the same width as the pennies (the strip should be about 5 cm to 6 cm long and 2 cm wide), as shown in Figure 8.
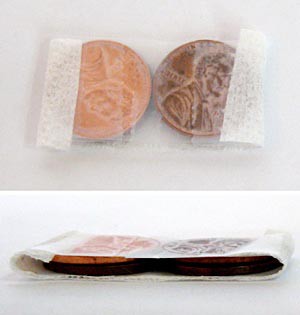 Image Credit: Teisha Rowland, Science Buddies / Science Buddies
Figure 9. You should end up with a stack of pennies with a paper towel strip on the bottom of it.
Testing the Model Landslide
- Securely tape the protractor along the edge of the table so that the zero angle mark of the protractor is aligned to the edge.
- Place the clipboard on the table so the end of the clipboard is lined up with the zero mark of the protractor. Your setup should now look similar to Figure 10.
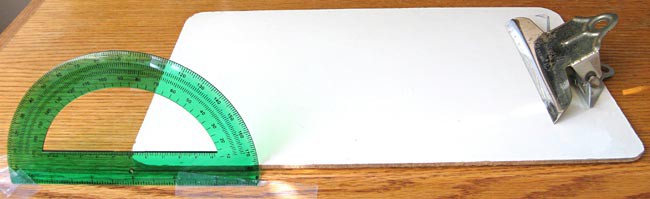 Image Credit: Teisha Rowland, Science Buddies / Science Buddies
Figure 10. Experimental setup for modeling landslides.
- Place the prepared penny stack on the clipboard, touching the clip at the top, as shown in Figure 11. Make sure the stack is placed so that the rough tape edges are facing up (and the paper towel strip is touching the clipboard).
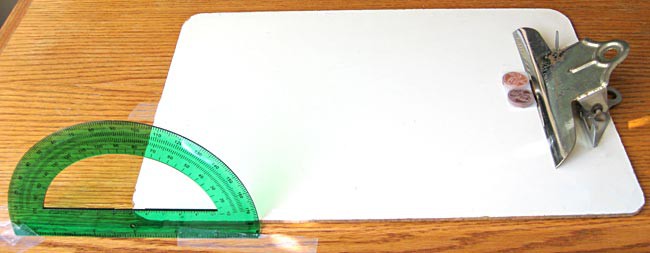 Image Credit: Teisha Rowland, Science Buddies / Science Buddies
Figure 11. Place the stack of pennies at the top of the clipboard, touching the clip.
- Holding onto the clip, slowly and steadily lift the clipboard, as shown in Figure 12, making sure to lift only one side. The bottom of the board should stay put at the zero point on the protractor.
- You can loosely tape the clipboard at the zero point or you can gently place one finger on the bottom of the board to make sure the bottom does not lift and that the bottom edge of the clipboard stays at the zero position.
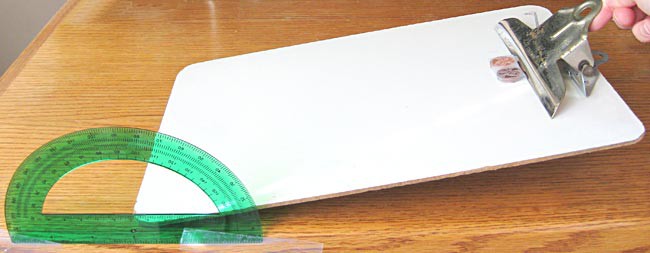 Image Credit: Teisha Rowland, Science Buddies / Science Buddies
Figure 12. Slowly lift the clipboard, making sure the bottom part of it stays in place.
- Stop tilting the board when the penny stack slides at least halfway down the clipboard. Note the angle (in degrees, or °) of the top side of the clipboard on the protractor in your lab notebook in a data table like Table 1. This is the angle of repose.
- Repeat steps 3 to 5 nine more times for a total of 10 trials. Note the angle of repose of each trial in your lab notebook in the data table you created in step 5.
| Clipboard Surface | Average Angle of Repose | |||||||||
| Trial 1 | Trial 2 | Trial 3 | Trial 4 | Trial 5 | Trial 6 | Trial 7 | Trial 8 | Trial 9 | Trial 10 | |
| Plain Clipboard | ||||||||||
| Clipboard with Paper Towel | ||||||||||
| Clipboard with Sandpaper | ||||||||||
- Now take a paper towel sheet and clip it onto the clipboard. (If the sheet has a rectangle cut out of it, arrange it so that the rectangle is at the bottom.) Using a paper towel mimics added resistance forces on a real slope. Resistance forces could be vegetation or different kinds of underlying rock.
- Repeat steps 3 through 6 with the penny stack, but this time slide it down the paper towel sheet. Lift the clipboard in the same way and with the same speed as in steps 3 through 6. Record all of the data in your lab notebook. Note any differences that you see in how the penny stack moves down the paper towel surface compared to the bare clipboard surface.
- Lastly remove the paper towel from the clipboard, take a sandpaper sheet, and clip it onto the clipboard. Using a sheet of sandpaper mimics adding more resistance forces on a real slope.
- Repeat steps 3 through 6 with the penny stack, but this time slide it down the sandpaper sheet. Lift the clipboard in the same way and with the same speed as you did previously. Record all of the data in your lab notebook.
Analyzing Your Data
- Average the angles of repose for each clipboard surface (separately) over the ten trials. In your lab notebook, record the data in a data table like Table 2.
- For example, if in the ten trials for the plain clipboard you got angles of repose of 20°, 21°, 20°, 19°, 21°, 20°, 20°, 19°, 22°, 21°, the average angle of repose would be 20° (since that is the sum of these numbers divided by ten, which is the total number of trials).
| Clipboard Surface | Average Angle of Repose |
| Plain Clipboard | |
| Clipboard with Paper Towel | |
| Clipboard with Sandpaper |
- Make a bar graph using the data from Table 2.
- You can plot your data on graph paper, or you could make your graph using a computer program like Create a Graph.
- Label the x-axis (the horizontal axis) "Clipboard Surface" and the y-axis (the vertical axis) "Average Angle of Repose."
- Analyze your graph. Do you see a correlation between the average angle of repose and the clipboard surface? Based on your data, do you think the surface of the slope affects the angle of repose? Is your data in agreement with what you expected? Can you explain your results in terms of friction?
- If you think of the plain clipboard as a sandy hill, the paper towel covered clipboard as a rocky hill with some grass, and the sandpaper covered clipboard as a hill covered in dense vegetation, what can you extrapolate about hill coverings and the likelihood of landslides? What role would the slope of the hill play in the likelihood of a landslide?
Ask an Expert
Global Connections
The United Nations Sustainable Development Goals (UNSDGs) are a blueprint to achieve a better and more sustainable future for all.

Variations
- Does changing the surface of the stack of pennies change the angle of repose? You could repeat this experiment but this time try a tape-only penny stack (without paper towel taped to the bottom) and/or a penny stack that has a strip of sand paper taped on the bottom. How do your results compare? Are you surprised by them?
- Would the angle of repose change if you changed the mass and/or size of the stack of pennies? You could try changing this and repeat the experiment.
- You could try this activity with other objects and see if you get similar results. For example, you could make objects from LEGOs™ and redo the science project. Do you see similar trends compared with data you collected the first time?
- Change the grit of the sandpaper and redo the science project. Does the grit affect the angle of repose or not?
Careers
If you like this project, you might enjoy exploring these related careers:


Related Links
- Science Fair Project Guide
- Other Ideas Like This
- Environmental Engineering Project Ideas
- My Favorites