Abstract
Here is an interesting project that could be approached from several different scientific angles: Environmental Science, Weather & Atmosphere, Chemistry, or Plant Biology. You can probably think of your own variations to emphasize the scientific area that most interests you.Summary
Andrew Olson, Ph.D., Science Buddies
Sources
This project was based on:
- Allison, J.R., 2003. It's Raining, It's Pouring, the Radishes Are Growing: Chemical Analysis of Rainwater for the Nation's Food Production, California State Science Fair Project Abstract. Retrieved July 15, 2021.
Objective
The goal of this project is to assess the water quality of rainwater collected from different geographical areas. The water quality measures used in this project are hardness, pH, and plant growth. Additional measures could be chosen to expand this project.
Introduction

Is the chemistry of rainwater from different geographical regions similar or different? How does rainwater chemistry relate to that of local surface water? How is rainwater chemistry affected by large-scale weather patterns? Does rainwater chemistry affect the growth of plants? These are some of the many questions you could choose to pursue with this project.
This project is based on Jonathan Allison's 2003 California State Science Fair entry. Here is how Jonathan summarized his experimental procedure: "I contacted friends and family from 11 different cities in the United States and asked them if they could help me by collecting rainwater from their city. After they collected it, they shipped it back to me. Then I tested the rainwater for hardness, using the chemical process of titration. Next I tested the rainwater for pH levels. Then I planted radish seeds in potting soil and watered each set of seedlings with rainwater from a different city. I observed, measured and recorded any growth or changes daily for seven days." (Allison, 2003)
Water Hardness
Water hardness is a measure of dissolved compounds (e.g., magnesium carbonate, calcium carbonate) in the water. These compounds can precipitate out in boilers and water heaters (scaling). Hard water makes less suds with soap and detergent, so you need to use more soap and detergent to get clothes and dishes clean with hard water. General guidelines for classification of waters are: 0 to 60 mg/L (milligrams per liter) as calcium carbonate is classified as soft; 61 to 120 mg/L as moderately hard; 121 to 180 mg/L as hard; and more than 180 mg/L as very hard (USGS, date unknown).
Figures 1 and 2 show USGS water hardness data for the continental United States. Figure 1 is a histogram showing the mean hardness data for each of the 344 stations sampled. Figure 2 is a map of the U.S., showing the regional patterns of groundwater hardness. In both cases, the data is from 1975, but the patterns shown have proven to be stable over time.
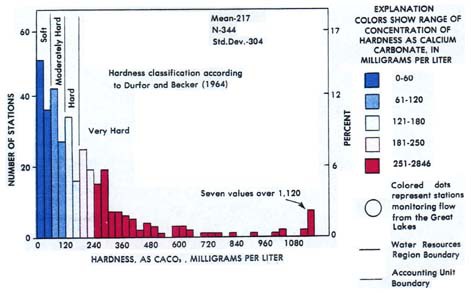 Image Credit: United States Geological Survey / public domain
Chart showing water hardness from 344 collection stations across the United States in 1975. Approximately 90 stations had soft water conditions, while 70 stations were moderately hard, 45 were hard, and the remaining 139 were very hard. 7 stations reported values of over 1.120 milligrams of calcium carbonate per liter which was the hardest level reported.
Figure 1. Histogram of U.S. groundwater hardness from 344 collection stations (USGS, 1975 data).
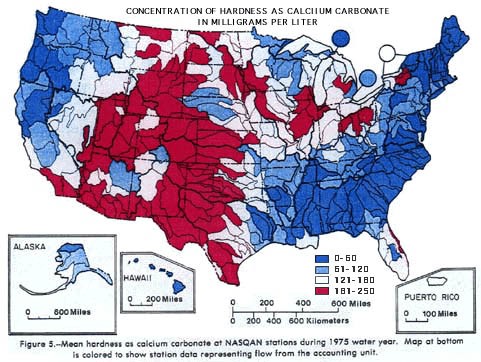 Image Credit: United States Geological Survey / public domain
Map showing water hardness from 344 collection stations across the United States in 1975. The groundwater hardness levels are elevated to above 151 mg/l in the mid-west region of the continental United States reaching from the northern most areas of North Dakota to the southrn most tip of Texas and extending west until the southern tip of California. Both the west and east coast are below 120 and 50 mg/l for water hardness with the bulk of the states with soft water stretching from northern Maine to southern Louisiana and to the east until northern Florida.
Figure 2. Map of U.S. groundwater hardness from 344 collection stations (USGS, 1975 data).
pH
Acidity and alkalinity are measured with a logarithmic scale called pH. pH is the negative logarithm of the hydrogen ion concentration:
pH = −log [H+] .
What this equation means is for each 1-unit change in pH, the hydrogen ion concentration changes ten-fold. Pure water has a neutral pH of 7. pH values lower than 7 are acidic, and pH values higher than 7 are alkaline (basic). Table 1 has examples of substances with different pH values (Decelles, 2002; Environment Canada, 2002; EPA, date unknown).
| pH Value | H+ Concentration Relative to Pure Water |
Example |
| 0 | 10 000 000 | battery acid |
| 1 | 1 000 000 | sulfuric acid |
| 2 | 100 000 | lemon juice, vinegar |
| 3 | 10 000 | orange juice, soda |
| 4 | 1 000 | tomato juice, acid rain |
| 5 | 100 | black coffee, bananas |
| 6 | 10 | urine, milk |
| 7 | 1 | pure water |
| 8 | 0.1 | sea water, eggs |
| 9 | 0.01 | baking soda |
| 10 | 0.001 | Great Salt Lake, milk of magnesia |
| 11 | 0.000 1 | ammonia solution |
| 12 | 0.000 01 | soapy water |
| 13 | 0.000 001 | bleach, oven cleaner |
| 14 | 0.000 000 1 | liquid drain cleaner |
Figure 3 shows a map of the average pH of precipitation in the continental U.S. for the year 1992. "The areas of greatest acidity (lowest pH values) are located in the Northeastern United States. This pattern of high acidity is caused by the large number of cities, the dense population, and the concentration of power and industrial plants in the Northeast. In addition, the prevailing wind direction brings storms and pollution to the Northeast from the Midwest, and dust from the soil and rocks in the Northeastern United States is less likely to neutralize acidity in the rain." (USGS, 1997)
 Image Credit: United States Geological Survey / public domain
The data from 1992 shows that the highest acidity rain, with a pH as low as 4.1, falls in the northeastern section of the United States over the states of Ohio, Pennsylvania, and New York. However, almost the entirety of the western United States is prone to less acidic rain with a pH of greater than 5.5.
Figure 3. Map of U.S. annual average precipitation pH for 1992. (USGS, 1997).
Plant Growth
Most plants prefer soil that is near neutral pH. There are particular varieties (strawberries, azaleas and rhododendrons, for example) that prefer acidic soil. Soil pH also influences how readily available many soil nutrients are to plants.
Terms and Concepts
To do this project, you should do research that enables you to understand the following terms and concepts:
- Titration
- Water hardness
- pH
More advanced students will also want to understand the following terms and concepts:
- Molarity
- Stoichiometry
Bibliography
- Wikipedia contributors, 2006. Titration, Wikipedia, The Free Encyclopedia. Retrieved May 9, 2006.
- These USGS webpages have information on patterns of water hardness of rivers and acidity in rainwater across the United States.
- USGS, date unknown. Explanation of Hardness, United States Geological Survey. Retrieved May 9, 2006.
- USGS, 1997. What Is Acid Rain? United States Geological Survey. Retrieved May 9, 2006.
- Reference on the pH scale:
- Science Buddies Staff (2012). Acids, Bases, and the pH Scale. Retrieved July 15, 2021.
- Review pages on moles:
The ChemTeam, (n.d.). The Mole Table of Contents. A Tutorial for High School Chemistry. Retrieved July 15, 2021.
Materials and Equipment
- This project requires planning ahead. Remember that it will take some time for your volunteers to collect samples and send them to you. You also need to allow time (at least one week) for the plant growth experiment once you have received all of the samples. Start early and make sure your volunteers send their samples in a timely manner!
- Where to get samples? You will need to obtain rainwater samples from a wide geographical area. Consult the maps in the Introduction for historical patterns of variation. Ask friends and relatives to collect samples for you.
- How much water do I need? Check your test kit instructions to see how much water is required for each test (usually about 5 ml). You will want to repeat your tests for each sample at least 3 times to assure that your results are consistent. So you'll need a minimum of 30 ml just for testing (best to plan on more). You will also need water for the plant growth experiment. Calculate how much water you will need for plant growth, and add 50 ml for testing purposes. This is how much rainwater each of your volunteers will have to send to you.
- How should my volunteers collect rainwater samples? Simply putting a jar out on the lawn during a rainstorm is not going to be very efficient. In order to get enough water, your volunteers need a large catchment area. Probably the most straightforward solution is to collect water from the roof, by placing a collection jar underneath a downspout.
- Make sure your volunteers label the water sample with the date and location from which it was collected.
- For performing the water quality tests, the simplest method is to use a pre-packaged kit designed for testing aquarium water. There are several different brands available. You should be able to find a choice at a local pet store that sells fish. The kit will say how many water samples it will test. You should be able to find kits to test 50 samples for about $10. The kits you need for this project are:
- General hardness (GH) test kit, available from an online supplier such as Carolina Biological, catalog #652732.
- pH test kit, available from an online supplier such as Carolina Biological, catalog #652729.
- For the plant growth experiment, you will need:
- Radish seeds, (or other suitable, fast-growing seeds)
- Small containers (peat pots or seedling trays)
- Potting soil
- A measuring device for dispensing water, such as a 10 mL graduated cylinder, which is available from online suppliers such as Carolina Biological, catalog #721610.
Disclaimer: Science Buddies participates in affiliate programs with Home Science Tools, Amazon.com, Carolina Biological, and Jameco Electronics. Proceeds from the affiliate programs help support Science Buddies, a 501(c)(3) public charity, and keep our resources free for everyone. Our top priority is student learning. If you have any comments (positive or negative) related to purchases you've made for science projects from recommendations on our site, please let us know. Write to us at scibuddy@sciencebuddies.org.
Experimental Procedure
- For the water hardness and pH tests, follow the instructions that come with the water test kit. When titrating samples, it is important to mix the solution well after each drop of test solution is added.
- For the plant growth portion of the experiment, it is important to keep all of the other growth conditions (sun exposure, soil, temperature, etc.) constant, and to vary only the source of water used for the plants. Be sure to use the same amount of water. Consult the Science Buddies resource, Measuring Plant Growth for methods you can use to quantify differences in growth.
Ask an Expert
Global Connections
The United Nations Sustainable Development Goals (UNSDGs) are a blueprint to achieve a better and more sustainable future for all.

Variations
- Does rainwater chemistry in your area vary with weather patterns? Collect samples over several weeks or months, and test the water quality. Keep track of the weather systems that produced the precipitation. Were there variations in the ultimate source of the moisture? Can you correlate these variations with changes in rainwater chemistry?
- If you live in an urban area, is rainwater chemistry affected by smog? Check the air quality reported in the newspaper for the days that samples were collected. Do you see differences in rainwater chemistry after days with high smog compared to days with cleaner air?
- For the samples in your study, how does rainwater hardness compare with groundwater hardness? (See Figure 2 in the Introduction, above.) How does the acidity compare to the 1992 U.S. data? (See Figure 3 in the Introduction, above.)
- Here is a related Science Buddies project you might want to check out:
Careers
If you like this project, you might enjoy exploring these related careers: