Abstract
Ozone in the stratosphere protects the earth by absorbing harmful ultraviolet radiation from the sun. However, when ozone occurs in the troposphere, i.e., the air that we breathe, it is harmful to health. In this project you can use data from EPA monitoring stations to analyze the weather/climate conditions that can lead to harmful ozone levels.Summary
Michelle Maranowski, PhD, Science Buddies
Objective
The goal of this project is to investigate ozone levels over time using archived data for the United States from the AIRNow website.Introduction
Ozone (chemical formula: O3) occurs naturally in the upper atmosphere (stratosphere). It absorbs potentially harmful ultraviolet radiation from the sun that would otherwise reach the earth's surface. Ozone in the stratosphere thus serves a protective function for life on earth.
In the lower atmosphere (troposphere) ozone is produced by chemical reactions from nitrogen oxides (NOx, chemical compounds with various ratios of nitrogen and oxygen) and volatile organic compounds (VOCs). A compound is said to be "volatile" if it evaporates readily at normal outside temperatures. Both heat and sunlight are also required for the chemical reactions that produce ozone. Nitrogen oxides are produced in exhaust from factories, power plants, cars, and trucks. Chemical solvents and gasoline vapors are major sources for volatile organic compounds in the atmosphere (AIRNow, 2007a).
Ozone is a highly reactive form of oxygen. The oxygen that we use for respiration (chemical formula: O2) is less reactive. Ozone can more readily form compounds with an unpaired electron in the outermost shell. These compounds, called free radicals, can cause chain reactions that cause indiscriminate damage to molecules in cells. Virtually any large molecule in the cell—proteins, carbohydrates, lipids, and DNA—can be damaged by free radicals. Enzymes (catalase, superoxide dismutases, and glutathione peroxidases) and anti-oxidant molecules from the diet (e.g., vitamins C and E) act as free radical scavengers, and protect cells from damage caused by free radicals.
Since ozone formation in the troposphere requires heat and sunlight, ozone levels are more likely to rise when the temperature is high. However, other conditions, such as an increase in the pollutants from which ozone is formed, can also lead to ozone elevation. In this project, you can use map data from the U.S. Environmental Protection Agency and other government agencies (AIRNow, 2007c) to track ozone levels in your area under different seasonal conditions to find out when ozone levels are most likely to be elevated.
Terms and Concepts
To do this project, you should do research that enables you to understand the following terms and concepts:- Ozone
- Nitrogen oxides (NOx)
- Volatile organic compounds (VOCs)
- Troposphere
- Stratosphere
- Electron
- Electron shells
- Free radical
- Parts per billion (ppb)
- Air Quality Index (AQI)
Questions
- Why is ozone in the stratosphere protective?
- Why is ozone in the troposphere harmful?
- How does ozone form in the troposphere?
- What conditions make ozone more likely to form?
Bibliography
The AIRNow website has a page with flash animations that discuss how ozone is formed, how ozone acts as a protectant high in the atmosphere but as a pollutant at ground level, and the sources and dangers of particle pollutants. http://www.airnow.gov/index.cfm?action=airnow.main- United States Environmental Protection Agency. (n.d.). AirNow: Multi-media Links. Retrieved December 3, 2010, from www.airnow.gov/index.cfm?action=movies.index
- United States Environmental Protection Agency. (n.d.). AirNow. Retrieved December 3,2010, from www.airnow.gov/
- Allen, J., 2002. The Ozone We Breathe, NASA Earth Observatory Reference. Retrieved April 20, 2007.
- United States Environmental Protection Agency. (n.d.). Ozone and Your Health,. Retrieved December 2, 2010.
- Allen, J., 2003. Watching Our Ozone Weather, NASA Earth Observatory Reference. Retrieved April 20, 2007.
Materials and Equipment
To do this experiment you will need the following materials and equipment:- Computer with Internet connection
- Color printer
Experimental Procedure
Obtaining Air Quality Data
- Do your background research so that you are knowledgeable about the terms, concepts, and questions. Steps 2-6 show you how to access archived air quality data. You can use this data to do one of the ideas listed in the Variations section, or to answer your own research question based on your background reading.
- You will be using the AIRNow, www.airnow.gov, website to gather your data, so it is wise to explore the website a bit and see what types of information the site offers.
- Now you are ready to examine ozone levels for a U.S. state or local region. To do this, go to AIRNow's Air Quality Map Archive, http://www.airnow.gov/index.cfm?action=airnow.mapsarchivecalendar. There you will see an interface similar to the one shown in Figure 1.
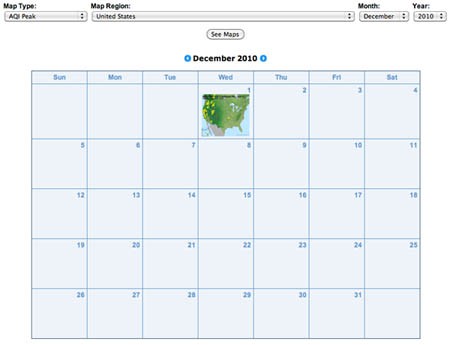 Image Credit: Screenshot of airnow.gov site
Screenshot of Air Quality Maps Archive page on airnow.gov. The page includes a calendar with a thumbnail air quality map for the United States for December 1, 2010.
Figure 1. Air Quality Maps Calendar link. - At the top of page there are three drop-down lists. Click on the Map Type list and choose Ozone Peak. Click on either your state of interest or your region of interest (if available) from the drop-down list. Then choose the month and year that you would like to investigate. Finally, click on the See Maps button in the drop down lists. In Figure 2, we are choosing to examine ozone data from San Francisco, CA during September 2010. You will see an overview of monthly thumbnails.
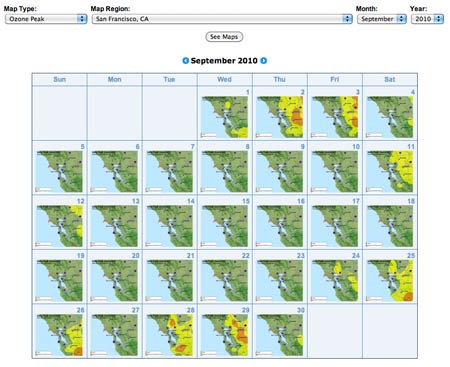 Image Credit: Screenshot of airnow.gov site
Screenshot of Air Quality Maps Archive page on airnow.gov. The page includes a calendar map thumbnails for the San Francisco Bay area for each day in September 2010.
Figure 2. An example of monthly thumbnails of ozone concentrations for San Francisco, CA. - With the monthly thumbnails, you can scan several weeks' worth of data, and select dates of interest to see maps at higher resolution. Click on any of the thumbnail maps to see the data at full size.
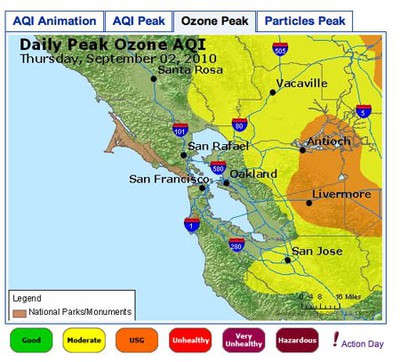
- The image in Figure 3. shows an example of an 8-Hour Average Peak Concentration map. The data is from the San Francisco Bay Area, for September 2, 2010. The map shows the highest concentration of ozone for each monitoring area during the course of the day. The legend for the colors used on the map is shown at the bottom. The peak for each area can occur at a different time of day, so the data is not necessarily from any single time point during the day. To understand how this is calculated, you can read the explanation on this page: airnow.supportportal.com/ics/support/default.asp?deptID=23002. You can also view an animated loop of the air quality index (AQI) for time points throughout the day by clicking on the leftmost tab.
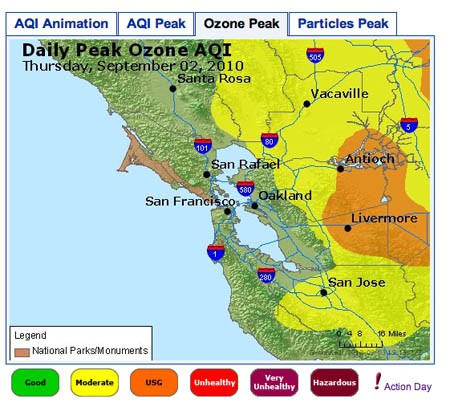 Image Credit: Screenshot of airnow.gov site
Air quality map for San Francisco Bay Area showing daily peak ozone concentrations for September 2, 2010. The map shows that the highest concentrations of ozone were found in Antioch and Livermore, while moderate levels of ozone were found extending beyond Vacaville and San Jose.
Figure 3. An example of 8-Hour Average Peak Concentration Map.
Ask an Expert
Global Connections
The United Nations Sustainable Development Goals (UNSDGs) are a blueprint to achieve a better and more sustainable future for all.

Variations
- Are there seasonal variations in ozone concentrations? For example, you could compare ozone levels in winter months vs. summer months.
- Sometimes the local climate can vary markedly within a small geographic area. For example, in the San Francisco Bay Area (see the map, above) there are dozens of local microclimates. You have the Pacific Ocean, the San Francisco Bay, and coastal mountain ranges all in close proximity. The air tends to be cooler near the ocean and the bay, and rises rapidly in summer months as you move inland. What effect(s) do you see in your area that may be attributable to local variations in elevation and/or bodies of water?
- Do research on the sources of pollutants that form tropospheric ozone: nitrogen oxides (NOx) and volatile organic compounds. Are ozone precursors produced in higher amounts on weekdays vs. weekends? Compare weekend data with weekday data to see if you can find consistent differences in ozone levels.
Careers
If you like this project, you might enjoy exploring these related careers:


Related Links
- Science Fair Project Guide
- Other Ideas Like This
- Environmental Science Project Ideas
- Big Data Project Ideas
- My Favorites