Abstract
Extinct might be a word you associate with animals that lived long ago, like the dinosaurs, but did you know that over 18,000 species are classified as "threatened" (susceptible to extinction) today? Scientists involved in wildlife conservation have a tough job; they are in charge of determining what needs to be done to prevent a species from becoming extinct. Habitat, food supply, and impacts of local human populations are just a few of the factors these scientists take into account. It is a lot to keep track of for a single location, but the job becomes even harder when it is a migratory animal. In this science project, you will get a firsthand look at their job. You will access real data about migratory birds and use satellite images to analyze their habitats, then come up with a conservation plan to protect the species from extinction.Summary
Dr. Roland Kays, Dr. Stephen Blake, Sebastian Cruz, Dr. Wolfgang Fiedler, Dr. Bart Kranstauber, Carolina Proanio, Rolf Weinzierl, Dr. Martin Wikelski, and the MIGRATE NSF RCN, in conjunction with Sandra Slutz, PhD, Science Buddies
Google® is a registered trademark of Google Inc.

Objective
Determine the migratory path for a bird species and investigate whether the habitats in its summer and winter locations are similar or different. Based on this information, come up with a recommendation for which locations should be conserved to protect this species.Introduction
Did you know that the United Nations estimates that the worldwide human population will increase from 6.5 billion in 2009 to 8 billion people by 2025? As the human population increases, so does the sheer amount of land needed to support all these people. Existing cities grow larger, build taller, and spread into the countryside. Transportation infrastructures like roads, railways, and shipping routes are added, and more farmland is required to feed the population. These changes often mean taking existing wilderness—like a forest, field, or jungle—and converting it into either agricultural or urban land. But there can be environmental consequences to those actions. For example, if you take away the only habitat that sustains a particular animal, that animal might die off if it is unable to adapt to a different habitat. Collaborations between urban planners, environmental scientists, and wildlife biologists can be helpful in avoiding these types of consequences and determining which lands can be developed with the least impact on the animals and plants.
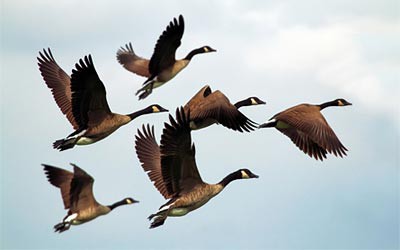
In this science project, you will determine which locations would need to be conserved in order to protect a specific migratory bird species. The migration, or regular seasonal journey between two or more areas, takes birds from their breeding grounds to their wintering grounds, and then back again, every year. Some species fly almost nonstop between their breeding and wintering grounds, while others have stopovers. Stopovers are pit stops for a bird to rest and eat before continuing its journey. They are analogous to stopping at a rest stop to stretch your legs, eat some lunch, and fuel up the car before continuing on a long road trip. Migratory birds—or for that matter, all animals that migrate—are harder to protect than nonmigrants. Why? Because you need to protect at least two major locations, the breeding and wintering grounds, as well as the migration corridor. Since the locations can be literally thousands of miles apart, it might require international cooperation.
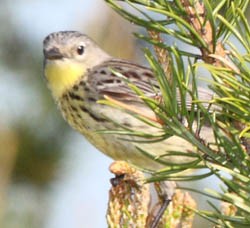 Image Credit: Dominic Sherony at Wikipedia / Creative Commons
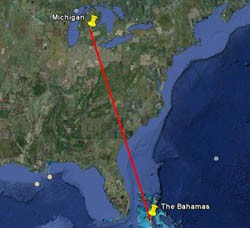 Image Credit: Sandra Slutz, Science Buddies
Figure 1. The Kirtland's warbler ( Dendroica kirtlandii), is a critically endangered North American songbird. It breeds in Michigan and then travels over 1,200 miles south to its wintering grounds in the Bahamas. Saving this warbler from extinction requires cooperation from local governments in Michigan and in the Bahamas. (Kirtland's warbler photo by Dominic Sherony, 2009.)
In order to protect migratory birds, it is important to identify and evaluate all the locations that are relevant to the birds: the breeding ground, stopover sites, and wintering grounds. Where are these sites? If there are stopover sites, are they unique to individual birds or are they common to the species? Do the birds use the same habitats in both the breeding and wintering grounds? What about the habitats of the stopover sites? In this science project, you will use real bird tracking data to explore these questions for one bird species, and then use those answers to make a recommendation about which lands should be conserved in order to protect the species. You will access the data through Movebank, an archive of animal movement data collected by scientists in the course of their studies. Many scientists have agreed to share their real data with Science Buddies for you to analyze. You will be using the same data that scientists are using in their own experiments!
Some of the most important data that scientists who focus on migratory animals collect is where the birds are, and when they are there. This type of information is called spatio-temporal data where spatio refers to the space or location of the bird and the temporal information is the time (month, day, hour) that the bird was determined to be at that specific location. To collect this data, scientists put tracking tags on birds. The three most commonly used tags to track migratory birds are banding, global positioning system (GPS) tags, and Argos Doppler tags. More information on the tags and their advantages and disadvantages can be found in the Science Buddies guide to Using Animal Tracking Data from Movebank for Science Projects.
The Experimental Procedure will show you how to access the spatio-temporal data stored in Movebank and then use Google Earth Pro to map the migratory paths of individual birds. From the map you can identify the breeding, stopover, and wintering sites, and classify the habitats at each of those locations. Who knows, what you find out might someday help save a bird's life!
Terms and Concepts
- Habitat
- Migration
- Area
- Wintering grounds
- Breeding grounds
- Spatio-temporal data
- Animal tracking tags
- Boundary
- Wildlife conservation plant
Questions
- How do scientists attach tracking tags to animals?
- What types of data do tracking tags give scientists?
- Why do animals migrate?
- What are the criteria for classifying an animal as endangered?
- What kind of information do scientists need in order to come up with a wildlife conservation plan?
- According to your background reading, in what habitat(s) does the bird species you've chosen to study for this science project live?
Bibliography
For more information about what a wildlife conservation plan is look through this website:
- Association of Fish & Wildlife Agencies. (2012, November). Best Practices for State Wildlife Action Plans. Retrieved October 5, 2016.
Additional information about how bird migrations are tracked can be found at:
- Fiedler, Wolfgang. (2009). New technologies for monitoring bird migration. Ringing & Migration Volume 24, pages 175–179. Retrieved December 6, 2010.
More information about Movebank can be found at:
- Science Buddies. (2016). Using Animal Tracking Data from Movebank for Science Projects. Retrieved December 6, 2010.
Help information for Google Earth can be found here:
- Google. (2010). Google Earth User Guide. Retrieved December 6, 2010.
The human population figures in the Introduction came from this source:
- European Commission. (2009). The World In 2025. Retrieved September 2, 2016.
Materials and Equipment
- Computer with the following requirements:
- Internet access
- A spreadsheet program, such as Microsoft® Excel®
- Permission to download a free version of the Google® Earth Pro software
- Lab notebook
Experimental Procedure
In this science project, you will download real bird migration and temperature data from Movebank.org. Then you will look at the migration route in Google Earth Pro and analyze the habitats that the birds are using to determine which lands need to be conserved to protect the species.
Setting Up and Downloading the Migration Data
- To do this science project, you will need to install Google Earth Pro on the computer you are using. Google Earth is a program that allows you to map locations and look at satellite images of places all around the world. Be sure you have permission to download this from the computer's owner before you begin.
-
A free version of Google Earth Pro can be downloaded from https://support.google.com/earth/answer/176160?hl=en.
- You might find it useful to try one of the tutorials or to consult the Google Earth User's Guide to familiarize yourself with Google Earth Pro. The Google Earth general help page, earth.google.com/support/ is a useful starting point if you have questions about how to use different parts of the program.
- Next, you will need to decide what species you are interested in studying for this science project. Table 1 shows a list of species that have available data sets suitable for this science project. Many additional species data sets on Movebank might also work for this project, but the ones listed in Table 1 are the only ones that have been tested.
| Species Name | Study Name |
|---|---|
| White stork (Ciconia ciconia) | MPIO white stork Argos |
| Barnacle goose (Branta leucopsis) | Barnacle goose (Svalbard) |
| Turkey vulture (Cathartes aura) | Turkey vultures in North & South America |
| Blackpoll warbler (Setophaga striata) | Blackpoll warbler eastern North America |
| White-fronted goose (Anser albifrons) | Migration timing in the white-fronted geese |
| Swainson's hawk (Buteo swainsoni) | Swainson's hawks |
-
Once you have decided on a species, go to the Tracking Data Map page in Movebank to access the bird tracking data. You will need the study name, listed in Table 1, to find the data. Or you can explore the other data sets available to you at Movebank and choose a bird species that most interests you. You can find more details on how this site works in the Movebank "Tracking Data Map" User Manual.
- If you want to find out more information about your chosen data set, you can browse the Studies page details for your selected study.
- Follow the instructions in the Movebank tutorial "Accessing data in Movebank" to download your data. Specifically follow the instructions in the section "Downloading data in Movebank format." Keep all the default settings in the download window and choose "GoogleEarth (Tracks)" as the file type.
- Open the downloaded Google Earth file in Google Earth Pro. It will contain the path of each animal of your selected species on a map, complete with satellite images of each location. Examples of two migratory bird tracks are shown in Figure 2.
- You might find it useful to try one of the tutorials or consult the Google Earth Pro User's Guide to familiarize yourself with Google Earth Pro. The Google Earth general help page, http://earth.google.com/support/ is a useful starting point if you have questions about how to use different parts of the program.
Identifying the Migration Path and Bird Habitats
-
Once the Google Earth file has opened, you will see location points (dots) connected by migration tracks (lines). If you only see lines and no dots, double-click on the study name in your "Places" section in Google Earth Pro. Each animal in the study will have a single color. All the dots corresponding to the location of a specific animal will be in the same color. In Figure 2, the migration paths of two birds are shown. One bird's data is color-coded orange and the other is color-coded blue.
- Note: The location points mark coordinates reported by the bird's tag. The tracks are generated by making the shortest possible line between the two location points that are closest together in time. The tracks are the "best guess" of the path the birds took, but only the location points are precise data.
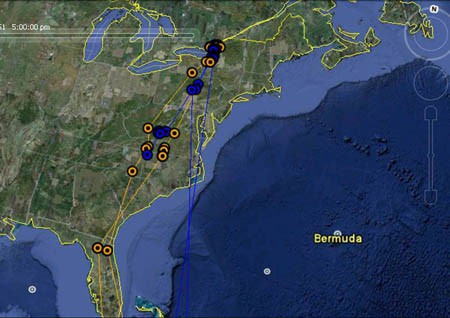 Image Credit: Sandra Slutz, Science Buddies
Figure 2. Partial view, in Google Earth Pro, of the migratory track of two ospreys. The dots show locations where they were tracked using Argos Doppler tags. The lines connect temporally sequential locations in an approximation of the bird's flight path. (Data shown here was collected by Nye, P. and accessed through Movebank.)
-
Not all the tracks in a study might be good for analysis. Some tracks might have ended prematurely if the tag fell off the animal, if the animal died, or if the tag stopped functioning for technical reasons. Choose a good track for your analysis.
-
Look at each track individually. To do this in Google Earth Pro, go to the menu on the left-hand side of your screen. Under "Places" you will see the study data. It will show your study name as "studyname.kmz". To see the different birds in the study, click the box with a plus (+) next to the study's name. Now you will see a separate ID or name for each bird. Click the box next to the bird's ID to select (box is checked) or un-select (box is un-checked) each bird. See Figure 3 for details. Bird tracks with selected (checked) IDs will be displayed on the map.
- Make sure the track visually appears complete.
-
Underneath each bird's ID in Google Earth are the number of location events (n) recorded for that bird and the time span over which the data was collected. For example, in Figure 3, 88 locations were recorded from bird 3H's Argos tag from July 10, 1999 through September 4, 2000. The best tracks for analysis will:
- Span a year, or more, of time, thus giving you a view of where the bird is throughout the entire year.
- Have a normal or high number of recorded location events compared to other birds in the study.
- Write down in your lab notebook the tracks you consider to be complete and good for analysis.
-
Look at each track individually. To do this in Google Earth Pro, go to the menu on the left-hand side of your screen. Under "Places" you will see the study data. It will show your study name as "studyname.kmz". To see the different birds in the study, click the box with a plus (+) next to the study's name. Now you will see a separate ID or name for each bird. Click the box next to the bird's ID to select (box is checked) or un-select (box is un-checked) each bird. See Figure 3 for details. Bird tracks with selected (checked) IDs will be displayed on the map.
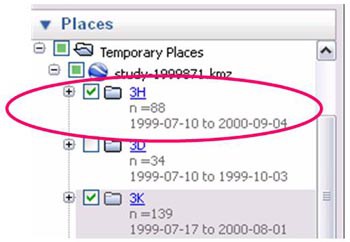 Image Credit: Sandra Slutz, Science Buddies
A cropped screenshot of selected files in the sidebar of Google Earth. In Google Earth there is a sidebar labeled "Places" which contains a file tree where files can be toggled on and off using a checkbox. The folder named "3H" is circled in red and two folders labeled 3H and 3K are selected to be shown on the map.
Figure 3. In this case, birds 3H and 3K are selected (checked) and their tracks would be displayed on the map. Bird 3D would not be displayed because its ID has not been selected.
-
Once you have a list of good tracks for analysis, take a careful look at the first one, using Google Earth Pro. Determine where the wintering and breeding grounds are, and where the migratory path is.
- Look for places on the map with relatively dense clusters of location points on either end of a migratory route. These are the wintering and breeding grounds. Write down all your assumptions and your final decision in your lab notebook.
-
If you click on a location point, it will tell you more information about that point, including the timestamp. The timestamp is when the tag recorded the bird at that location. Using the timestamps, determine:
- Which is the wintering ground and which is the breeding ground. Hint: You might need to research something about the climate at each location during different times of the year.
- Approximately how long the bird spent at each location and how long it spent migrating.
-
Using the "polygon" tool in Google Earth Pro, you can draw the boundaries for the summer and wintering grounds. The tool will then calculate the area for each. How large is the bird's wintering grounds? How about its breeding grounds?
- To learn how to use the polygon tool, consult Google Earth Pro's help page on Drawing Paths and Polygons.
- You can also measure the total length (in miles or kilometers) of the migratory path.
-
Look at the migratory path and determine if there are any stopover sites along the migratory path. Remember, stopover sites are places where the bird spends a longer amount of time refueling and resting so that it is ready to continue on its migration.
-
Some birds engage in stopover behavior and others do not. The bird whose data you are analyzing might or might not, you will have to look at the data and decide for yourself. You will create your own criteria for evaluating whether somewhere is a stopover site or not.
- One indicator of a stopover site might be a denser cluster of location points. If a bird is staying in a smaller geographic region for a day or more, this might be a stopover. You will need to evaluate it in the context of the larger migration pattern to be sure.
- Write down in your lab notebook the criteria you use to evaluate what is and is not a stopover site. Make sure you apply this same criteria at each location you evaluate in the migratory path.
-
Some birds engage in stopover behavior and others do not. The bird whose data you are analyzing might or might not, you will have to look at the data and decide for yourself. You will create your own criteria for evaluating whether somewhere is a stopover site or not.
-
Once you have identified the wintering grounds, breeding grounds, and stopover sites (if there are any) for that bird's track, you are ready to determine what the habitat is like at each of these locations. The first step is to decide what variables you would like to evaluate to describe the habitats. You can choose any combination of variables you think are important. Try to choose at least two or three variables. Following, you can see an example of three variables that can be used in combination to describe the type of land, and how much impact humans have on the local environment. Table 2 provides an example of the type of categories and measurements you could make for each variable.
- Land use: For what does the land appear to be used?
- Number of buildings: The greater the number of buildings, the greater the human impact.
- Roads: These are another form of human impact.
| Land Use | Buildings | Roads |
|---|---|---|
| Urban (e.g. many houses or a city) | None (0) | Absent (0) |
| Agricultural (e.g. farm land) | Scattered | Present (1 or more) |
| Forest | Moderate (10–100) | |
| Grass/Shrublands | Intense (>100) | |
| Water (e.g. pond, lake, or ocean) |
-
Pick five representative data points at each of the locations (if there are not five points available, then choose as many as are available). For each of these location points, complete these steps:
- In a data table in your lab notebook, record whether the location is representative of wintering grounds, breeding grounds, or a stopover site.
-
Double-click on the location point to center it in your map view. Continue to zoom in or out until you are viewing the satellite image from an eye altitude of approximately 1 kilometer (km) (3,280 feet). Eye altitude is displayed in the lower right-hand corner of the Google Earth Pro screen; see the red circle in Figure 4 for a visual reference. Note: Depending on the location of your data point, you might not be able to zoom in that far. Zoom into the lowest altitude possible for your data point and make sure you are using consistent altitudes for each data point. To get a better (and planar view) of the selected area in Google Earth Pro, go to "View" and select "Reset" "Tilt." You might need to adjust the eye altitude slightly afterwards.
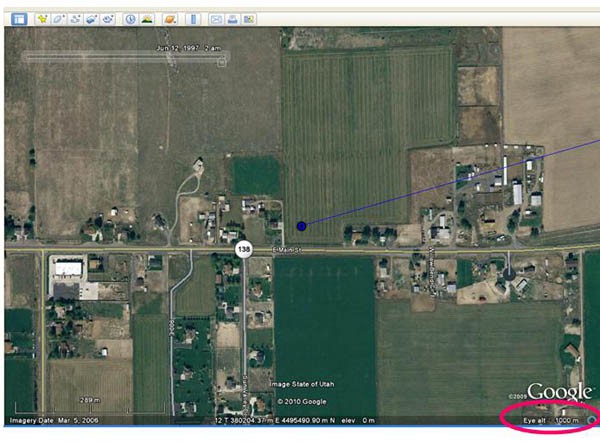 Image Credit: Sandra Slutz, Science Buddies
Figure 4. The image is centered on a breeding ground location (blue dot) at an eye altitude of 1 km (circled in pink). This habitat would be classified as agricultural, with roads, and moderate building coverage.
- Look at the picture and categorize the habitat according to the variables you defined in step 5. Enter your findings into a data table in your lab notebook.
- Note: Google Earth Pro will automatically show you the most recent satellite imagery for a location. However, if the bird tracking study took place several years ago, the habitat might have been different then. To ensure that your image analysis is as accurate as possible, use the historical image button to find a satellite image that is closest in time to the date of the migration study. For more information about using the historical image button, see Figure 5, and Google Earth's article about historical imagery.
 Image Credit: Sandra Slutz, Science Buddies
A cropped screenshot of a timeline slider in Google Earth allows users to view photos of a specific area by date. A clock icon in the middle of the top navigation bar, circled in red, allows the slider to be toggled on the screen.
Figure 5. Historical satellite images can be accessed by clicking the button with the clock icon (circled in pink). Use the slider to find the satellite image that was captured as close to the date of the migration study as possible.
- Repeat steps 3–6 for the other good bird migration tracks. You should analyze a minimum of three bird tracks.
Analyzing the Habitat Data
- For the first bird track you evaluated, graph the habitat data for the wintering grounds. Create a pie chart for each variable you scored. For example, if you scored land use, number of buildings, and presence or absence of roads, you would create three pie charts. See Figure 6 for an example.
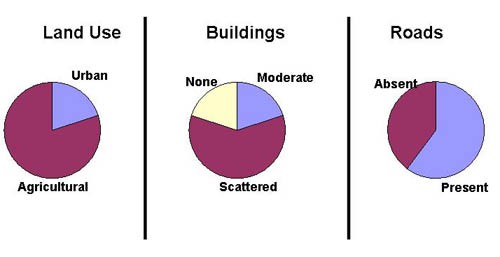 Image Credit: Sandra Slutz, Science Buddies
Three pie charts illustrate the types of areas birds rest in or migrate to. The first chart titled 'Land Use" shows migration into two areas: urban and agricultural. The second chart titled "Building" is divided into chart sections: none, moderate and scattered. The third chart titled "Roads" is divided into chart sections: absent and present.
Figure 6. These pie charts are examples of the types of graphs you will create for each bird, at each habitat (wintering, breeding, and stopover).
- Create similar pie charts for the breeding grounds and stopover locations (if there are any).
- Looking at one variable at a time, compare each of the habitats. Write down your observations in your lab notebook. For example, compare land use at the breeding, wintering, and stopover areas. Are they similar? Does the bird show a strong preference for one type of habitat versus others at any of the locations?
- Repeat steps 1–3 for each bird track you evaluated.
- How similar or different are the habitat choices of the individual birds. Can you make any general statements about the habitat needs of the species?
- Based on your conclusions, what types of land need to be conserved to preserve the species? What kind of land use and human impact may be tolerated by the species?
Ask an Expert
Global Connections
The United Nations Sustainable Development Goals (UNSDGs) are a blueprint to achieve a better and more sustainable future for all.

Variations
- The Experimental Procedure above relies on categorical data to draw conclusions. Can you think of a way to convert the categorical data into quantitative data and assign a human impact value to the various locations?
- Compare different migratory bird species. Do they use similar or different habitats? Do they have the same range of tolerance for human impact, or are some more adaptable?
Careers
If you like this project, you might enjoy exploring these related careers:


Related Links
- Science Fair Project Guide
- Other Ideas Like This
- Environmental Science Project Ideas
- Big Data Project Ideas
- My Favorites