Abstract
Have you ever taken a step onto what appeared to be dry ground, only to find yourself ankle-deep in mud? Yuck! When you walk through damp soil, it can be a very messy experience. How can you tell if soil is wet or dry before you step on it? In this science project, you will investigate whether the color of the soil can help you determine how dry or wet it is.Summary
Sara Agee, Ph.D., Science Buddies
Teisha Rowland, Ph.D., Science Buddies
Brynie, F.H., 2005. Parent's Crash Course: Elementary School Science Fair Projects, Hoboken, NJ: Wiley Publishing Inc. pp 162-164.

Objective
Test if soil color can be used to evaluate the moisture content of the soil.
Introduction
The amount of water present in a sample of soil is called the soil's moisture content. Moisture is very important and the amount of moisture needs to be in a careful balance, not too dry and not too wet, for organisms to thrive in it. Specifically, the moisture content of the soil needs to match the needs of the plants, animals, and other organisms living in the habitat. Some organisms need a lot of moisture, like ferns and salamanders. Others, like cacti and snakes, are adapted to desert habitats and need very little water. Most often, evenly moist soil is a haven for plants and small, soil-dwelling animals.
Moisture conditions affect the soil structure in many ways. Soil that is too wet or does not drain properly can suffer from erosion. Soil that is too dry can become hard and compacted. Also, different types of soil respond to moisture differently. A sandy soil will drain water quickly, but a clay soil will absorb water and become soggy.
Since the moisture content of the soil is so important, how can it be measured? In this experiment you will learn how to use color scales to indicate the moisture content of your soil. For example, Figure 1 shows a picture of mud. What do you think the color of the same soil is when it is dry? By adding increasing amounts of water to a sample of dry soil and taking a photo you can develop a standard assay for soil moisture. What will be the color of your soil when it is dry compared to when it gets wet?
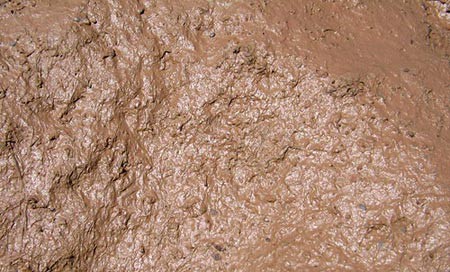
Figure 1. A picture of wet, muddy soil. (Wikimedia Commons, Oven Fresh, 2005)
Terms and Concepts
- Soil
- Moisture content
- Color scales
- Grayscale colors
Questions
- How does the color of soil change when moist or dry?
- How is a color scale developed?
- Do different soil types have different colors when moist or dry?
Bibliography
- U.S. Geological Survey (USGS). (2004). Activities: Soil Moisture and Evaporation Modeling. Recovery and Vulnerability of Desert Ecosystems (RVDE) Program. Retrieved April 28, 2006.
- Brynie, F.H., 2005. Parent's Crash Course: Elementary School Science Fair Projects, Hoboken, NJ: Wiley Publishing Inc. pp 162-164.
Materials and Equipment
- Soil (3 cups).
- This can be from your backyard, another outdoor location with exposed soil, or purchased from a plant nursery.
- If you collect your soil from an outdoor location, you may want to use a spoon, small shovel, and/or a sealable container to do this.
- Be sure to note in your lab notebook where you collected the soil from.
- Small baking dish
- Cookie sheet
- Oven
- Small cups for your soil samples (21)
- Permanent marker
- Measuring spoons and cups
- Water
- Paper (3 sheets)
- Pen, pencil, or marker
- Digital camera
- Computer
- Printer
- Lab notebook
- Adult helper for using the oven
Experimental Procedure
- Put 3 cups of soil into a small baking dish. Place the dish on a cookie sheet.
- Have an adult help you place the cookie sheet (with the baking dish on it) in the oven and bake the soil at low heat (200°F) for 2-3 hours. This will evaporate all of the water from your sample.
- Remove the soil from the oven and allow it to cool completely.
- Take 7 of the small cups and label then 1–7 using a permanent marker. Repeat this with the remaining unlabeled cups until all of the cups are labeled with a number.
- This means you should end up with three cups labeled "1," three labeled "2," three labeled "3," and so on up to the number 7.
- Using a measuring spoon, place 2 tablespoons (Tbsp.) of dry soil into each of the 21 small cups.
- Figure 2 shows seven labeled cups with dry soil in them.
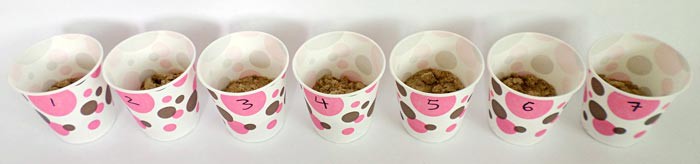 Image Credit: Teisha Rowland, Science Buddies / Science Buddies
Figure 2. This picture shows seven labeled cups (labeled 1–7) with 2 Tbsp. of soil in each cup. You will want to prepare three sets of cups this way, for a total of 21 cups.
- Follow Table 1, below, to add different amounts of water (in teaspoons [tsp.]) to each cup. (Note that no water should be added to the cups labeled "1," as these cups will be dry soil controls.) After adding the water to each cup, stir the soil in each cup thoroughly.
| Sample | Soil (Tbsp.) | Water (tsp.) |
|---|---|---|
| 1 | 2 Tbsp. | 0 tsp. (no water) |
| 2 | 2 Tbsp. | 1/2 tsp. |
| 3 | 2 Tbsp. | 1 tsp. |
| 4 | 2 Tbsp. | 1 1/2 tsp. |
| 5 | 2 Tbsp. | 2 tsp. |
| 6 | 2 Tbsp. | 2 1/2 tsp. |
| 7 | 2 Tbsp. | 3 tsp. |
- On a sheet of paper, use a pen, pencil, or marker to write the numbers 1–7. Leave enough room above the number so that you can place a spoonful of each sample above each number.
- On the numbered sheet of paper, place one spoonful of each soil sample above the matching number. Do this with one of your numbered sets of cups (labeled 1–7).
- Take a photo of your sheet of paper with a digital camera. Be sure to fit all of your samples in the photo.
- Repeat steps 7–9 with your other two sets of cups (each labeled 1–7). Use a newly numbered paper for each set of cups.
- Download the photos to your computer, and print out the photos in grayscale colors, or black and white.
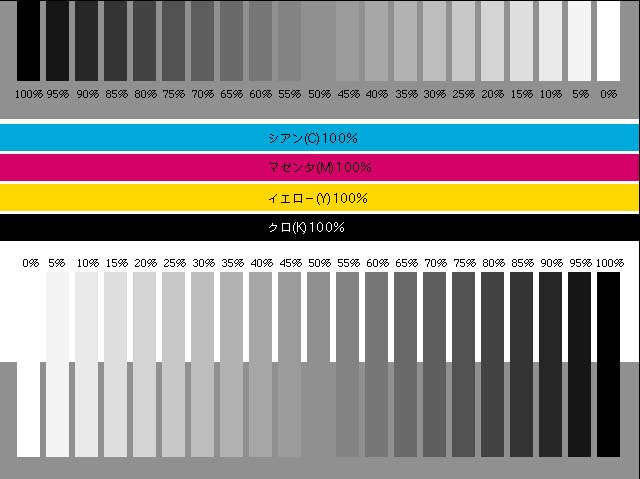
- Download this grayscale color bar and print out a copy of it.
- Compare the colors of your soil samples with the different grayscale colors (on the bottom of the image, with percentages listed above them). Assign each sample a grayscale percentage (from zero, which is white, to 100%, which is black). Do this using the grayscale color bar by matching up the colors of the scale with those of your photo. In your lab notebook, make a data table like Table 2, below, and write your results in your data table.
| Grayscale Percentage | Average Grayscale Percentage | |
|---|---|---|
| 1 | ||
| 1 | ||
| 1 | ||
| 2 | ||
| 2 | ||
| 2 | ||
| 3 | ||
| 3 | ||
| 3 | ||
| etc. |
- Calculate the average grayscale percentage for each of the samples that have the same number. Write this in the data table in your lab notebook.
- For example, if one sample #2 had a grayscale percentage of 50%, another sample #2 had a grayscale percentage of 55%, and the third sample #2 had a grayscale percentage of 50%, the average grayscale percentage for sample #2 would be 52% (since 50% + 55% + 50% = 155%, and 155% ÷ 3 = 52%).
- Make a graph of your data by hand or you can try using the Create a Graph web site for kids from the National Center for Education Statistics.
- On the x-axis (the horizontal axis), list your sample numbers (1–7). On the y-axis (the vertical axis), list your average grayscale percentages (0–100%).
- Is there a difference between dry samples and wet samples? What happened to the color of the soil as more water was added? Could you use your results to determine the moisture level of other soil samples?
Ask an Expert
Global Connections
The United Nations Sustainable Development Goals (UNSDGs) are a blueprint to achieve a better and more sustainable future for all.

Variations
- In this science project, you only tested soil from one sample to make a scale. Sample different areas of your yard and compare to your scale. Can you use your scale to estimate the moisture content of soil from different places in your backyard? Is there a difference in soil moisture in sunny or shady locations?
- Try testing your soil moisture from the same location on different days. Does soil moisture change with the weather? Do not just compare the obvious rainy and dry days. Compare hot and cool days or cloudy and sunny days. Sample soil each day after a rain shower. How much does the moisture decrease each day?
- Will your color chart work for different types of soil? Repeat the experiment using soil collected from different locations that have different types of soil. Also try using store bought potting soils or compost. How does moisture effect the colors of each type of soil?
Careers
If you like this project, you might enjoy exploring these related careers:


