Abstract
Measurements are very important for scientists. It is especially important that the measurements be accurate. Think about how important accuracy is when you want to know if you are taller than a friend of yours, every inch counts! In this experiment, you will investigate how different objects can be measured with accuracy. Are small or large objects more difficult to measure? Who in your family is the best at measuring? Maybe it will be you!Summary

Objective
In this experiment you will find out how accurate people are at measuring things that are small, medium or large.Introduction
One important thing that scientists do is take measurements. We do this to observe interesting phenomena using real numbers, and to collect data. By collecting data with measurements, we can more accurately describe what we observe.
For example, if I told you I saw a big bug, a giant bug or a huge bug, would you really know what I meant? Maybe by big, I meant bigger than an ant. But I may have meant bigger than a grasshopper. Without measurements, scientists cannot communicate their results to each other very accurately. If I told you that I saw a bug that was exactly 2 inches, or 5 centimeters, long there would be no confusion.
How do scientists make sure that the measurement is accurate? We check our work! We measure something many, many times to see if we get the same measurement over and over again. When measurements are not all the same, there is error. Some error is always expected for some types of measurements, because there will always be some slight variation between measurements that cannot be controlled. But sometimes the amount of error is too large, and the measurement might be unreliable.
This might seem tedious, but you would be surprised at how much variation there can be! Someone might measure an object slightly differently from someone else. What if you have different sized hands? What if you use a different ruler? What if the object is too small or too large?
In this experiment you can investigate the sources of error in measurements. You will learn how to make measurements and how to do some calculations to decide if the measurement is accurate. Best of all, you can find out if you are more accurate at measuring things than your parents!
Terms and Concepts
To do this type of experiment you should know what the following terms mean. Have an adult help you search the internet, or take you to your local library to find out more!- measurement
- accuracy
- error
- average
- percent difference
- deviation
Bibliography
- "Fact Monster: The Origin of Measurements." Boston, MA: Pearson Education Inc. [12/30/05]
http://www.factmonster.com/ipka/A0769529.html - Fogt, Robert. 2002. "How do I read a ruler?" Online Conversion.com [12/30/05]
http://www.onlineconversion.com/faq_05.htm
Materials and Equipment
- metric ruler
- 3 different things to measure
- 4 volunteers to measure them
- calculator
Experimental Procedure
- Collect 3 items of different sizes for your volunteers to measure. Try to have one small, one medium, and one large object. For example, you might choose a dime, a pencil, and a baseball bat.
- In this experiment I suggest using a metric ruler, because it is easier to make accurate measurements in centimeters than in inches (but don't take my word for it, you can try this experiment yourself, see the possible variations of this experiment below). Here is a quick reminder on how to use a ruler from OnlineConversion.com: How to Read a Ruler
- Ask volunteers from your friends and family to measure the three objects using your ruler, and record their measurements in a data table. You do not want your volunteers to share information, so try to separate the volunteers when you have them take the measurements. For example:
Name Dime (cm) Pencil (cm) Baseball Bat (cm) Mom Dad Sister Brother - After collecting your data (you will need at least 5 measurements for each item) you will want to analyze the data using a few mathematical formulas.
- First, you will want to know what the average measurement was for each item. This will tell you what everyone's data combined together says the ideal measurement is.
- To calculate the average for each item, add together all of the measurements you collected and divide by the number of measurements:

- Now that you know the average measurement for each item, you can figure out how much each person deviated from the ideal measurement, called the absolute difference. To calculate this you will need to subtract the average measurement from the actual measurement of each person (or the other way around):

- Repeat the calculation for the absolute difference in measurement for each item that was measured.
- Since you want to know if there is more error measuring small items than big items, you will need to know the total error of measurement for each group. But wait one minute and think about this. If some one makes a 1cm error measuring a dime, that is much more of an error than if someone makes a 2 cm error measuring a baseball bat when you take into account the size of the object. But if you simply add up your differences in measurement, then the baseball bat error will appear to be larger than the dime error, because 2cm > 1cm. So that we do not have this problem, we need to change our errors into percents, and not centimeters.
- To change your error calculations from absolute difference to percent difference, you will need to divide the absolute difference you just calculated by the average size of the object. Then multiply your answer by 100:

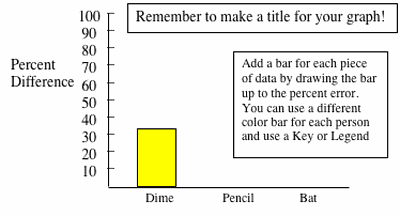
- The last thing to do is make a graph of the errors in measurement for each person. How did they do at measuring each object? The best type of graph for this type of data is a bar graph. Put the percent difference on the left axis, and put a bar for each object that was measured that reaches up to the amount of error.

- Which objects resulted in the most error? Which objects resulted in the least amount of error? Did everyone make the same errors in measurement, or did they make different errors?
Ask an Expert
Variations
- Measurements can be tricky, especially when you change the system of measuring that you use to measure with. Most people in the U.S. are more familiar with English measurements than with metric measurements. Do a similar experiment to see if people are more accurate measuring with one system than the other.
- Small objects are hard to measure with accuracy because it is difficult to see them very well. Another way to measure a small object is to line many of the small objects up in a row and measure them as a group. Then you can divide your measurement by the number of objects you used to get the measurement of a single object. Try this method to measure some very small things, like rice grains, seeds or peas. Is this method more accurate?
Careers
If you like this project, you might enjoy exploring these related careers:


