Summary
Written by Frank Niepold, Climate Education Fellow, NOAA Climate Program Office
Edited by Andrew Olson, Ph.D. and Ben Finio, Ph.D., Science Buddies

If you want a Project Idea with full instructions, please pick one without an asterisk (*) at the end of the title.
Abstract
The past few years have histories of extremely powerful and dangerous storms. Storms have also become more numerous over the last few years. To investigate potential effects of climate on hurricane number and strength, in this project you will study the effects of El Niño on hurricanes. The goal of this project is to study the historic relationship between the El Niño/Southern Oscillation (ENSO) and the number and strength of hurricanes, either in the Atlantic or Pacific Oceans. Since this is an abbreviated Science Buddies project idea, we will not provide you with a complete step-by-step procedure. You will need to do some of your own background research and figure out your own procedure to do this project.
Note: much of the background information presented below was originally written in 2006. Climate change is a very "current" research topic, with new articles and studies being published all the time. Before starting this project, you should do some of your own research into more up-to-date climate science resources.
Is global warming causing an increase in hurricane intensity? Consider the following causal chain:
- Greenhouse warming is contributing to the global tropical sea surface temperature increase (still controversial).
- Global tropical sea surface temperature is increasing.
- Global hurricane intensity increases with increasing sea surface temperature.
- Global hurricane intensity is increasing.
Note: However, we are still working on this last link. The statement that "greenhouse warming is" cannot conclusively be linked to the "contributing to the global tropical sea surface temperature increase" yet. There are numerous papers just beginning to make this link, but climatologists predict that extreme events, like hurricanes, will be stronger and more frequent as the man-made climate warming increases. (For more information, see GFDL, 2013.) The timing of this increase is important. Many scientists are finding evidence that support the assertion that we are already seeing this increase in the stronger and more frequent extreme events, due to man-made causes (i.e., fossil fuel emissions.)
The story may be even more complex! Greenhouse warming may also influence hurricanes through changes in pre-existing natural cycles (e.g. El Niño), atmospheric circulation patterns, and ocean mixed layer depth. More research is needed on the global climate dynamics of hurricanes.
Historically, scientists have thought that the Atlantic hurricane activity has exhibited very strong multi-decadal variability, with alternating periods lasting several decades of generally above-normal or below-normal activity. These multi-decadal fluctuations in hurricane activity result nearly entirely from differences in the number of hurricanes and major hurricanes forming from tropical storms first named in the tropical Atlantic and Caribbean Sea.
Hurricane seasons during 1995-2004 have averaged 13.6 tropical storms, 7.8 hurricanes, 3.8 major hurricanes, and with an average Accumulated Cyclone Energy (ACE) index (NWS, 2014) of 159% of the median. NOAA classifies all but two of these ten seasons (El Niño years of 1997 and 2002) as above normal, and six of these years as hyperactive. If the 2005 season verifies as predicted, it will be the seventh hyperactive season in the last 11 years.
In contrast, during the preceding 1970-1994 period, hurricane seasons averaged 9 tropical storms, 5 hurricanes, and 1.5 major hurricanes, with an average ACE index of only 75% of the median. NOAA classifies twelve (almost one-half) of these 25 seasons as being below normal, only three as being above normal (1980, 1988, 1988), and none as being hyperactive.
What is the relationship between hurricanes and El Niño/Southern Oscillation (ENSO)? In general, warm ENSO episodes are characterized by an increased number of tropical storms and hurricanes in the eastern Pacific and a decrease in the Gulf of Mexico and the Caribbean Sea.
- Atlantic Ocean: It is believed that El Niño conditions suppress the development of tropical storms and hurricanes in the Atlantic; and that La Niña (cold conditions in the equatorial Pacific) favor hurricane formation.
- Pacific Ocean: El Niño tends to increase the numbers of tropical storms in the Pacific Ocean.
(Source: McPhaden and Soreide, date unknown.)
To help answer these questions NOAA has developed the Historical Hurricane Tracks tool, available at http://coast.noaa.gov/hurricanes/#. This interactive application allows students to track the location and various statistics of over 6,000 storms, ranging as far back as the year 1842 and covering all 7 of the world's major ocean basins! Figure 1, below, shows an example screenshot of the hurricane tracking tool.
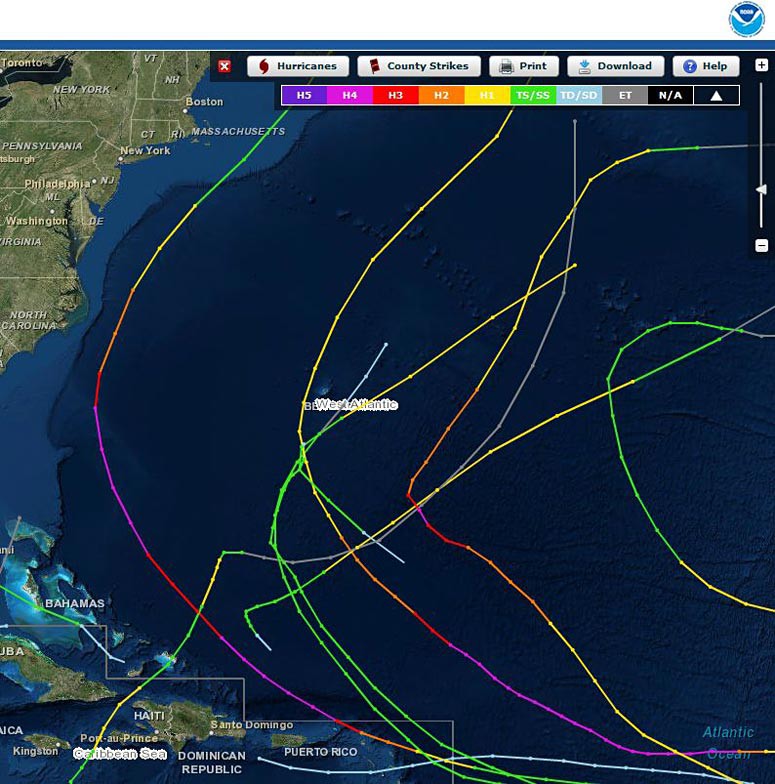
Screenshot from the NOAA Hurricane Tracking Tool (coast.noaa.gov/hurricanes/) show the western Atlantic Ocean with color coded lines that represent various storms in 2010. Sections of the storm lines are color coded to represent the severity of the storm and many of the storms travel past north-eastern region of Puerto Rico and Haiti.
Figure 1. An example screenshot of the NOAA hurricane tracking tool. Search filters were used to only track storms that occurred in the West Atlantic basin during the year 2010. The lines show the track of each storm, and the colors correspond to the storm's intensity.
For this project, you will need to figure out how you can use the historical hurricane tracking tool to determine whether there is a relationship between El Niño and the number or strength of hurricanes in the Atlantic and Pacific oceans. To get started, click the "Help" button in the upper-right corner of the hurricane tracking tool window to learn about how to use the tool. Experiment with the different search options on the left— for example searching by ocean basin, timeframe (including selecting specific El Niño years), or storm category. The search function will help you gather the data you need for your project.
Objective
The goal of this project is to study the historic relationship between the El Niño/Southern Oscillation (ENSO) and the number and strength of hurricanes, either in the Atlantic or Pacific Oceans.
Bibliography
- GFDL, 2013. Global Warming and Hurricanes, Geophysical Fluid Dynamics Laboratory, NOAA. Retrieved October 11, 2014.
- Accumulated Cyclone Energy (ACE) Index definition:
NWS, 2014. Climate Prediction Center, Atlantic Hurricane Outlook, Background Information, NOAA/National Weather Service. Retrieved October 11, 2014. - McPhaden, M.J. and Soreide, N.N., date unknown. Frequently Asked Questions About El Niño and La Niña, Pacific Marine Environmental Laboratory, NOAA. Retrieved October 11, 2014.
Ask an Expert
Global Connections
The United Nations Sustainable Development Goals (UNSDGs) are a blueprint to achieve a better and more sustainable future for all.

Careers
If you like this project, you might enjoy exploring these related careers: