Abstract
Can you hear me now . . . ? Just how loud does a sound have to be for us to hear it? And how loud is too loud for our ears? Learn to measure levels of sound in this project, and discover the amazing auditory range your ears can detect in the noisy world around you. If you have a smartphone handy, you can even do this project without purchasing any additional materials, by using your phone's sound sensor and a sensor app.Summary
Darlene Jenkins, PhD
Edited by Ben Finio, PhD, Science Buddies

Objective
The goal of this project is to learn about sound and hearing using a decibel meter to compare noise levels in different settings and locations.
Introduction

There is an old adage that claims if you really want someone to pay attention, then whisper. But how softly can someone speak and still produce a sound that can be heard? On the other hand, how loud is too loud for our ears? At what level does sound become harmful to our hearing, and is the damage temporary or does it have long lasting effects? In this project, you will discover the answers to these questions and more in your experiments and research. You will use your phone's microphone and a sensor app to measure the range of noise and sound in your neighborhood, home, school, and surroundings. You will then compare the results from the various sites to see if those noisy spots are really as loud as they seem and if the supposedly quiet zones are truly an acoustical haven for the ears. You might be surprised at what you discover.
Before you begin your project, you will want to do some background research on sound and hearing. You will learn that sound travels through the air as a wave, or a traveling vibration as air molecules bump into each other. The loudness, or intensity of sound is described in relative units called decibels (abbreviated dB), named after the American inventor of the phonograph and telephone Alexander Graham Bell. The smallest audible sound (near total silence) for humans usually correlates to 0 dB, and soft whispers are rated at a relative increase of about 15 dBs. At the other end of the scale, the roar of jet engines can register up to 120 dB while firing machine guns top out at 140 dB. That is about the loudest sound level our ears can take at close range, although anything over 120 dB can start to cause pain and potential damage. Scientists say, in fact, that sounds above 85 dB may lead to at least temporary hearing loss. Whether the damage is permanent or not depends on the decibel level, the length of time, and how often the ears are subjected to the injurious sound.
The numbering system for decibels is a little complicated. Even if decibel numbers look fairly close, the actual sound difference associated with the two numbers is really much greater. That is because decibel numbers represent changes over a logarithmic scale rather than a linear scale. That means if the number of decibels doubles, the loudness of the sound more than doubles. Figure 1 shows a graph of decibel levels for some common sounds. Notice how, for example, moderate rainfall is rated at 50 dB, and a chainsaw is 100 dB. A chainsaw is much more than twice as loud as moderate rainfall! Scientists decided to use decibels instead of the larger Bel unit because our ears are capable of differentiating between impressively small changes in sound. In fact, one decibel equals about the just noticeable difference (or JND) in sound intensity we can pick up under the most quiet circumstances. So the original Bel unit was broken down into the smaller, more convenient decibel units, to better describe the relationship between sound intensity and our hearing.
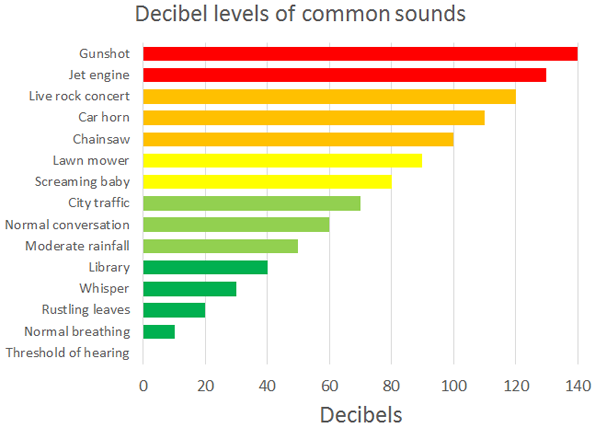 Image Credit: Ben Finio, Science Buddies / Science Buddies
A bar graph measures common sounds in terms of decibel levels from the loudest at the top to the softest at the bottom. A gunshot is the loudest common sound with a value of 140 decibels, a normal conversation has a value in the middle of the graph of 60 decibels, and the sound of breathing is the quietest with a value of 10 decibels.
Figure 1. Decibel levels of some common sounds.
When the intensity of a sound is constant, distance has a lot to do with how loud it seems to our ears. A speaker or stereo the on highest volume, for example, may sound painfully loud when played right next to your ears, but it becomes much more tolerable even without adjusting the volume when played from across the street. The intensity of the music didn't change, but your perception of its loudness did because of the increased distance.
Scientists have shown that, in most cases, sound decreases with an inverse relationship to the distance squared. This is technically known as the inverse square law. It means that if the distance is doubled, the intensity of the sound will drop by a factor of 4 (2^2=4); if the distance is tripled, the intensity of the sound will drop by a factor of 9 (3^2=9); if the distance is quadrupled, the intensity of the sound will drop by a factor of 16 (4^2=16), and so on. You will have a chance to experiment with the effect of distance on sound in one of the experiments in this project. Then you can see if your results support the findings of the auditory experts.
In addition to understanding the decibel scale system and the importance of distance to sound, you might want to investigate the physics of sound waves and hearing as part of your background preparation for this project. We have included some useful websites and suggested search terms to get you started. It would be good to know, for instance, what exactly happens when sound waves hit your ear and how that information is translated into a interpretable signal to your brain. You also might be interested in figuring out what causes "ringing in the ears" and if that is an indication of permanent hearing loss or not. Then you will know whether those repeated parental warnings about too high volumes on iPods, computers, or TVs is actually good advice for you that shouldn't fall on deaf ears.
So pump up the excitement, but please not the volume, and get started on this auditory adventure!
Terms and Concepts
- Sound
- Wave
- Intensity
- Decibel (dB)
- Logarithmic
- Linear
- Just noticeable difference (JND)
- Inverse square law
Questions
- What is sound and how do we hear?
- What is a Bel, a decibel and what are the decibel levels of some common sounds and sites?
- What is the relationship between decibels and intensity of sound?
- How does distance affect sound levels?
- What levels of noise are linked to pain or hearing loss? Why do some sounds lead to permanent damage and others do not?
Bibliography
- Easy to read information on how we hear:
Harris, T., 2007. How Hearing Works, How Stuff Works website. Retrieved August 18, 2017. - Brief explanation of decibels:
Staff, 2007. What is a decibel, and what is the loudest sound I can listen to before it hurts my ears? How Stuff Works website. Retrieved August 18, 2017. - Mathematical explanation of decibels and decibel calculations:
Nave, C. R., 2005. Decibels, Hyperphysics website, hosted by the Department of Physics and Astronomy, Georgia State University. Retrieved August 18, 2017. - Introductory information on noise-induced hearing loss:
Dangerous Decibels (n.d.). Decibel Exposure Time Guidelines. Retrieved August 18, 2017. - Another good website for information on noise-induced hearing loss:
NIDCD, 2017. Noise-Induced Hearing Loss, National Institute on Deafness and Other Communication Disorders. Retrieved August 18, 2017. - The idea for this project came from this DragonflyTV episode:
TPT, 2007. Extreme Sounds by Tarissa and Sabrina. DragonflyTV, Twin Cities Public Television. Retrieved August 18, 2017.
Materials and Equipment
- Smartphone with a sensor app such as phyphox, available for free on Google Play for Android devices (version 4.0 or newer) or from the App Store for iOS devices (iOS 9.0 or newer).
- If you do not have access to a smartphone, you can also purchase a decibel meter from Amazon.com
- Computer, smartphone, or tablet with speakers (separate from the phone/tablet you use to take measurements)
- A way to play sound with constant loudness, like a tone generator or white noise website or app
- Metric measuring tape (or use a standard tape and convert the feet to meters)
- Notepad
- Pen or pencil
- List of 10 or more locations to test for sound level
- Quiet area outside or a large, quiet room to test the effects of distance on sound
- Optional: if you plan to measure loud noises for this project (anything over 80 dB), wear hearing protection like ear plugs.
Disclaimer: Science Buddies participates in affiliate programs with Home Science Tools, Amazon.com, Carolina Biological, and Jameco Electronics. Proceeds from the affiliate programs help support Science Buddies, a 501(c)(3) public charity, and keep our resources free for everyone. Our top priority is student learning. If you have any comments (positive or negative) related to purchases you've made for science projects from recommendations on our site, please let us know. Write to us at scibuddy@sciencebuddies.org.
Experimental Procedure
Note: In this project, you will use a smartphone equipped with a sensor app to measure noise levels in various environments. Sensor apps such as phyphox let you record data using sensors that are built into many smartphones, including a microphone that you can use to measure sound. The app creates a graph that will show you how loud the noises around you are, measured in decibels, the unit for sound intensity.
Experiment 1: Environmental Testing
- Make a list of at least ten different places to measure sound level. Try to include places that are very quiet, very noisy, and somewhere in between. When you are doing your experiment, you might find a few additional sounds to measure, so these can be added to your list at that time.
- Make a prediction of the average decibel level and range (minimum and maximum values) you think each place you have selected will register on the sound meter (refer to decibel levels for common sounds obtained from your background research). Rank your locations on a list from highest predicted decibel level to lowest predicted decibel level.
- Practice taking decibel readings with the sensor app or your sound meter to be sure you know how to use it. You might take several readings from the same spot to be sure that your phone or meter is consistently measuring the same or nearly the same decibel level.
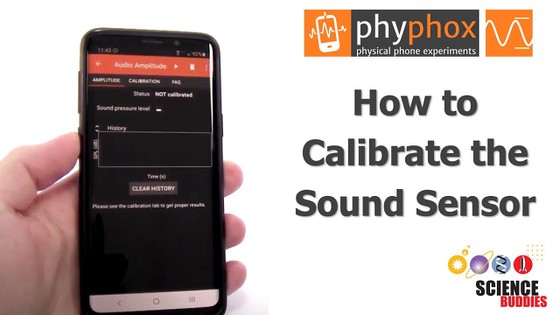
- If you are using the phyphox app, open the audio amplitude sensor. Before you take any measurements you will need to calibrate your sound sensor to get correct sound intensity readings. To calibrate your sound sensor in phyphox, follow the instructions in the sound sensor calibration video. Once the sensor is calibrated press the play button in the phyphox app to start a recording. Wait for one minute, then press the pause button to stop recording. Make sure to save your data. The app will automatically record all the noises around you over the recording period, as shown in Figure 2. Be careful not to talk or make any loud noises while you are holding the phone and recording, as this will affect your data. When reviewing your graph in phyphox, you can use the 'pick data' tool to pick the data points with the minimum and maximum values in your graph to see their decibel levels. To find out the average decibel value of your recording you will need to export your data from the app. You can do that either as a .csv or Excel file. Open the exported file in a spreadsheet program such as Excel or Google Sheets. Once you have your data in a spreadsheet use the Average function to determine the average sound intensity.
- If you purchased a standalone decibel meter, read the instructions that came with your meter. If your meter only displays instantaneous values and does not record average, min, or max values, you can attempt to record these values yourself. For example, watch your meter and write down readings every five seconds for one minute. Calculate an average value and record the min and max values. This method will not be as accurate for min and max values (since you might miss a loud noise that occurs in between your readings), but it should be a reasonable way to calculate an average value.
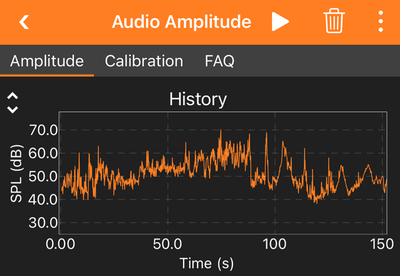 Image Credit: Science Buddies
A Google sound intensity graph measures the decibel levels of a city street. The minimum decibel level recorded was 38 decibels and the maximum level recorded was 70 decibels. Larger spikes can be seen intermittently throughout the graph.
Figure 2. An example graph that shows sound intensity data recorded with the phyphox app on a city street. The x-axis of the graph shows time in seconds and the y-axis shows sound intensity in decibels.
- Now, the fun begins. Go out and make those observations and readings. Take three one-minute recordings at each location. When using the phyphox app, make sure your sound sensor is still calibrated or re-calibrate it again (re-set the dB offset) before each recording. Save each recording and give it a descriptive name. Then review and export your data to determine the average, min, and max decibel values.
- In your notebook, write down the date, time, location, decibel levels, and a brief description of each noise or sound. Also, measure or estimate how close in meters you were to the sound source each time you take a reading. Note that some busy environments (like a city street) might have multiple sources of sound.
Experiment 2: Effect of Distance on Sound
- Do this experiment in a quiet spot outside or in large, quiet room.
- Use your separate computer, tablet, or phone with speakers as your source of sound in this experiment. Search for a website or app that will let you play sound at a constant volume, like white noise or a tone generator. Make sure the device's volume stays constant throughout all your trials. Music and videos are not a good source of sound for this experiment since their volume can fluctuate.
- Measure and record three decibel readings with your phone or meter right next to the speaker. When using the phyphox app, make sure your sound sensor is calibrated before each recording. Since the sound levels for this part of the experiment should be more constant, you can record for a shorter period of time, like 5 or 10 seconds, and then determine the average value from your data.
- Move your phone, or the sound meter away from the speaker 1 meter (39.4 inches) and take another three decibel readings. Each time, save your data and make sure to use a calibrated sound sensor for your recordings.
- Repeat the measurements at 2, 4, 8, and 10 meters away from the speaker.
Analyzing Your Data
- Calculate the average decibel level from the three sound meter readings recorded for each of your locations in Experiment 1 and Experiment 2.
- Using your data from Experiment 1, make a table with columns listing:
- location
- predicted decibel level
- average decibels recorded
- minimum decibels recorded
- maximum decibels recorded
- distance from source
- How close were your predictions to the actual decibel readings in Experiment 1?
- Which locations registered levels that could be associated with temporary hearing loss? Did any of them have average decibel levels within an acceptable range, but maximum values that could cause temporary or permanent damage?
- Were there any locations or sounds that were too soft to detect with your meter?
- Could altering the distance from the sound source change the results for the locations that were very loud or too soft to register?
- In Experiment 2, what effect did increasing the distance have on your decibel readings? Make a graph of the average decibel level vs. distance. Does the graph match what you would expect from the inverse square law?
- For help with data analysis, see Data Analysis & Graphs.
- For a guide on how to summarize your results and write conclusions based on your data, see Conclusions.
Ask an Expert
Global Connections
The United Nations Sustainable Development Goals (UNSDGs) are a blueprint to achieve a better and more sustainable future for all.

Variations
- Changes over time: take readings of the same location at different hours and/or over several days. Do you see any changes in the decibel readings? Are they what you expected?
- Analyze your electronic sources of sound: Measure the full range of sound that is produced from your computer, tablet, or phone. Take sound meter readings starting at the lowest volume level and continue to take readings at each interval indicated on the equipment by numbers, bars, etc. Be sure that you keep the sound meter the same distance from the sound source throughout your testing. Repeat the experiment with head phones if you have them. Is there any difference between the sound levels at each interval from the speaker versus from the head phones?
- You do the math: For those of you familiar with logarithmic calculations, use the inverse square law to calculate how a large change in distance would affect the decibel readings of a location in your first experiment. Select the data from one of the noisier locations in your original experiment above.
- Determine what the decibel level would be if the same sound were heard from an additional 20 meters away; from an additional 50 meters away.
- How far away would you have to move from the sound to get the decibel level under 85 dB (less than the level scientists believe can cause hearing damage)?
- Investigate and explain the relationship between decibel numbers and the power of sound as measured in microwatters per square meter (μW/m2). Convert the decibel readings in your experiment to changes in μW/m2.
- Frequency response: the human range of hearing goes from about 20 to 20,000 Hertz (Hz), but we are more sensitive to sounds at certain frequencies. Use a tone generator app or website to play tones at a fixed frequency. Does the perceived loudness of the sound change at different frequencies, even if you keep the speaker volume constant? What about the measured intensity with a decibel meter? Do you think the frequency response of the human ear and an electronic microphone are the same? For example, try playing an ultrasonic sound with speakers (close to or above 20,000 Hz). Can your decibel meter measure the sound, even if you cannot hear it?
- For an experiment that shows you how to measure how good your hearing is, see the Science Buddies project Measuring Your Threshold of Hearing for Sounds of Different Pitches.
Careers
If you like this project, you might enjoy exploring these related careers:


Related Links
- Science Fair Project Guide
- Other Ideas Like This
- Physics Project Ideas
- Science With Your Smartphone Project Ideas
- My Favorites
- Projects Involving Human Subjects
- Sample Size: How Many Survey Participants Do I Need?