Abstract
Many things in nature are periodic: the seasons of the year, the phases of the moon, the vibration of a violin string, and the beating of the human heart. In each of these cases, the events occur in repeated cycles, or periods. In this project, you will investigate the periodic motion of a spring, using a mini Slinky®. You can also measure the motion of your spring using a smartphone equipped with a sensor app. Basic physics will then allow you to determine the Hooke's Law spring constant. Your analysis will also yield the effective mass of the spring, a factor that is important in real-world engineering applications.Summary
David Whyte, PhD, Science Buddies
Edited by Ben Finio, PhD, Science Buddies
Slinky® is a registered trademark of Poof-Slinky, Inc.
Microsoft, Microsoft Excel is a U.S. registered trademark of Microsoft Corporation.

Objective
In this science fair project you will investigate the mathematical relationship between the period (the number of seconds per bounce) of a spring and the load (mass) carried by the spring. Based on the data you collect, you will be able to derive the spring constant, as described in Hooke's Law, as well as the effective mass of the spring.
Introduction
This project requires very simple materials to explore the physics of periodic motion. All you need is a mini Slinky® and some weights, such as small fishing sinkers. The Slinky is a spring, which follows Hooke's law. Hooke's law states that when a spring is displaced from its equilibrium position, it experiences a restoring force proportional to the displacement from equilibrium and the spring constant:
Equation 1:
- F is the restoring force in newtons (N)
- k is the spring constant in newtons per meter (N/m)
- x is the displacement from equilibrium in meters (m)
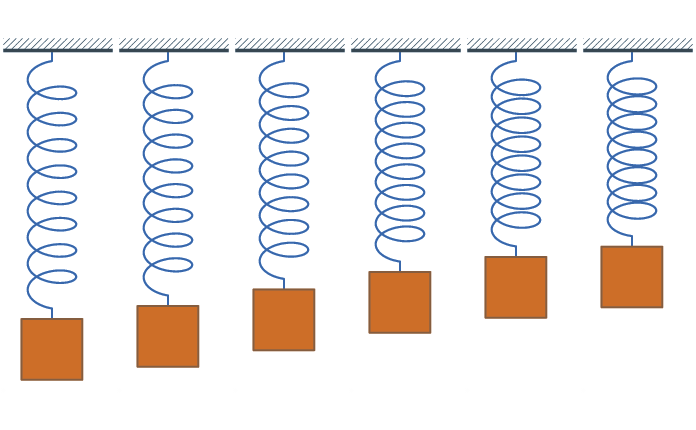
When you add a weight to a spring and stretch it then release it, the spring will oscillate before it returns to rest at its equilibrium position. This system is called a simple harmonic oscillator (Figure 1).
 Image Credit
Figure 1. Animation of a simple harmonic oscillator.
As you add more weight to the spring, the period, or amount of time it takes to complete one oscillation cycle, changes. In this project, you will determine how adding more mass to the spring changes the period, T, and then graph this data to determine the spring constant, k, and the equivalent mass, me, of the spring. Equation 2 relates period to mass, M:
Equation 2:
- M is the load on the spring in kilograms (kg)
- k is the spring constant in Newtons/meter (N/m)
- T is the period in seconds (sec)
In an ideal spring-mass system, the load on the spring would just be the added weight. But real springs contribute some of their own weight to the load. That is why the Slinky bounces even when there is no weight added. So the equation can be modified to look like this:
Equation 3:
In this equation, the total mass pulling down on the spring is actually comprised of two masses, the added weight, m, plus a fraction of the mass of the spring, which we will call the mass equivalent of the spring, me. Rearranging Equation 3 will give you the form of the equation you will use later for graphing, so:
Equation 4:
Based on this equation, if you graph the added mass, m vs. T2/4π2, you will be able to find the spring constant, k, and the equivalent mass, me, of the spring.
Terms and Concepts
- Spring
- Hooke's law
- Spring constant
- Oscillate
- Simple harmonic oscillator
- Period
Optional terms for using Google's Science Journal:
- Sinusoidal
- Velocity
- Acceleration
- Accelerometer
Questions
- How does adding mass change the period of a spring?
- Would a stiffer spring have a shorter or longer period than a less-stiff spring with the same mass?
- What are some real-world examples of simple harmonic oscillators?
Bibliography
- Nave, R. (n.d.). Simple Harmonic Motion. Hyperphysics. Retrieved August 11, 2017.
- Nave, R. (n.d.). Hooke's Law. Hyperphysics. Retrieved August 11, 2017.
- Science Buddies Staff (n.d.). Linear and Nonlinear Springs Tutorial. Science Buddies. Retrieved August 11, 2017.
Materials and Equipment
- Mini Slinky, available from Amazon.com, or a spring from a hardware store
- Weights to hang from the spring. Here are some tips:
- Fishing sinkers work well since they have holes in them for attaching to the spring. You could also use hex nuts, or AAA batteries attached to the wire with tape.
- You will need five identical items to get a spread of data for the graph. The total weight should be around 35 g, or approximately 1 ounce.
- Depending on the weights you choose, you might need fine wire or string to attach the weights to the spring.
- A scale for measuring actual mass of weights used, accurate to +/- 1 gram. Use an electronic kitchen scale, a scale from your school lab, or a postal scale.
- Stopwatch, or clock with a second hand. Optionally, you can use a smartphone to measure your spring's period instead (see the Using a Sensor App section of the procedure for more details).
- Lab notebook
- Graph paper
- Optional: Smartphone with a sensor app such as phyphox, available for free on Google Play for Android devices (version 4.0 or newer) or from the App Store for iOS devices (iOS 9.0 or newer).
- Note: the materials required for the project might change slightly if you decide to use a phone. You will need a stiffer spring (mini Slinkies are too flexible to hold the weight of the phone) and materials to attach the phone to the spring, like rubber bands, paper clips, string, or tape.
Experimental Procedure
Note: In this project, you will measure the motion of a simple harmonic oscillator made from a spring and some weights. Optionally, you can also measure its motion using a smartphone and a sensor app as described in the Using a Sensor App to Measure Period section.
- Do your background research so that you are knowledgeable about the terms, concepts, and questions above. Be sure to record your data in your lab notebook as you go along.
- Measure the mass of one of your weights, using the scale. If your scale does not measure small weights, you can weigh all five of your weights and divide by five. Then measure the mass of the spring.
- Perform the following steps to collect your data:
- Hold one end of the spring in your hand and let it bounce gently down and then back up.
- Count the number of cycles the spring makes in 60 sec with no weight hanging from it.
- Hang one weight from the spring (using a fine wire or string, if needed).
- Count the number of cycles the spring goes through in 60 sec with the weight attached.
- Perform at least three trials for each weight.
- Repeat steps c–e for a series of different weights.
- Keep track of your results in a data table like Table 1.
|
Load (mass added to spring) (g) |
Number of cycles per 60 sec | Average | ||
|---|---|---|---|---|
| Trial #1 | Trial #2 | Trial #3 | ||
- Make another table like Table 2 to convert your raw data into numbers that can be used to determine the spring constant and spring's effective mass.
| A | B | C | D | E |
|---|---|---|---|---|
| Added mass (kg) |
Average # cycles in 60 sec (cycles/min) |
f, the frequency, or cycles per second (cycles/sec) |
T, the period of spring, or the time for each cycle (sec) |
T²/4π² (sec ²) |
| Convert to kilograms | From Table 1 | Divide "Average # cycles in 60 sec" in column B by 60 | Reciprocal of cycles per second in column C (divide 1 by the numbers in column C) | Multiply value in column D by itself and divide by 4(π)² |
- Make a graph with "Added mass," m, in kilograms, on the y-axis, and T²/4π² in sec², on the x-axis. Use kilograms rather than grams so that the value of k is in units of N/m, which is equivalent to kg/sec². Usually you are instructed to graph the independent variable (mass in this case) on the x-axis and the measured parameter (T²/4π²) on the y-axis. You should ignore this rule in this project since graphing m on the y-axis will let you read me from the y-intercept.
This graph of m vs. T²/4π² has the same terms found in Equation 4:
Equation 4:
Let's look at the equation. It has a form similar to the equation of a straight line: y = ax + b, where a is the slope and b is the y-intercept. In fact, Equation 4 is an equation for a straight line, with slope equal to k, the spring constant, and y-intercept equal to the negative value of me. In other words, there is a linear relationship between m and T²/4π², so a graph of m vs. T²/4π² (Figure 2) will be a straight line with slope k and y-intercept -me. The reason you calculated T²/4π² was to be able to read the values of k and me from the graph of m vs. T²/4π².
 Image Credit: Science Buddies
Figure 2. Graph of m vs T²/4π²How do you determine the slope of the line you have drawn? The slope is measured as change in m, divided by the change in T²/4π², over the same range.
Equation 5:
Δm/Δ T²/4π² can be read as "delta m over delta T²/4π²", with the Greek letter for delta, Δ, indicating "change of." Make another table like Table 3 to find the slope. Pick points that are near the ends of the graph, rather than adjacent points.
| Added mass (kg) | T²/4π² (sec²) | Δy (kg) | Δx (sec²) | Δy/ Δx (kg/sec²) |
|---|---|---|---|---|
| Subtract one y value from another, larger y value | Subtract one x value from another, larger x value | This is the spring constant, k, in units of N/m (kg/sec²) |
||
Once you have determined the value of the spring constant, k, from the slope of the line, you are ready to determine the effective mass of the spring. To do this, extend the straight line until it intersects the vertical y-axis. The line will intersect the y-axis at - me (negative me). Based on theoretical considerations, the absolute value of me should be around one-third of the mass of the spring.
Optional: Using a Sensor App to Measure Period
When your weights oscillate up and down, their motion is periodic, as described in the introduction. When you use a stopwatch to measure the phone's period, you do this based on its position (for example, how long it takes the phone to start at the top, go down to the bottom, and return to exactly where it started at the top). If you could trace the phone's vertical position on a graph over time, it would be sinusoidal. You can determine the period of a sine wave by measuring the horizontal distance between two peaks, or any other identical points between two periods (Figure 3).
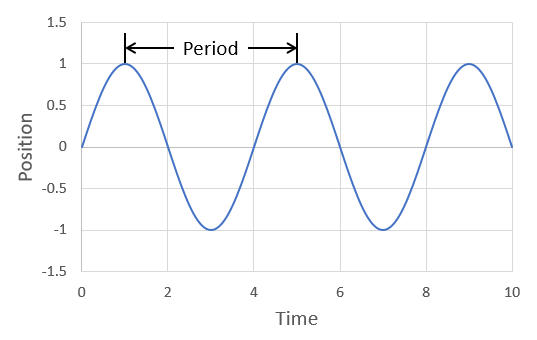 Image Credit: Ben Finio, Science Buddies / Science Buddies
Figure 3. The period of a sine wave.
Since the phone's position is periodic, its velocity (change in position over time) and acceleration (change in velocity over time) are also periodic. This means that if you can measure and graph them over time, you will also see a sine wave, and can determine the period from that sine wave. This is convenient because we can measure acceleration with a device called an accelerometer. Accelerometers are built in to most smartphones and video game controllers to allow motion control. Sensor apps such as phyphox allow you to record data using the phone's accelerometer. Based on this information, think about how you could do this experiment using a phone equipped with a sensor app, instead of a stopwatch, to measure the spring's period of oscillation:
- Figure out a way to hang your phone from a spring (Figure 4). Materials like rubber bands, paper clips, tape, and string could all be useful. Try to make sure your phone stays vertical, without wobbling or tipping side-to-side.
- The phone adds a lot of weight to the spring. You will need to include the weight of the phone in your calculations. Make sure you have a spring that is stiff enough to support the weight of your phone, in addition to the weights you use for the experiment. If you hold one end of the spring in your hand then release the phone, the phone should not hit the ground. If a mini Slinky is not stiff enough to support the weight of your phone, get a stiffer spring from a hardware store.
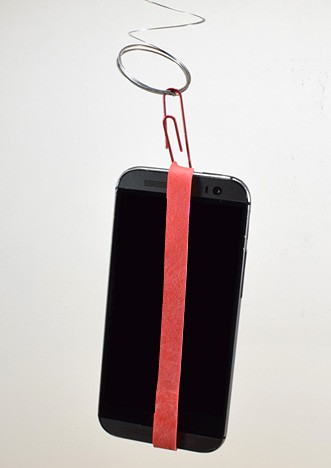 Image Credit: Ben Finio, Science Buddies / Science Buddies
Figure 4. Phone attached to spring using a rubber band and paper clip.
- Open your sensor app. If you use phyphox, select the accelerometer with g function. Make sure you choose the accelerometer graph (X, Y, or Z) that takes measurements in the same direction the phone is moving (do not take side-to-side measurements if the phone is moving up and down, or your readings will not be correct).
- Measure the phone's oscillations using the sensor app.
- Hold one end of the spring in one hand.
- Confirm that you have selected the accelerometer that records the direction you would like to measure, based on your phone's orientation.
- When you are ready, press the play button in phyphox to start a recording.
- Make sure the phone is vertical and the spring is in its neutral position.
- Drop the phone and allow the spring to oscillate until it comes to a stop.
- Press the pause button to stop recording and save your data.
- View the resulting graph after recording your data. Measure the time (x-axis) value between two adjacent peaks in the graph. In the phyphox app, use the 'pick data' tool to select the highest points of two adjacent peaks. Once you have picked a data point the app will display its x- and y-values. Find the difference between these two times to calculate the period. Figure 5 shows an example graph.
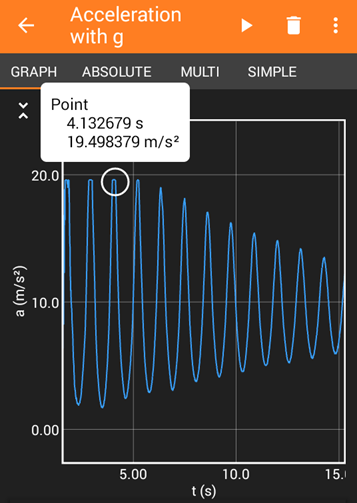 Image Credit: Ben Finio, Science Buddies / Science Buddies
Example graph shows the acceleration recorded from a smartphone that is attached to a spring. The graph is a relatively constant wave pattern with time on the x-axis and acceleration on the y-axis. The peak of the acceleration is marked at the third peak with a value of 19.5 meters per second squared.
Figure 5. Example acceleration graph. The x-axis of this graph shows time in seconds (s) and the y-axis shows acceleration in meters per second squared (m/s²). The data cursor shows a peak in the graph at 4.1 seconds.
- Does recording data in this manner give you any additional insight that you could not get just by using a stopwatch? For example, does the oscillation period change over time, or remain constant? What about the amplitude (height) of the oscillation?
- Optional: Have a friend use a stopwatch to measure the period while you take measurements with the sensor app. Which method do you think is more accurate? Does your answer change if you take measurements over a certain number of periods (e.g. 10) or a certain amount of time (e.g. one minute)?
Ask an Expert
Variations
- Perform the project with different types and sizes of springs.
- For an experiment using a spring-based mechanical model of the human knee, see the Science Buddies project Deep Knee Bends: Measuring Knee Stress with a Mechanical Model.
- For a project to investigate Hooke's law and to determine the spring constant by an alternative procedure, see the Science Buddies project Applying Hooke's Law: Make Your Own Spring Scale.
Careers
If you like this project, you might enjoy exploring these related careers:


Related Links
- Science Fair Project Guide
- Other Ideas Like This
- Physics Project Ideas
- Science With Your Smartphone Project Ideas
- My Favorites
- Stress, Strain, & Strength
- Applying Hooke's Law: Make Your Own Spring Scale