Abstract
Do you ever feel like you need to move your legs faster than your parents do just to keep up with them? This could be because of the difference in leg length between you and your parents. How many more steps do you need to take compared to your parents to walk down the block? Can you use a walking test to determine how tall a person is? This science project will help you find out! You can even use your phone and a sensor app to record the steps and determine the pace.Summary

Objective
Test if the height of a person is related to the length of their steps, and if this information can be used to estimate a person's height.
Introduction

An activity tracker or fitness tracker is an electronic device that is often used by joggers or walkers to tell them how far a distance they have traveled, how much energy was used during the activity, etc. Its predecessor is the pedometer (Figure 1). The name pedometer comes from the Latin words "ped," which means to walk, and "meter," which means to measure. Pedometers measure the number of steps taken and use that to calculate the distance walked.
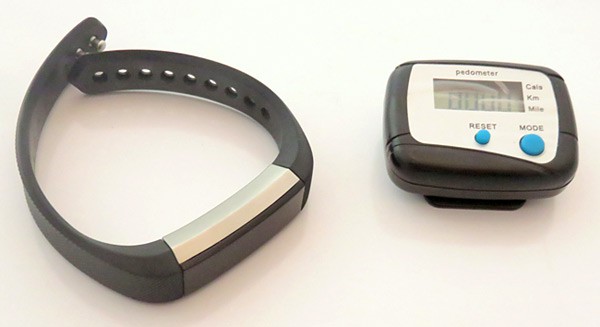 Image Credit: Sabine De Brabandere, Science Buddies / Science Buddies
Figure 1. A picture of a fitness tracker (left) and a pedometer (right).
Wondering how a pedometer works? Pedometers detect the swinging or bouncing motion that occurs with every step you take. They count the number of swings or bounces to obtain a number of steps. Older pedometers used mechanical switches or swinging levers to pick up motion. Newer electronic devices contain special measuring parts called accelerometers. These measure changes in motion in three different directions (up/down, front/back and side-to-side). Figure 2 shows how an accelerometer in a cellphone measures changes in motion in three directions. Newer electronic pedometers use data from the accelerometer to measure the number of steps taken.
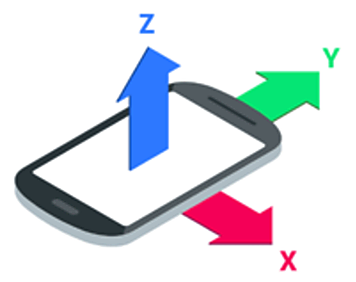 Image Credit: Google / Google, used with permission
Figure 2. Accelerometers in cell phones and other electronic devices measure the change in motion in three directions. In mathematics and physics, these directions are usually labeled X, Y, and Z.
How can a pedometer or fitness tracker determine how far you have walked based on how many steps you have taken? It does this by assuming each step is the same length. Some pedometers ask you to enter your height, or how tall you are, before you start walking, and use that to estimate the length of your step. By multiplying the length of each step by the counted number of steps, the pedometer can calculate the total distance traveled. This relies on an important assumption, though—that a person's height can be used to predict the length of their step! Do you think this is true? In this project, you will find out by asking people of different heights to walk a certain distance, and counting how many steps each of them takes.
Terms and Concepts
- Activity tracker or fitness tracker
- Distance
- Pedometer
- Accelerometer
- Height
- Hypothesis
- Pattern
- Best fit
- Estimate
Questions
- What does a pedometer measure, and what does it calculate?
- Do you think that taller people have longer steps and smaller people have smaller steps? If so, why would this be?
- If you measure a person's height, do you think you can estimate how long their step will be? Do you think you will be able to do it after you have completed this project?
- What about the other way around—if you measure the length of a person's step, do you think you can estimate how tall they are?
Bibliography
- Peaceful Playgrounds. (n.d.). Pedometers for Kids Track Physical Activity. Retrieved October 23, 2013.
- Klein, Aaron. 1977. You and Your Body: A Book of Experiments to Perform on Yourself. Garden City, New York: Doubleday and Company, Inc.
- Rubber Bug Animation (n.d.) Anatomy of a Walk.. Retrieved March 2, 2017.
For help creating graphs, try this website:
- National Center for Education Statistics, (n.d.). Create a Graph. Retrieved June 25, 2020.
Materials and Equipment
- Pen or pencil
- At least 10 volunteers; try to get people with different heights
- Sidewalk chalk
- Tape measure, metric
- Optional: Graph paper
- Straight edge ruler
- Lab notebook
- Optional: armband cell phone bag, like this one from Amazon
- Optional: Smartphone with a sensor app such as phyphox, available for free on Google Play for Android devices (version 4.0 or newer) or from the App Store for iOS devices (iOS 9.0 or newer).
Disclaimer: Science Buddies participates in affiliate programs with Home Science Tools, Amazon.com, Carolina Biological, and Jameco Electronics. Proceeds from the affiliate programs help support Science Buddies, a 501(c)(3) public charity, and keep our resources free for everyone. Our top priority is student learning. If you have any comments (positive or negative) related to purchases you've made for science projects from recommendations on our site, please let us know. Write to us at scibuddy@sciencebuddies.org.
Experimental Procedure
Note: There are two different ways to do the experiment. In one method, the volunteer will count his or her own steps. In the other method, you will use a smartphone and a sensor app to record the motion of your volunteer's ankle as the volunteer walks, then count the number of steps based on the recorded motion. The procedure describes both ways.
Preparing the Experiment
- In your lab notebook, make a table like Table 1 to record your data while you do your experiment. Make sure your table has enough rows for at least 10 volunteers.
| Data taken for walking 20 meters | ||
|---|---|---|
| Height (cm) | Number of Steps Taken | |
| Volunteer 1 | ||
| Volunteer 2 | ||
| Volunteer 3 | ||
| ... | ||
| Volunteer 10 | ||
- Decide on a place for your experiment. The ideal place would be a park with a jogging path.
- Gather volunteers and explain the experiment to them. You may also want to check your science fair rules on involving human subjects in your project.
- Use friends and family as volunteers. Make sure you have volunteers of different heights.
- As an alternative, you can ask people walking by to help you with your science project. If you choose this option, be sure to ask your parents' permission to speak with strangers and have a parent or adult come with you and supervise while you seek and talk to volunteers.
- Decide on how to count the number of steps. The options are:
- Let each volunteer count his/her steps taken as they walk.
- Use a smartphone and a sensor app to obtain the number of steps taken by the volunteer. See section Counting the Number of Steps with a Sensor App for details on how to do this.
Counting the Number of Steps with a Sensor App
This section explains how to use a sensor app to collect data. You can skip this section if you decided to let your volunteers count the number of steps taken. Sensor apps such as phyphox let you record data using sensors that are built into many smartphones, including an accelerometer, which measures motion. Specifically, it measures acceleration, or the changes in an object's speed. The following section explains how to use the accelerometer to record the motion of the ankle of a person walking, and then how to count the number of steps taken from the recorded data. Be sure to practice using the app to count the number of steps before you go out and do the experiment.
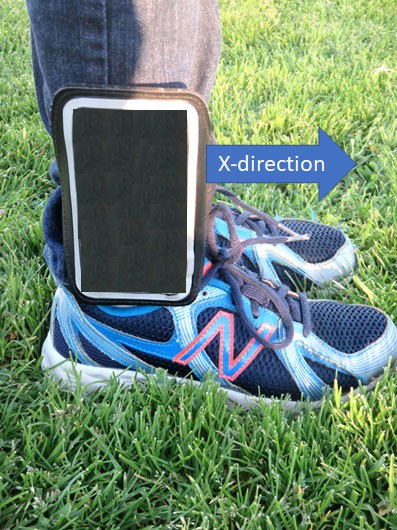 Image Credit: Sabine De Brabandere, Science Buddies / Science Buddies
Figure 3. Phone attached to the ankle using an armband cell phone holder. The phone is positioned so its X-direction aligns with front-to-back motion when you walk.
Sensor App Instructions
- Open the sensor app on your phone.
- If you use the phyphox app, open the acceleration with g sensor. Then select the accelerometer that measures the X-acceleration, or the speeding up and slowing down in the X direction, by pressing on the Accelerometer x graph.
- Attach the phone to the ankle. Make sure the long side of the phone is aligned with the leg, and the phone's screen is facing outward, as shown in Figure 3. An armband cell phone bag works well to keep the phone securely attached.
- In the phyphox app, press the play button to start a recording and start walking. Walk 10 to 20 steps in a straight line (remember exactly how many steps you take, as you will need this number later). This will help you get to know the app. For your experiment, your volunteers will walk a marked distance of 20 m.
- Press the pause button to stop recording the motion of your ankle and save your experiment.
- Take out your phone and look at the recorded graph. Your data should look something like the graph in Figure 4.
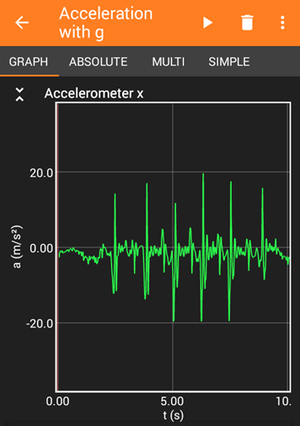 Image Credit: Sabine De Brabandere, Science Buddies / Science Buddies
A Google acceleration graph measures the acceleration of a persons foot while walking. The minimum acceleration recorded was -19 and the maximum was 19 meters per second squared. The majority of the graph alternates between high and low spikes in acceleration from beginning to the end.
Figure 4. Example data from the phyphox app. The x-axis of the graph shows time in seconds [s] and the y-axis is acceleration in meters per second squared [m/s2]. Your data will not look exactly like this, but it should show a repeated pattern of peaks and valleys.
- Your graph should show a repeated pattern as your phone repeatedly goes through the same movements as you walk. Figure 5 highlights the pattern for the data shown in Figure 4. Can you find a repeated pattern in your data?
- Note: You do not need to know exactly which part of the graph corresponds to which part of your step (for example, exactly when you first lift your foot off the ground). The important part is to identify the repeating pattern in your graph, as each repetition of the pattern corresponds to two complete steps (one with each foot). See the Variations section for an idea about how you can match the graph to your ankle's motion.
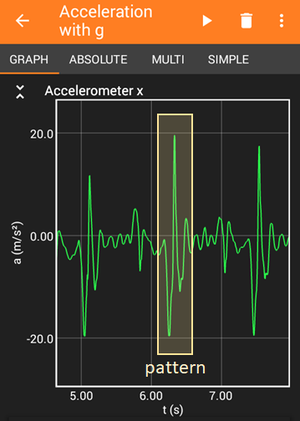 Image Credit: Science Buddies
A pattern is found in sections of an acceleration graph that show acceleration increasing, returning to 0 and then increasing again before leveling out near 0. This pattern repeats at regular intervals on an acceleration graph created from a person walking.
Figure 5. A zoomed-in view of the data from Figure 4, with the repeating pattern highlighted. The x-axis of the graph shows time in seconds [s] and the y-axis is acceleration in meters per second squared [m/s2].
- Use your graph to determine the number of steps taken.
- Count how many times the pattern is repeated in your graph. Note that your first step or two might be less pronounced (the peaks and valleys in the graph will not be as tall) because you are still speeding up, but you should still count them. The pattern in Figure 4 repeats six times.
- Count two steps for each pattern repetition, as the pattern indicates two steps. You end up with total number of steps taken. For example, since the pattern in Figure 4 repeats six times, that means 12 steps were taken. You can obtain the total number of steps (12 in the example) by counting by twos or multiply the number of patterns (six in the example) by 2.
- Compare this to the actual number of steps you took to see if they match.
- Practice a few times, so you get used to recording the graph and finding the number of steps from the graph. When walking over longer distances, you might need to zoom into the graph to get an accurate count. Note that you might be able to identify a half pattern at the end if you took an odd number of steps.
Doing the Experiment
- Go to the set location. Do not forget to bring your lab notebook, pen, chalk, tape measure, your supervisor, and, optionally, a phone equipped with a sensor app and the armband cell phone bag.
- At the location, mark off a distance of 20 meters (m) with a piece of sidewalk chalk.
- Briefly explain your science project to the volunteers. Make sure to explain that they should walk at their natural pace and not try to speed up or walk extra slow!
- Run the test for each volunteer, one at a time (people may adjust their natural pace when walking next to each other):
- Measure the height of the volunteer with your measuring tape in centimeters (cm). Write down the measured height in your data table.
- Option 1: The volunteer counts steps.
- Ask the volunteer to walk from the beginning to the end of the 20 m course you marked, while counting the number of steps they take. Write down the number of steps in your data table.
- Option 2: Use a sensor app to count the number of steps.
- Have your sensor app open. Make a new recording for each volunteer.
- Remember to take your measurements with the X accelerometer (in the accelerometer with g function in phyphox).
- Attach the phone to the ankle of the volunteer as shown in Figure 3.
- Position the volunteer at the beginning of your 20 m course.
- Press the play button to start recording and ask the volunteer to walk to the end of the course.
- Press the pause button to stop recording.
- Detach the phone and save your data.
- Important: Make sure you keep track of which recording is for which volunteer. You can for example change the default name of the recording in the app to the volunteer's name.
- Politely thank the volunteer for helping you with your experiment.
- Repeat for a total of at least 10 volunteers.
- Walk the 20 m course yourself, and write down the number of steps you took in your lab notebook.
Analyzing the Data
- If you used a sensor app to collect data: go over the graphs for each volunteer, count the steps, and write the number of steps down in your table like Table 1. Remember, each repetition of the pattern represents two steps. Look back at section Counting the Number of Steps with a Sensor App if you need help with counting the number of steps.
- Create a graph. You can make the graph by hand or use a website like Create a Graph to make an XY scatter graph and print it out.
- Plot the height (in cm) on the horizontal axis (X-axis) and the number of steps on the vertical axis (Y-axis).
- When you are done plotting your points, you should have one dot for each volunteer.
- Look at your dots and see if they almost make a straight line. Use a ruler to draw a "line of best fit" through the dots. To make a line of best fit, do the best you can to line up a ruler through the middle of the dots and draw your line. Some points will be above the line, some under. That is fine.
- Can you find how you can use your line of best fit to estimate, or roughly calculate, the height of a person when you know the number of steps they take to walk 20 m? To test this, find the number of steps you took to walk 20 m in your lab notebook and use your line of best fit to estimate your own height (in cm). Compare the estimated height with your real height (in cm). How accurate is your estimate?
- Looking back at your data and graph, do you think there is a reliable relationship between the height of an individual and the number of steps they take to walk 20 m? How can this information be used by a pedometer or fitness tracker?
Ask an Expert
Global Connections
The United Nations Sustainable Development Goals (UNSDGs) are a blueprint to achieve a better and more sustainable future for all.

Variations
- Make another data table for estimating the height of a person based on how many steps they take to walk a certain distance, using the best fit line from your graph. It should have columns for the number of steps, the estimated height, and the actual height. Now find more volunteers and try to estimate their height based upon your line of best fit and the number of steps they take to walk 20 m. How often are you close to their real height? How accurate are your estimates?
- Do you think the distance you have people walk affects the precision of your experiment and the quality of your best-fit line? What happens if you only count steps over a short distance (5 meters) or a longer distance (40 meters)?
- How does the speed of walking affect the number of steps required to go a certain distance? You can do an experiment where you walk the 20 meter distance slowly, moderately fast, or very fast to see if the number of steps changes with speed. Will there be more steps for slower or faster walking? What about running?
- Would taller people take less time to walk the 20 m course? If you recorded your data with a sensor app, you can look back at your recorded graphs and read the duration of the walk from the graphs. Make a new scatter plot with the height of the person on the X-axis and the duration on the Y-axis. Do you see a clear relation? If you did not use a sensor app, you can use a stopwatch to time how long it takes each volunteer to walk 20 meters.
- Do people of the same height all take steps of the same length? What if two people are the same height but one of them has longer or shorter legs relative to their body? Try to find a bunch of volunteers who are about the same height, and measure their total height and the length of their legs. Does the ratio of leg length to body length affect how many steps they take to walk a certain distance?
- If you have a video camera, you can use it to find out how exactly the graph from your sensor app corresponds to walking motion. Use the camera to film a person walking from the side, and hit record on the camera at the same time someone hits record in the app. Then, the video's timeline will be synced up with the x-axis time of the recorded data. What point in your step (for example, when you first lift your foot up, when your foot is off the ground, when you put your foot down, etcetera) do the peaks and valleys in the graph correspond to?
Careers
If you like this project, you might enjoy exploring these related careers:


Related Links
- Science Fair Project Guide
- Other Ideas Like This
- Sports Science Project Ideas
- Science With Your Smartphone Project Ideas
- My Favorites