Abstract
Have you ever wondered how fast a seismic wave from an earthquake travels? In this geology science project you can figure this out using historical seismograph data that you can collect from the comfort of your own computer. You will use a web interface to a network of seismometers run by the Northern California Earthquake Data Center, at the University of California, Berkeley. From the seismograms you make, you will be able to measure the time it took for the seismic waves to travel from the earthquake epicenter to the recording station in California. Once you measure the distance between the two points, you will be able to calculate the speed of the seismic waves. Check it out!Summary
Teisha Rowland, Ph.D., Science Buddies
Sources
This project was inspired by the "Make Your Own Seismogram!" webpage:- The Regents of the University of California. (2012, April 25). Make Your Own Seismogram! Northern California Earthquake Data Center, University of California, Berkeley Seismological Laboratory and United States Geological Survey. Retrieved December 20, 2012.
/-/https/www.sciencebuddies.org/cdn/Files/2744/3/Geo_img017a.gif)
Objective
Use archived, online seismometer data from the Berkeley Digital Seismic Network to create your own seismograms in order to measure how fast seismic waves from distant earthquakes travel through the Earth's crust.Introduction
A seismograph is an instrument that detects and records ground motion. As an analogy, think of trying to draw a straight line on a piece of paper while someone is holding your elbow and jiggling it back and forth. It would be hard to get the line straight!
You can think of a seismograph as a machine that is kind of like your arm, holding the pen. The 'elbow' end of the machine detects the vibrations, causing the pen to move back and forth. Meanwhile, a roll of paper is moving at a constant speed under the pen. When there are no vibrations, the pen draws a straight line on the paper. When the ground shakes, such as from an earthquake, it causes the pen to move back and forth, so instead of straight lines, you get up and down squiggles. The greater the vibrations, the larger the squiggles. The record the seismograph makes in this way is called a seismogram. In the digital age, seismographs have been replaced by seismometers, which measure and record ground motion digitally. The data from seismometers can be collected automatically and analyzed with computers.
To understand how a seismograph measures how powerful an earthquake is, it is important to know what is happening when an earthquake occurs. The entire outer shell of the Earth, known as the lithosphere (which contains the upper part of the mantle and the crust), is made up of tectonic plates that are constantly moving. There are seven or eight large tectonic plates and many more minor ones. Where the tectonic plates meet and bump together, it is common to find mountains, volcanic activity, mid-ocean ridges, and earthquakes. (What forms depends on how exactly the tectonic plates are moving against each other at the plate boundary.) The movement of the tectonic plates also causes faults to form, which are cracks in the Earth's surface where a plate, or parts of a plate, moves in different directions. Faults are usually near the edge of a plate. When two tectonic plates (or parts of the same plate) bump or catch as they slide past each other at the fault, earthquakes usually occur. Specifically, as the plates rub together, when they catch and get stuck it results in a build up of pressure because the rocks want to move but cannot. Eventually, some rocks break and the pressure is released as the plates suddenly move. This causes waves of energy, known as seismic waves, to travel through the Earth, making the ground shake. Where the rocks broke is known as the earthquake's focus, and right above this point, up on the ground, is called the earthquake's epicenter.
How do scientists know how powerful an earthquake is? A network of seismometers constantly monitors movements of the Earth's crust. When an earthquake occurs, seismic waves travel out from its epicenter, through the crust, and are detected by the seismometers. By analyzing the differences in the timing of the waves between multiple stations, scientists can pinpoint the source of the waves: the epicenter of the original quake.
In this geology science project you will use online seismometer data from the Berkeley Digital Seismograph Network (BDSN) to measure how fast seismic waves from distant earthquakes travel through the earth's crust.
Terms and Concepts
- Seismograph
- Earthquake
- Seismometer
- Tectonic plates
- Faults
- Seismic waves
- Epicenter
- Coordinated Universal Time
- Period
- Velocity
Questions
- What causes an earthquake? How is it measured using a seismograph?
- Do you think seismic waves from more powerful earthquakes travel faster than waves from weaker quakes?
- Do you think seismic waves travel faster through oceanic crust or continental crust (or about the same through both)?
Bibliography
For getting started on your background research, here is a good references on seismology:- United States Geological Survey. (2012, July 18). Earthquakes and Plate Tectonics. United States Department of the Interior. Retrieved December 20, 2012.
- United States Geological Survey. (n.d.). Search Earthquake Catalog. United States Department of the Interior. Retrieved December 20, 2012.
- The Regents of the University of California. (2012, April 25). Make Your Own Seismogram! Northern California Earthquake Data Center, University of California Berkeley Seismological Laboratory, and United States Geological Survey. Retrieved December 20, 2012.
- Byers, J.A.. (1997). Surface Distance Between Two Points of Latitude and Longitude. Chemical-Ecology.net. Retrieved December 20, 2012.
Materials and Equipment
- Computer with Internet access and a printer
- Lab notebook
Experimental Procedure
Select Historic Earthquakes to Analyze
- Do your background research so that you are knowledgeable about the terms, concepts, and questions, in the Background tab.
- In your lab notebook, make a data table of historic earthquakes that you want to analyze. You can use this page to search for earthquakes: https://earthquake.usgs.gov/earthquakes/search/. To analyze seismic wave speed, choose 10-20 earthquakes from (roughly) the same part of the world.
- For each earthquake, make a place in your data table to include at least the following information. Use the USGS earthquake catalog to look up the information for each earthquake.
- Magnitude
- Time (in Coordinated Universal Time [UTC])
- Epicenter location (latitude, longitude, depth)
Make a Seismogram
- Go to the Make Your Own Seismogram! webpage at Make Your Own Seismogram! to get started on making a seismogram. The webpage is pretty straightforward. Again, we will walk through an example to show you how to use it.
- Select a station. Click on one of the radio buttons to select from the 28 available stations, as shown in Figure 1. For more information on the stations, see Table 1. For our example seismogram, we used data from station BKS, the Byerly Seismographic Vault, near the UC Berkeley campus.
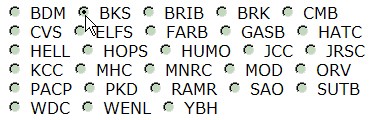
A cropped screenshot of the website earthquake.usgs.gov shows 28 different stations with radio buttons that are selectable when setting parameters for generating a seismogram on the website earthquake.usgs.gov. The station labeled BKS was selected to generate an example graph.
Figure 1. Select one of the 28 stations listed by clicking on the button next to it.
- Select the data channel. There are two types of data channels: 'long period' and 'broadband,' as shown in Figure 2. The long period of a seismic wave is the time that elapses between successive wave crests. The long period channels are good for viewing seismic activity from distant earthquakes, so you should use these channels for this science project. You can choose to look at vertical motion, or horizontal motion (either north-south or east-west).
- The period of a seismic wave is the time that elapses between successive wave crests. Long period waves, then, are low-frequency waves.
- The broadband channels collect information more frequently, and so have information about higher-frequency waves. Broadband channels are good for viewing seismic activity from local earthquakes. See the Make it Your Own tab for project ideas that can make use of the broadband data channels.
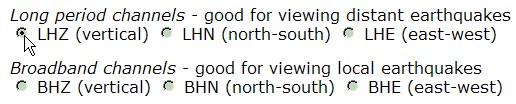
A cropped screenshot of the website earthquake.usgs.gov shows 6 different channels that are selectable when setting parameters for generating a seismogram. There are three long period channels (LHZ[vertical], LHN[north-south], LHE9east-west]) and three broadband channels (BHZ[vertical], BHN[north-couth], BHE[east-west]). The long period channel LHZ was selected for the example graph.
Figure 2. Select "long period" as the channel to use in this science project. Select vertical, north-south, or east-west motion.
- Set the desired time period. The seismogram plot can be a maximum of 24 hours for long period data channels (1 hour for broadband data channels). View seismic data both before and after the time of the earthquake by setting the time period to one entire day.
- Enter the date and time in the format "yyyy/mm/dd,hh:mm:ss". Separate date and time with a comma, but no spaces.
- For example, in the screenshot in Figure 3, we have set the plot to cover the entire day of June 11, 2006.
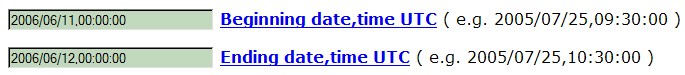
A cropped screenshot of the website earthquake.usgs.gov shows beginning and ending dates and times that can be set as parameters when creating a seismogram. Time must be given in Coordinated Universal Time and in the format yyyy/mm/dd,hh:mm:ss.
Figure 3. Set the time period to one entire day, covering the time both before and after the earthquake.
- Set the plotting parameters. Often, the default parameters, shown in the screenshot in Figure 4, will work just fine. For higher-magnitude quakes, however, you may need to decrease the Amplitude Scaling parameter by a factor of 10 or 20 (or more) so that the active traces do not overwhelm the entire plot.
- You can also increase the spacing between the traces (third parameter), but this will increase the vertical size of the plots, making them harder to view and print.

A cropped screenshot of the website earthquake.usgs.gov shows three factors compression factor, amplitude scaling and pixels between adjacent output traces that can be adjusted when generating a seismogram. Each factor controls a different aspect of the seismogram: x-axis scaling, y-axis scaling and space between traces respectively. In this example the compression factor is set to 1, the amplitude scaling to .005, and the pixels between adjacent output traces to 5.
Figure 4. For the plotting parameters, the default parameters (shown here) often work, but for higher-magnitude earthquakes the Amplitude scaling may need to be decreased by a factor of 10 or 20 (or more).
- You can also increase the spacing between the traces (third parameter), but this will increase the vertical size of the plots, making them harder to view and print.
- Make the seismogram! Click on the "Create Plot" button near the bottom of the page. That is it!
- Select a station. Click on one of the radio buttons to select from the 28 available stations, as shown in Figure 1. For more information on the stations, see Table 1. For our example seismogram, we used data from station BKS, the Byerly Seismographic Vault, near the UC Berkeley campus.
- Here are some tips on "reading" the seismogram plot. As an example, Figure 5 shows a seismogram for June 11, 2006, the day of the magnitude 6.3 quake on Kyushu. (Plotting parameters were: compression factor = 1, amplitude scaling = .004, and pixels between adjacent output traces = 5.)
An example seimogram displays data over the course of 24-hours and contains 96 different traces. Red traces are graphed every hour and black traces are graphed every 15 minutes. Movement in the traces begin to appear at the 20:00:00 mark which indicates the beginning of an earthquake. All traces previous to the 20:00:00 mark are relatively uniform and do not fluctuate much in amplitude or frequency.
Figure 5. Here is an example seismogram of June 11, 2006, the day of the magnitude 6.3 quake on Kyushu, Japan.
-
- The plot contains a series of traces. The y-axis shows the intensity of ground motion, and the x-axis is time.
- Most of the traces in a random 24-hour plot will be flat; squiggles in the traces indicate seismic activity.
- Each trace represents 15 minutes (900 seconds [s]) of data. The first trace of each hour is colored red. It is followed by three black traces—one for each of the remaining quarter-hours.
- Look for the first sign of activity following the UTC time given for the earthquake. In this case, the time of the original earthquake was 20:01:29 UTC (= 20:00:00 hours plus 89 seconds). The first squiggle appears in the red trace at 20:00:00 hours + 810 s.
- Thus, the elapsed time was 810 - 89 = 721 seconds (just over 12 minutes).
- Tip: If you are not sure that a squiggle is related to the earthquake you are studying, try creating a plot for the same time period using one (or more) additional data station(s). This way you can confirm or reject your hunch.
- For each earthquake in your data table, determine the elapsed time and add this information to your data table.
- Here are some tips on printing the seismogram. Since the plots are large, you probably will not have much luck printing directly from the browser window. Instead, save the plot as a file and print it with another program.
- Right click on the plot.
- Choose Save Image As... to save image to file.
- Then import into another program (e.g. Word) for printing.
- Here are some tips if you have problems creating a seismogram.
- Data may not be available for all stations at all times, which means that sometimes you may end up with an error message instead of the seismogram you were looking for. If you see an error message like: "Cannot create seismogram -- apparently there is no data.", try using another station. If that does not work, try selecting a different earthquake to study.
- If you have a hard time seeing the individual traces in a plot, try decreasing the amplitude scaling by a factor 10. (You can also increase the number of pixels between adjacent output traces, but this will increase the vertical size of the plot.)
- If these tips do not help solve your problem, try the help links on the Make Your Own Seismogram! page.
/-/https/www.sciencebuddies.org/cdn/Files/2740/5/Geo_img013.jpg)
/-/https/www.sciencebuddies.org/cdn/Files/2741/5/Geo_img014.jpg)
/-/https/www.sciencebuddies.org/cdn/Files/2742/5/Geo_img015.jpg)
/-/https/www.sciencebuddies.org/cdn/Files/2743/5/Geo_img016.jpg)
/-/https/www.sciencebuddies.org/cdn/Files/2744/3/Geo_img017a.gif)
Calculate the Average Velocity of the Seismic Waves
| Station Code | Latitude (decimal degrees) |
Longitude (decimal degrees) |
Elevation (m) |
Place Name |
| BDM | +37.9540 | -121.8655 | +220 | Black Diamond Mines Park, Antioch, CA, USA |
| BKS | +37.8762 | -122.2356 | +244 | Byerly Seismographic Vault, Berkeley, CA, USA |
| BRIB | +37.9189 | -122.1518 | +220 | Briones Reserve, Orinda, CA, USA |
| BRK | +37.8735 | -122.2610 | +49 | Haviland Hall, Berkeley, CA, USA |
| CMB | +38.0346 | -120.3865 | +697 | Columbia College, Columbia, CA, USA |
| CVS | +38.3453 | -122.4584 | +295 | Carmenet Vineyards, Sonoma, CA, USA |
| ELFS | +40.6183 | -120.7279 | +1554 | Eagle Lake Biol. Field Stn., Susanville, CA, USA |
| FARB | +37.6978 | -123.0011 | -18 | Farallon Islands, CA, USA |
| GASB | +39.6547 | -122.7160 | +1355 | Alder Springs, CA, USA |
| HATC | +40.8173 | -121.4705 | +1009 | Hat Creek Radio Astronomy Obs., Cassel, CA, USA |
| HELL | +36.6801 | -119.0228 | +1140 | Rademacher Property, Miramonte, CA, USA |
| HOPS | +38.9935 | -123.0723 | +299 | Hopland Field Station, Hopland, CA, USA |
| HUMO | +42.6071 | -122.9567 | +555 | Hull Mountain, OR, USA |
| JCC | +40.8175 | -124.0296 | +27 | Jacoby Creek, Bayside, CA, USA |
| JRSC | +37.4037 | -122.2387 | +70 | Jasper Ridge Biol. Preserve, Stanford, CA, USA |
| KCC | +37.3236 | -119.3187 | +888 | Kaiser Creek, CA, USA |
| MHC | +37.3416 | -121.6426 | +1250 | Lick Observatory, Mt. Hamilton, CA, USA |
| MNRC | +38.8787 | -122.4428 | +710 | McLaughlin Mine, CA, USA |
| MOD | +41.9025 | -120.3029 | +1554 | Modoc Plateau, CA, USA |
| ORV | +39.5545 | -121.5004 | +335 | Oroville Dam, Oroville, CA, USA |
| PACP | +37.0080 | -121.2870 | +844 | Pacheco Peak, CA, USA |
| PKD | +35.9452 | -120.5416 | +583 | Bear Valley Ranch, Parkfield, CA, USA |
| RAMR | +35.6360 | -120.8698 | +417 | Ramage Ranch, Paso Robles, CA, USA |
| SAO | +36.7640 | -121.4472 | +317 | San Andreas Geophysical Obs., Hollister, CA, USA |
| SUTB | +39.2291 | -121.7861 | +252 | Sutter Buttes, CA, USA |
| WDC | +40.5799 | -122.5411 | +268 | Whiskeytown Dam, Whiskeytown, CA, USA |
| WENL | +37.6221 | -121.7570 | +139 | Wente Vineyards, Livermore, CA, USA |
| YBH | +41.7320 | -122.7104 | +1060 | Yreka Blue Horn Mine, Yreka, CA, USA |
Table 1. In this table, you can find the latitude and longitude of each of the data stations. You can also click on the data station code to see a webpage with detailed information about that station.
- Because velocity equals distance divided by time, to calculate the velocity of an earthquake's seismic wave you need to figure out how far the seismic waves traveled during the elapsed time you just determined.
- Calculate the distance from each earthquake's epicenter to the seismometer station using the latitude and longitude of each point. Here is how to do this:
- You already have the latitude and longitude of the epicenter of the quake (step 3 of Select Historic Earthquakes to Analyze).
- You can find the latitude and longitude of each of the data stations in Table 1. (Note that you can click on the data station code to see a webpage with detailed information about each station.)
- Use the Surface Distance Between Two Points of Latitude and Longitude webpage at Surface Distance Between Two Points of Latitude and Longitude to find the distance between the epicenter of the earthquake and the data station.
- The calculator requires you to enter the latitude and longitude in degrees, minutes, and seconds, instead of decimal degrees. However, it has a handy converter you can use. Click on the button that says, "Decimal Degrees <> Deg Min Sec". A popup window will open where you can convert from decimal degrees to degrees, minutes and seconds.
- Enter the latitude of the epicenter in decimal degrees, and click on the "Converts to" button, as shown in Figure 6.
- Note: A positive value of latitude is North of the equator, and a negative value is South of the equator. For longitude, a positive value is East of the prime meridian and a negative value is West of the prime meridian.
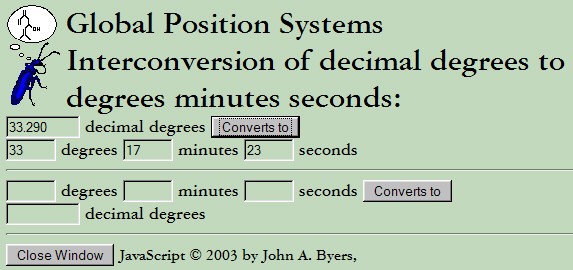
Screenshot of an online calculator on the website chemical-ecology.net that automatically converts decimal degrees to degrees, minutes and seconds. It can also convert degrees, minutes and seconds into decimal degrees. The webpage consists only of boxes to input coordinate values and separate boxes that output the converted coodinate value
Figure 6. To convert latitude and longitude from decimal degrees to degrees, minutes, and seconds, click the button that says "Decimal Degrees <> Deg Min Sec" and this popup window will appear that you can use to do these conversions.
- Now go back to the distance calculator and enter the latitude of the epicenter in degrees, minutes, and seconds, as shown in Figure 7.
- Repeat step 2d and 2e for the longitude of the epicenter, and the latitude and longitude of the data station.
- Once you have entered the latitude and longitude of both points, click on the "Distance between" point to calculate the distance, as shown in Figure 7.
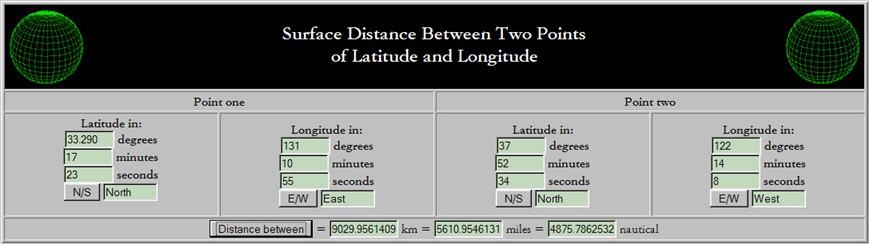
Screenshot of an online calculator on the website chemical-ecology.net that calculates the distance between two points using coordinates. The webpage has four fields to fill in that correspond to the longitude and latitude of two separate points. The longitude and latitude must be entered as degrees, minutes and seconds.
Figure 7. Enter the latitude and longitude of the epicenter and data station (in degrees, minutes, and seconds) in the distance calculator. Once this data is entered, click "Distance between" to calculate the distance.
- For example, the distance between the epicenter of the Kyushu earthquake and the BSK data station is 9030 km.
- For each earthquake in your data table, repeat steps 2c-2g to determine the distance between the earthquake's epicenter and the data station. Add this information to your data table.
- For each earthquake in your data table, calculate the velocity of the seismic wave by dividing the distance by the elapsed time you calculated from the seismogram. Add this velocity data to your data table.
- For our example, the distance is 9030 km, and the time is 721 s. The calculated velocity is 12.5 km/s.
- Calculate the average velocity of the seismic waves from all of the earthquakes in your data table (which should all be roughly in the same area of the world). What is the average velocity of the seismic waves from the earthquakes you studied?
- More advanced students should also calculate the standard deviation.
/-/https/www.sciencebuddies.org/cdn/Files/2745/3/Geo_img018.jpg)
/-/https/www.sciencebuddies.org/cdn/Files/2746/3/Geo_img019.jpg)
Ask an Expert
Global Goals
The United Nations Sustainable Development Goals (UNSDGs) are a blueprint to achieve a better and more sustainable future for all.
/-/https/www.sciencebuddies.org/cdn/Files/19754/5/E-WEB-Goal-11.png)
Variations
- The seismometers measure shaking in three dimensions: vertically (up and down), north-south, and east-west. Do seismic waves in each of these dimensions travel at the same or different speeds?
- Speed vs. magnitude. Do seismic waves from more powerful earthquakes travel faster than those from less powerful earthquakes? Measure speed from ten earthquakes for each of several different magnitudes and compare.
- Interested in making your own seismograph? Try the Science Buddies project Is There a Whole Lot of Shaking Going On?
- You can also use the Make Your Own Seismogram! webpage to create hour-length seismograms using broadband channels, which are good for viewing local earthquakes. Is the seismic wave speed over shorter distances the same as that over larger distances? You can use the USGS website to locate historical earthquakes in northern California. In addition, for a list of recent earthquakes in the region, see http://www.ncedc.org/ncedc/eqinfo.html.
- For a more advanced project that uses seismometer data, try the Science Buddies project Locating the Epicenter of an Earthquake.
- Advanced. Design an experiment to see if there is a relationship between seismic wave speed and the geological features between the earthquake epicenter and the seismic recording station. For example, do seismic waves travel differently through oceanic crust vs. continental crust?
Careers
If you like this project, you might enjoy exploring these related careers:
/-/https/careerdiscovery.sciencebuddies.org/cdn/Files/1359/18/VNIIOarctic.jpg)
/-/https/careerdiscovery.sciencebuddies.org/cdn/Files/1713/17/pexels-photo-3769021.jpg)
/-/https/careerdiscovery.sciencebuddies.org/cdn/Files/1640/26/Fyysikot_tyossaan.jpg)
/-/https/careerdiscovery.sciencebuddies.org/cdn/Files/1402/17/unsplash-anvQH3z5vBY.jpg)

/-/https/img.youtube.com/vi/bOyksqTQBgc/0.jpg)
/-/https/img.youtube.com/vi/aAuN5ZnL4yE/0.jpg)
/-/https/img.youtube.com/vi/dt_eIeKJYbE/0.jpg)