My son project - how many balloons will take to lift him ?
We are trying to figure out by first weighting paper clip and attaching it one balloon
Then a pencil , teddy bear to the number of balloons it ll lift
we will record all of the data from the experiment. We record how much each object weighed, and how many balloons it took lift the object.
We ll also calculate how many balloons it might take to lift the objects in the experiment. After we find out how much weight one balloon could lift we used that data to calculate how many balloons it would take to lift Teddy bear , pencil , clips then calculate lift HIM
But I m not sure on how to put these data in graph
Is there any other way to figure it out and create graph
Pls enlighten me on this
Graph
Moderators: AmyCowen, kgudger, bfinio, MadelineB, Moderators
-
deleted-362338
- Former Expert
- Posts: 22
- Joined: Mon May 30, 2016 8:17 am
- Occupation: Student
Re: Graph
Hello 3monkies,
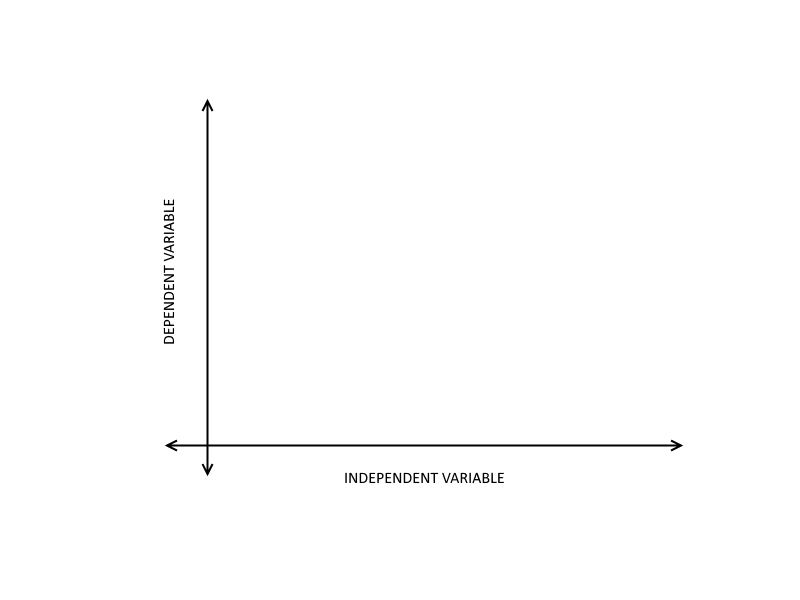
Apologies for the late reply. When you want to graph data from an experiment, it is a good idea to first identify the independent and dependent variables. In short, an independent variable is what you are changing in an experiment and the dependent variable is what changes as a result of the independent variable. (More information on variables here: https://www.sciencebuddies.org/science- ... evariables)
Keeping that in mind, you can plot the numbers on a graph where the independent variable is the x-axis and the dependent variable is on the y-axis:
It is also helpful to create a simple table like the one below before you plot them on your graph to keep track of your data.

From the description of your son's experiment, it seems you are changing the weight of the objects and counting the number of balloons needed to lift the objects. According to the definitions above, the weight of the objects would be your independent variable and the number of balloons would be you dependent variable. Thus, you can graph it as shown in the diagram.
Good luck and feel free to write back with any more questions!
Apologies for the late reply. When you want to graph data from an experiment, it is a good idea to first identify the independent and dependent variables. In short, an independent variable is what you are changing in an experiment and the dependent variable is what changes as a result of the independent variable. (More information on variables here: https://www.sciencebuddies.org/science- ... evariables)
Keeping that in mind, you can plot the numbers on a graph where the independent variable is the x-axis and the dependent variable is on the y-axis:
It is also helpful to create a simple table like the one below before you plot them on your graph to keep track of your data.
From the description of your son's experiment, it seems you are changing the weight of the objects and counting the number of balloons needed to lift the objects. According to the definitions above, the weight of the objects would be your independent variable and the number of balloons would be you dependent variable. Thus, you can graph it as shown in the diagram.
Good luck and feel free to write back with any more questions!
Stephanie Bie