Summary
/-/https/www.sciencebuddies.org/cdn/Files/17081/4/P1100320.JPG)
/-/https/www.sciencebuddies.org/cdn/Files/18108/4/stretched-out-balloon-map.jpg)
Introduction
Have you ever let a map spur your imagination, wondering how life was as a world explorer sailing the oceans in search of new land? Maybe you see yourself drawing a map of your new discoveries. Wait a minute – you just realize Earth is round, so how do you create an accurate flat map? Throughout history, cartographers all around the world have found different methods for creating flat maps of Earth. None can represent reality exactly, but each is useful for specific purposes. Do this activity and see how cartographers today could have helped explorers of the past.
Background
Creating a map of a small area might be relatively easy; however, making a flat map of Earth is a completely different challenge. Cartographers (map makers) have found various ways to create flat maps of the world. These are called projections. How do they do it? There are several ways it can be done, but every type of projection distorts reality in some way. Scientists use a Tissot's indicatrix to quantify distortions that are introduced when creating a map. You will do something similar in this activity. You will draw identically sized circles all over your Earth, create a projection similar to a type of projection called a Mercator projection, and study how the circles are distorted in area, shape, and distance on the flat map. You will be surprised how your circles look on your flat map!
Materials
- Surface covered with butcher paper or other protective material
- Balloon, medium size (e.g. 12 inch balloon)
- Bottle cap (like a bottle cap from a plastic water bottle)
- Permanent marker, medium-thick or thick
- Scissors
- Cardboard piece, 20 x 25 cm or larger; either thick cardboard or two layers of regular cardboard so the push pins do not stick through
- Six push pins
- Two assistants – the activity can be done by yourself, but is easier with assistants
/-/https/www.sciencebuddies.org/cdn/Files/5595/13/mapping-activity-materials.jpg)
Preparation
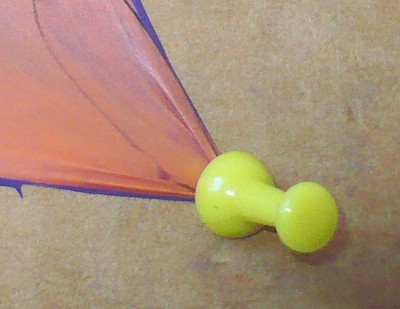
Safety Tip: You will pin the cut-open balloon onto a piece of cardboard in this activity. As further explained later, it is important that the push pins are placed slightly slanted outward (with the points aimed inward and the tips of the pins aimed outward, away from the balloon) so the tension in the stretched balloon does not propel the pins out.
- You will use a balloon to represent Earth in this activity. Blow up the balloon to about half full and tie the balloon. The top of the balloon and the knot represent the North and South Pole, respectively.
- If you would like, use the permanent marker and label the top of the balloon with an "N" and the knot with an "S". This will remind you where the North and the South Poles are located.
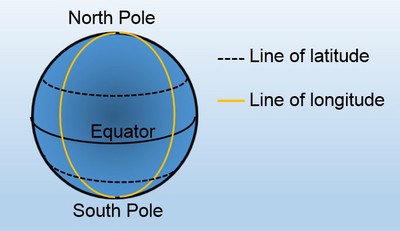
- Draw the equator on the balloon wit permanent marker. The equator is an imaginary line around the center of Earth, which is equidistant (the same distance) from the North Pole and the South Pole. Note: Once your marker lines are drawn, always set the balloon on the butcher paper or on the cardboard to avoid getting dirty prints on your work surface.
- Draw a line of longitude. Lines of longitude connect the North and the South Poles.
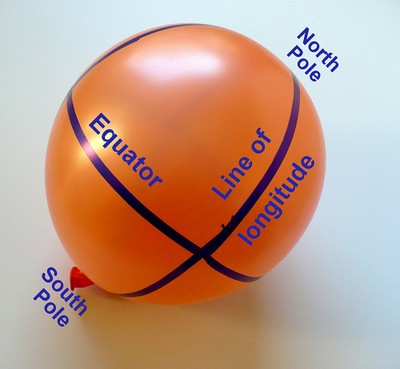
- Draw four equally spaced lines of longitude on the balloon with permanent marker. Lines of longitude are imaginary lines running over the globe, connecting the North Pole with the South Pole. They are perpendicular (at a right angle) to the equator.
- Look. How is this balloon similar to a real globe, and how is it different from a real globe?
/-/https/www.sciencebuddies.org/cdn/Files/5596/14/balloon-equator-meridian.jpg)
/-/https/www.sciencebuddies.org/cdn/Files/5593/12/equator-meridian.jpg)
Instructions
- Inspired by methods used by scientists (like Tissot's indicatrix method), you will draw same-sized circles all over the globe (balloon), create a projection (flat map), and study the distortions.
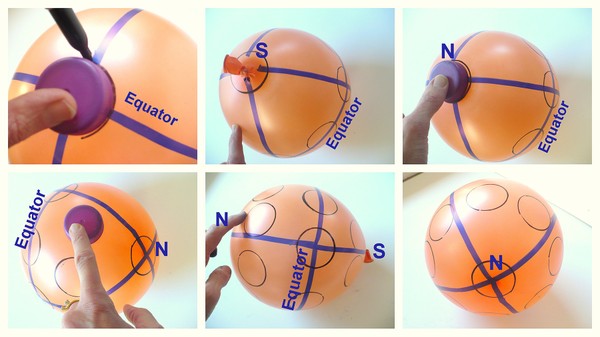
- Start by drawing one circle centered on an intersection of the equator and a line of longitude. Place the bottle cap on the balloon and trace around it with the permanent marker (top left picture in the Figure).
- Now draw circles centered on the intersections of the equator with the three other lines of longitude. You now have four circles on your globe.
- Add four more circles on the equator that are equally spaced between the four circles already there.
- Add a circle on the South Pole (area around the knot, top middle picture in the Figure) and the North Pole (top of the balloon, top right picture in the Figure).
- Add eight circles in the northern hemisphere, about midway between the equator and the North Pole, with two circles between each pair of lines of longitude (bottom left picture in the Figure). Do you notice that these circles are located on the same line of latitude?
- Repeat the previous step for the southern hemisphere. You now have a total of 26 circles drawn on your globe.
- Look at your globe; how are the circles distributed?
- Are the circles on the equator equally spaced? How about the circles between the equator and each pole? Note that these circles are on the same line of latitude as well.
- Are all of the circles equally spaced?
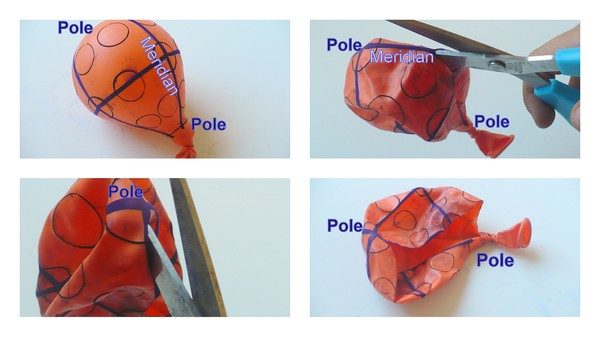
- Use scissors to snip a tiny hole in the balloon, close to the knot. This will deflate (not pop!) the balloon.
- Once the balloon is deflated, cut it open along a meridian or line of longitude from the South Pole (the knot) to the North Pole, but stop a little before the very top of the balloon. Cutting over the very top increases the risk of the balloon ripping when it is stretched out in later steps.
- In the next couple of steps, you will create a projection of your Earth with drawn circles by stretching out the deflated balloon to form a rectangular, flat map. How do you think the circles will look on your projection?
- Put the cardboard in front of you on your work area. Place the push pins within reach.
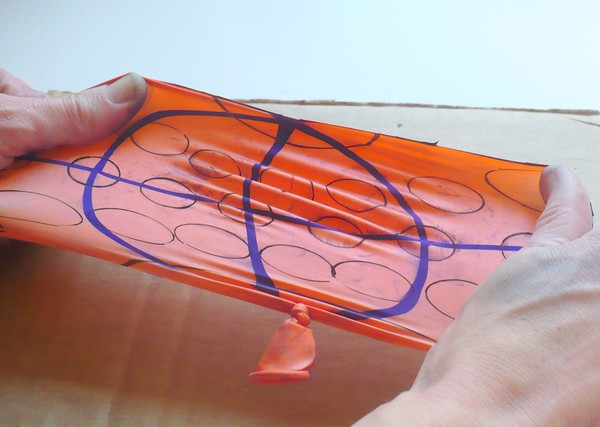
- Work together with your assistant to stretch out the balloon to be flat and as close to rectangular in shape as possible. One person can hold one side, while the other holds the other side of the balloon. Try to get the equator straight and the lines of longitude as straight as possible. Note: Do not stretch the balloon too much, as this could rip the balloon. How do the circles change in form and size as you stretch the balloon? Also, why would you stretch the balloon into a rectangular shape? Why do you think you should keep the equator and the lines of longitude straight in a projection?
- Work together to pin the stretched-out balloon onto the cardboard Caution: Be sure to put the push pins in slanted slightly outward (away from the balloon). Push pins that are pointing straight down or with the colored tips pointing inward might shoot out due to the tension in the balloon, causing a hazard.
- Occasionally, a balloon might rip in the process. If it does, hold the ripped edge with your fingers to make the observations. An extra push pin can sometimes help hold a ripped balloon.
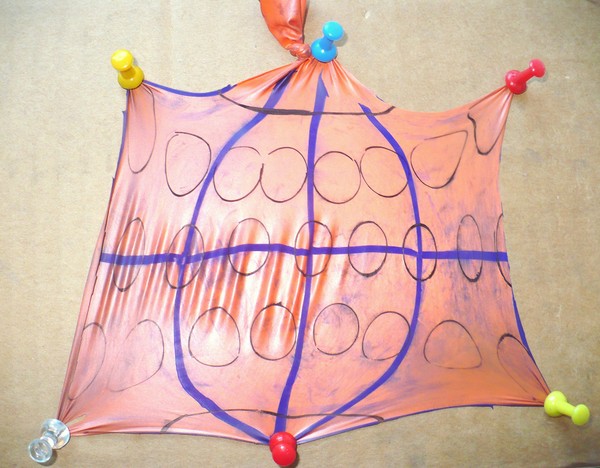
- Look at your flat map, especially the size of the circles. Are all the circles still the same size? If not, can you find regions on your map where they are? Remember, all the circles were identical in size on your globe.
- Look at your flat map again, now concentrating on the distance between the circles. Are the circles still the same distance from each other? Remember, the circles on the equator were equidistant from each other; so were the circles between the equator and each pole. Also, the circles in the northern and southern hemispheres were drawn midway between the equator and each pole. Is this still the case on your flat map?
- Look at your flat map once more, now concentrating on the shapes of the circles. Do all of the circles still look like circles? Do your observations indicate distortions in your map? Remember that you started with equally sized circles.
/-/https/www.sciencebuddies.org/cdn/Files/5597/13/drawing-circles-collage.jpg)
/-/https/www.sciencebuddies.org/cdn/Files/18105/6/cut-balloon-collage.jpg)
/-/https/www.sciencebuddies.org/cdn/Files/5600/13/stretched-balloon.jpg)
/-/https/www.sciencebuddies.org/cdn/Files/5605/12/slanted-pin.jpg)
/-/https/www.sciencebuddies.org/cdn/Files/5602/13/balloon-map.jpg)
Extra: Investigate if the relative direction of the circles, with respect to each other, is maintained in your projection. How would you describe the direction of a circle with respect to another in terms of north, northeast, etc. on your map? Is this identical to how you would have described the relative direction of that circle to the others on the globe? If so, the direction has been maintained in that area of your map.
Extra: The projection you created is similar to the Mercator projection frequently used to create world maps. Find a Mercator projection world map and compare the size of North America and Africa. Having done this activity and after looking at the Mercator world map, would you conclude that North America is bigger than Africa, smaller than Africa, about equal in size, or do you not have enough information to compare their sizes?
/-/https/www.sciencebuddies.org/cdn/Files/5592/12/mercator-map.jpg)
Observations and Results
Were the circles no longer identical in size on the map? Were they still circles?
As parts of the balloon get stretched more than others, the size of the circles is no longer identical on the map. This indicates that relative size and distance are distorted in this projection. Circles on the equator (or any other line of latitude) are still mostly equal in size, indicating that features located on the same line of latitude can be compared in size. Compared to the size at the equator, enlargement gets more prominent as you move away from the equator, and is most extreme at the poles. This explains why Mercator projections can provide misleading information when comparing size or distance. Note that you cannot extrapolate all of your findings to Mercator projection. The balloon map you just created shows distortions on the edges that would not appear in Mercator projections.
On your projection, most circles should still look like circles, indicating that shape is maintained in those areas of the map and directions of the features relative to each other are maintained. In a real Mercator projection, the lines of longitude are perfectly straight and direction is exactly maintained, making them particularly useful in navigation.
Ask an Expert
Additional Resources
- Geography, from Mr. Nussbaum
- What is Cartography?, from InfoBloom
/-/https/img.youtube.com/vi/xbpMddOoq9U/0.jpg)
/-/https/img.youtube.com/vi/amyaYsJLjss/0.jpg)
/-/https/img.youtube.com/vi/vw-iTxNdnrw/0.jpg)